Download as PDF, PPTX
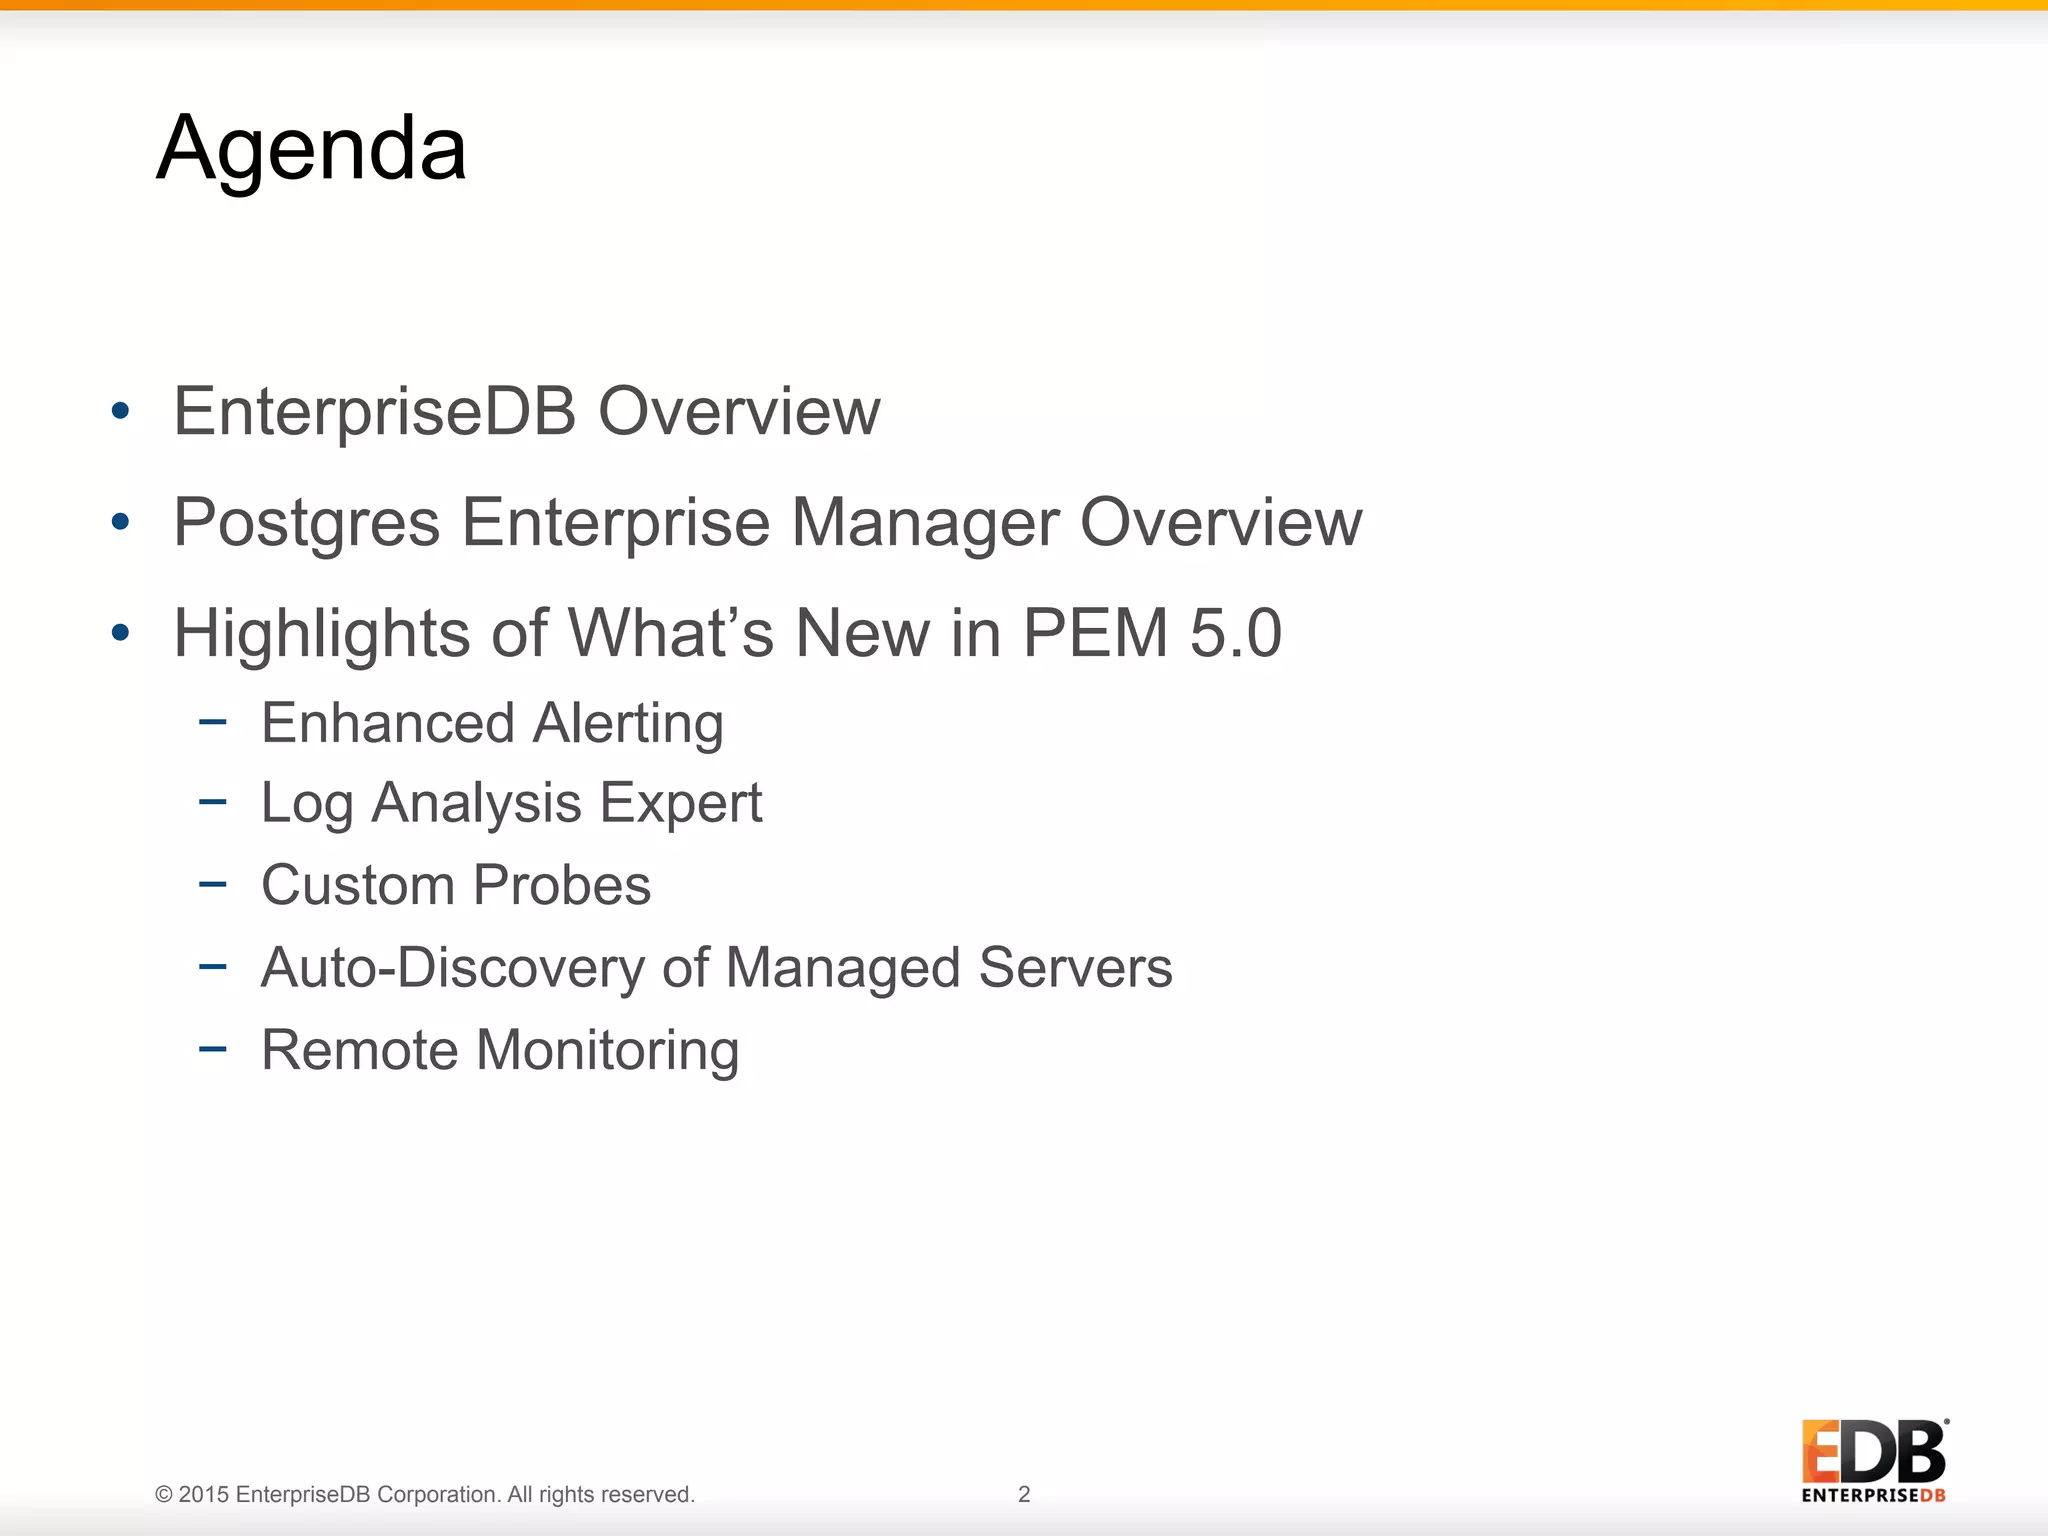
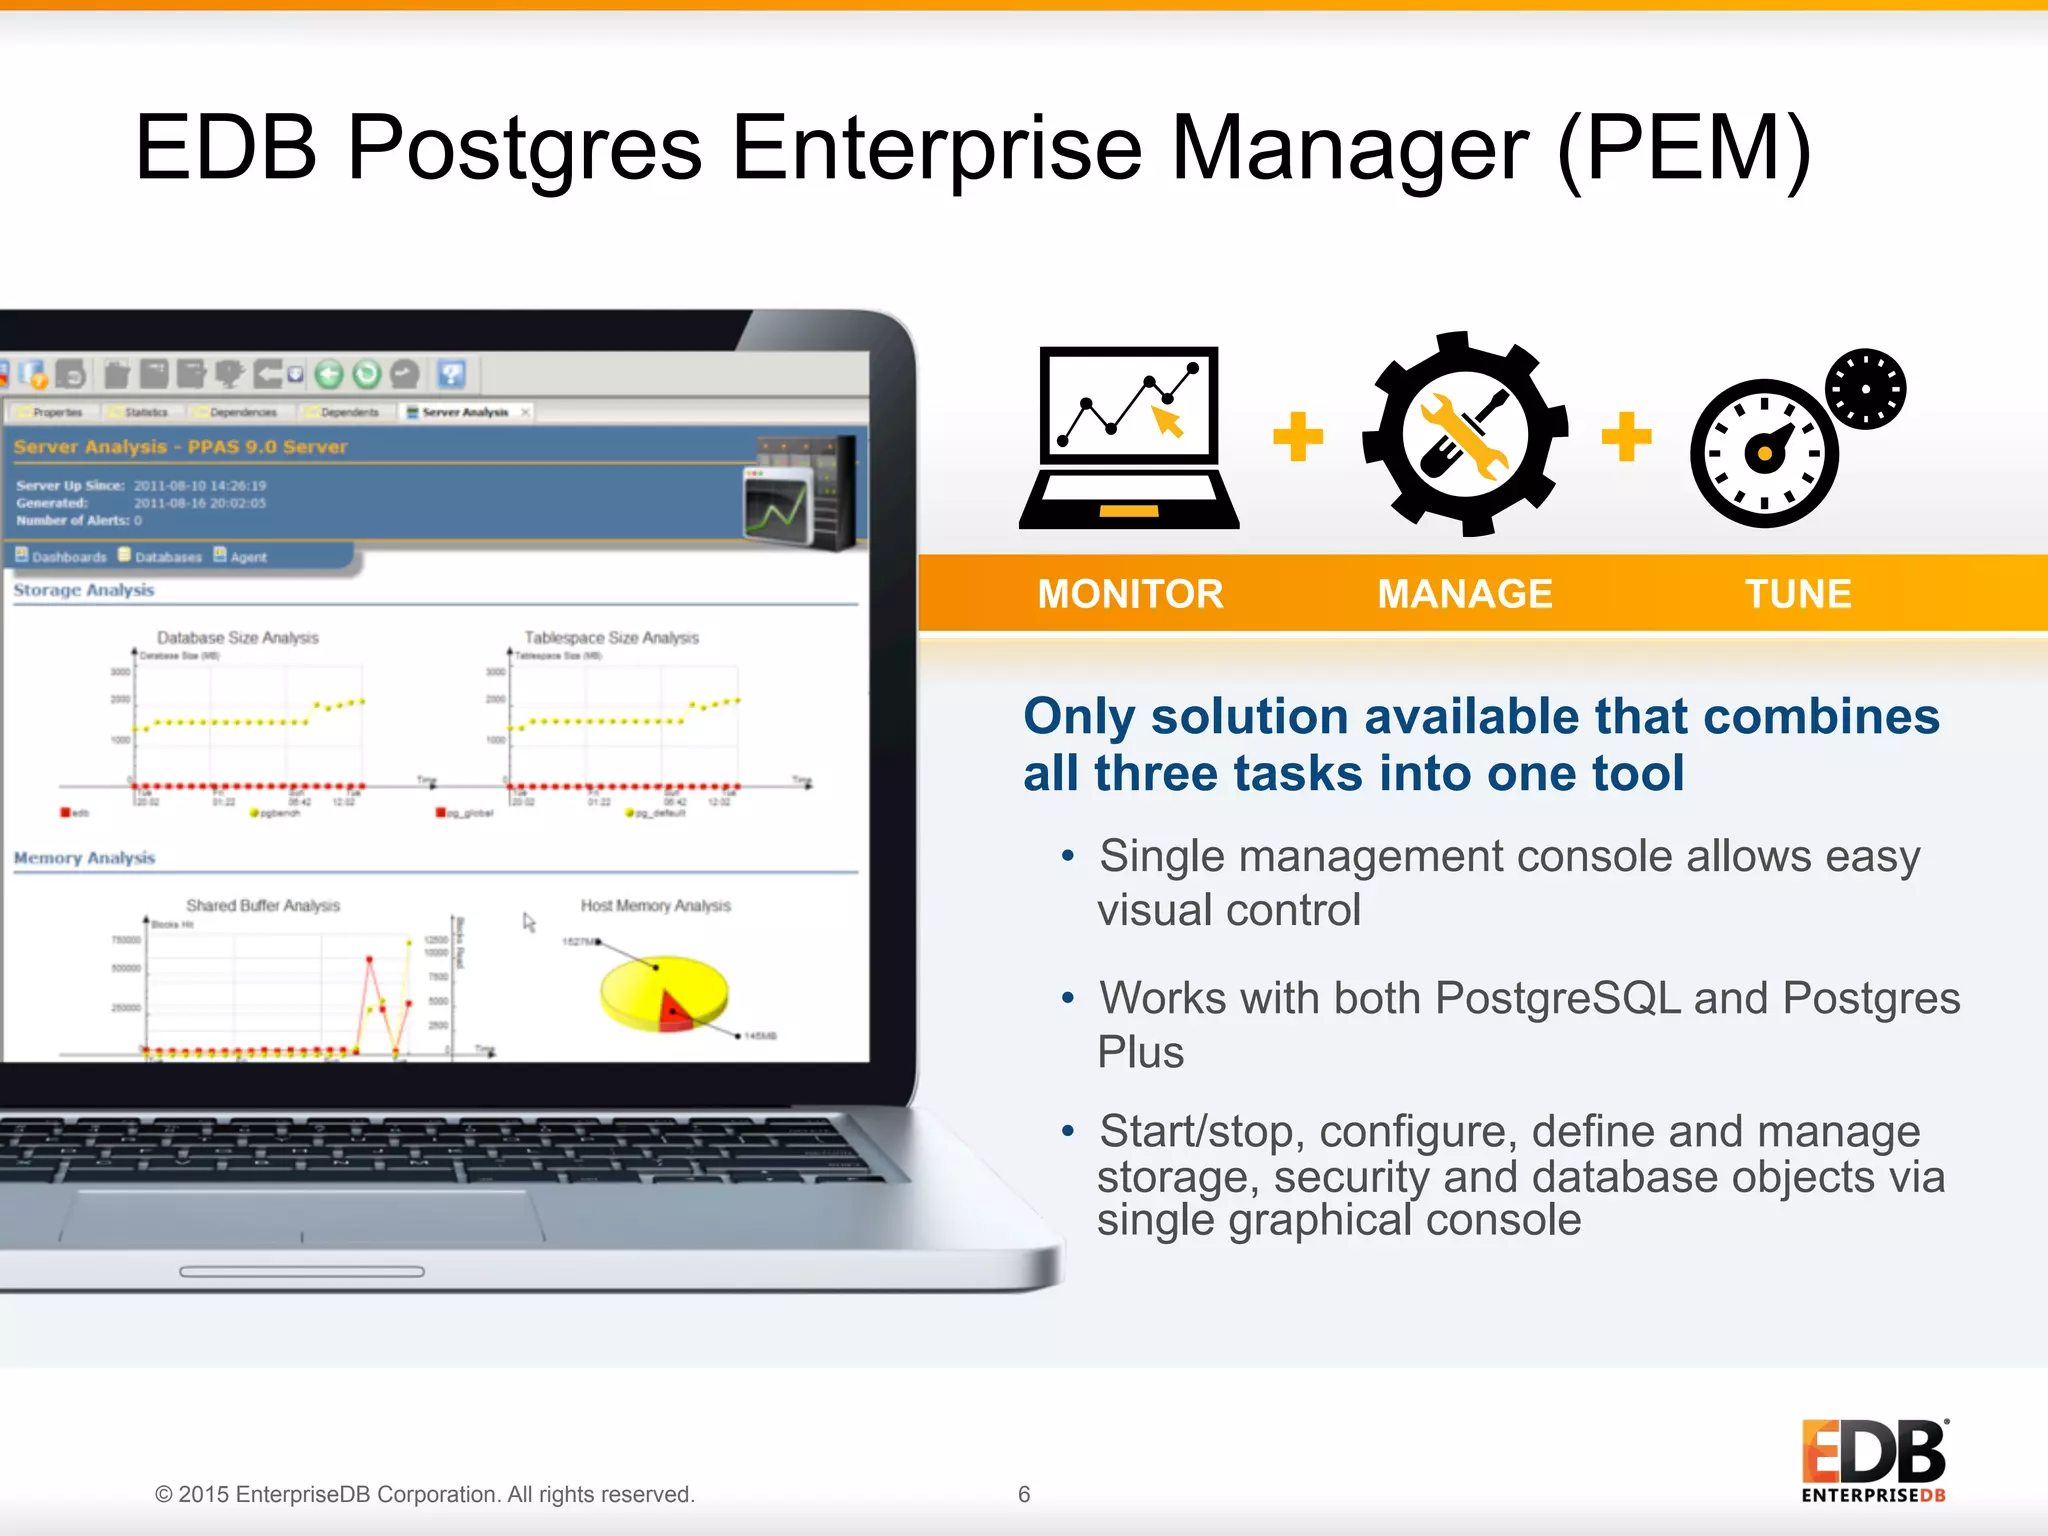
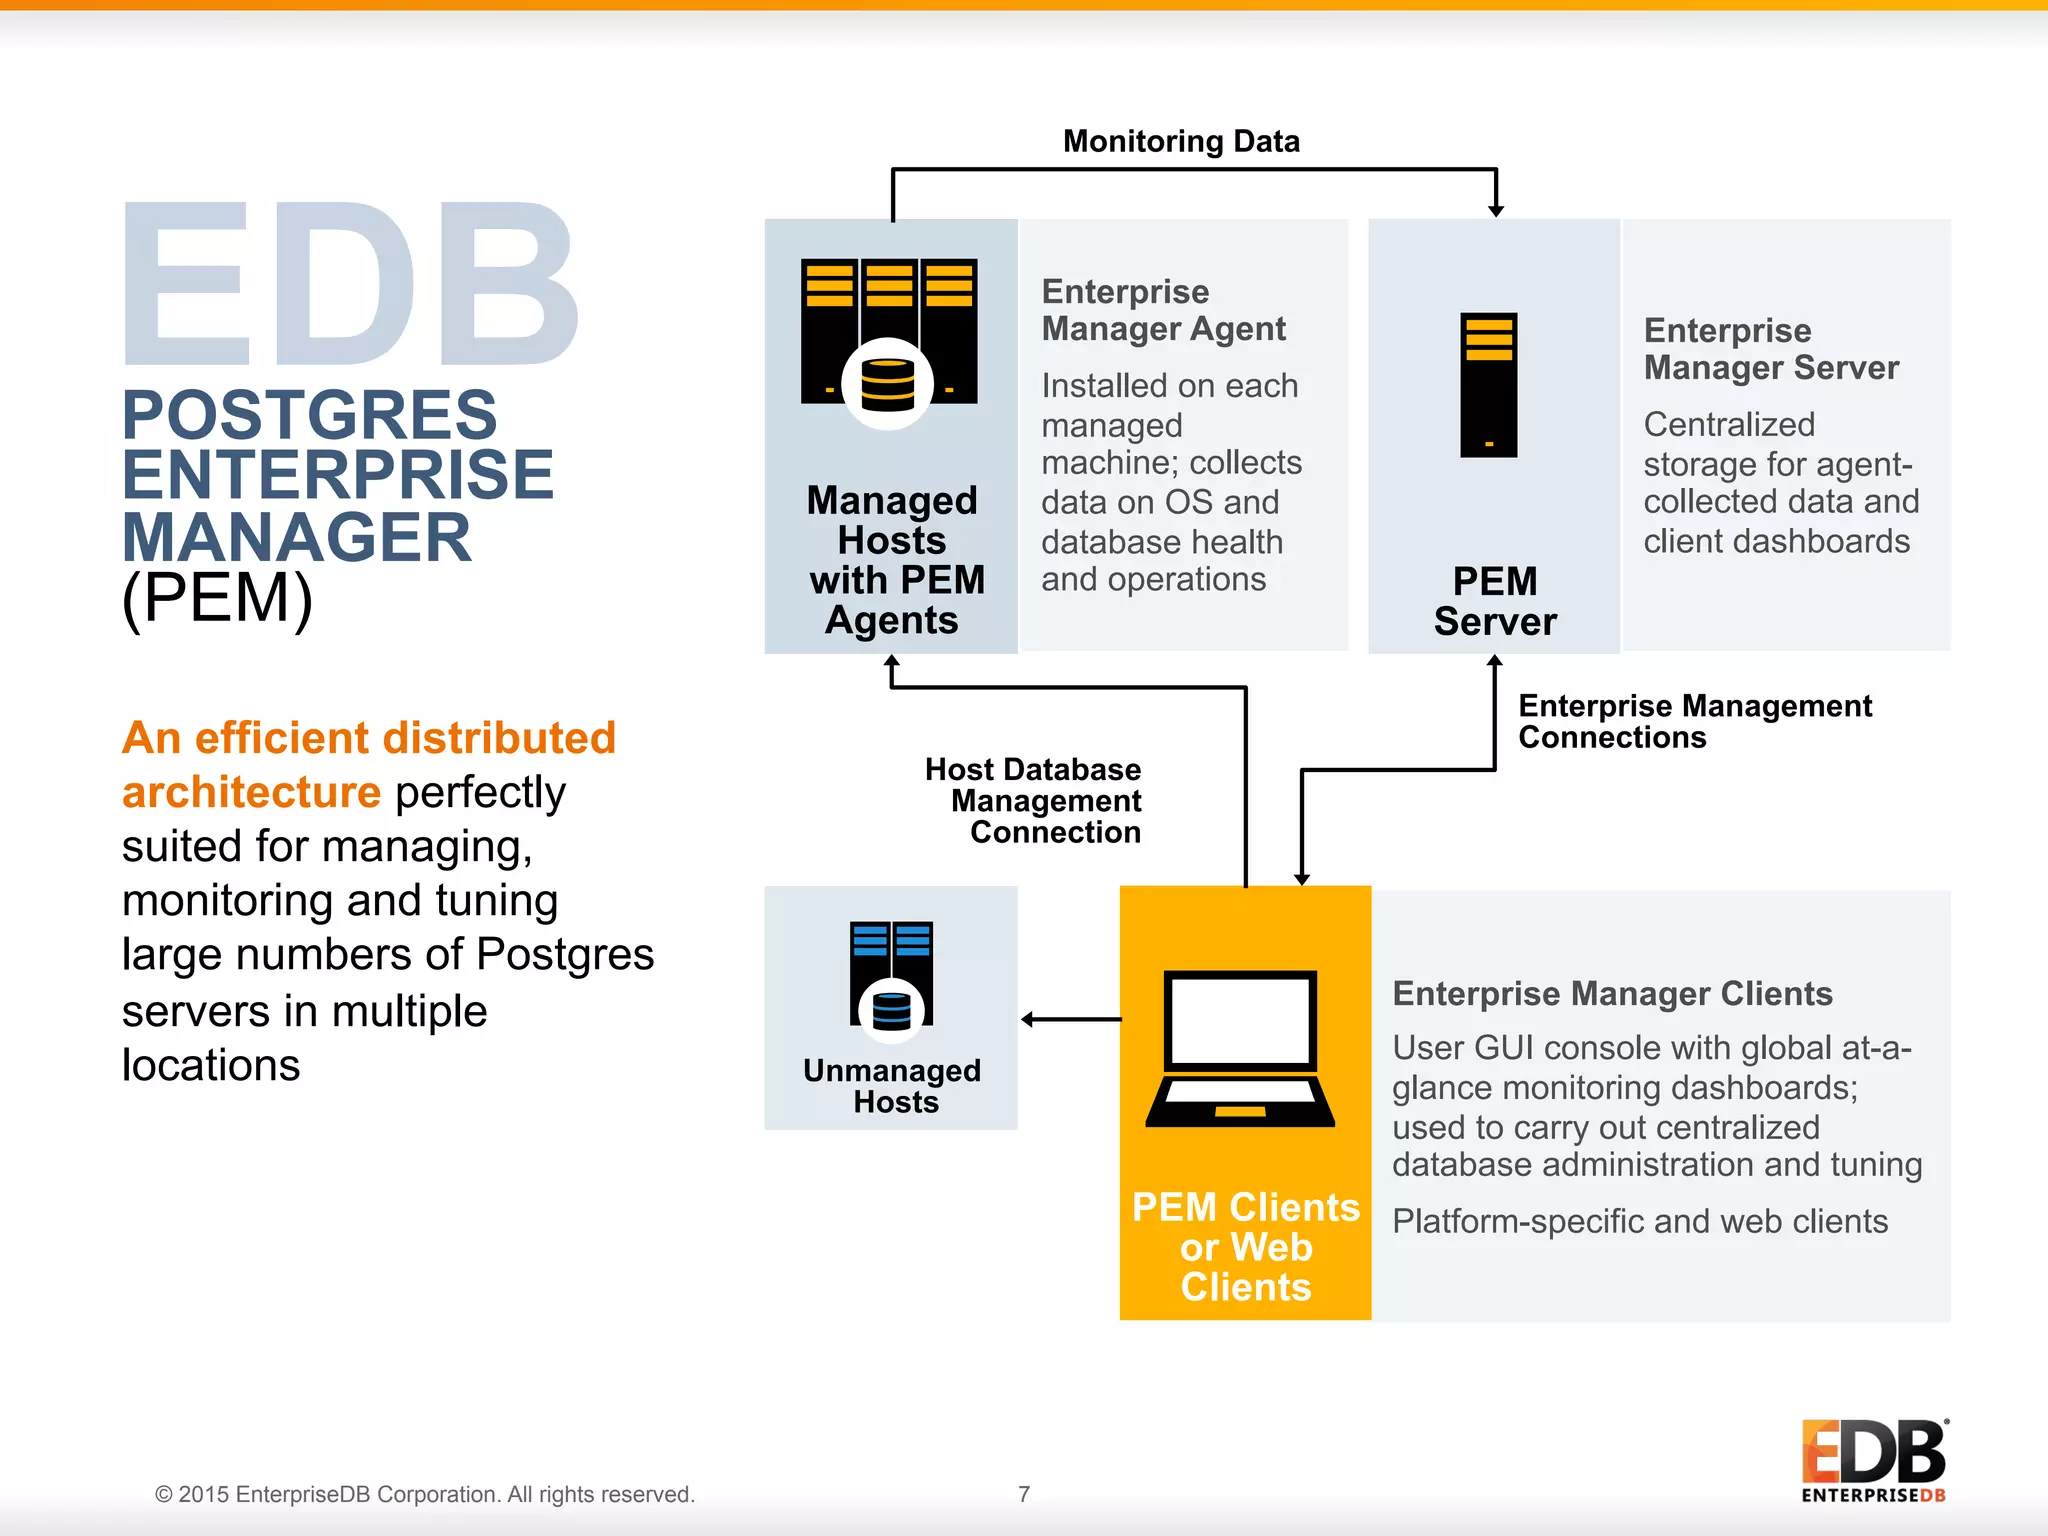
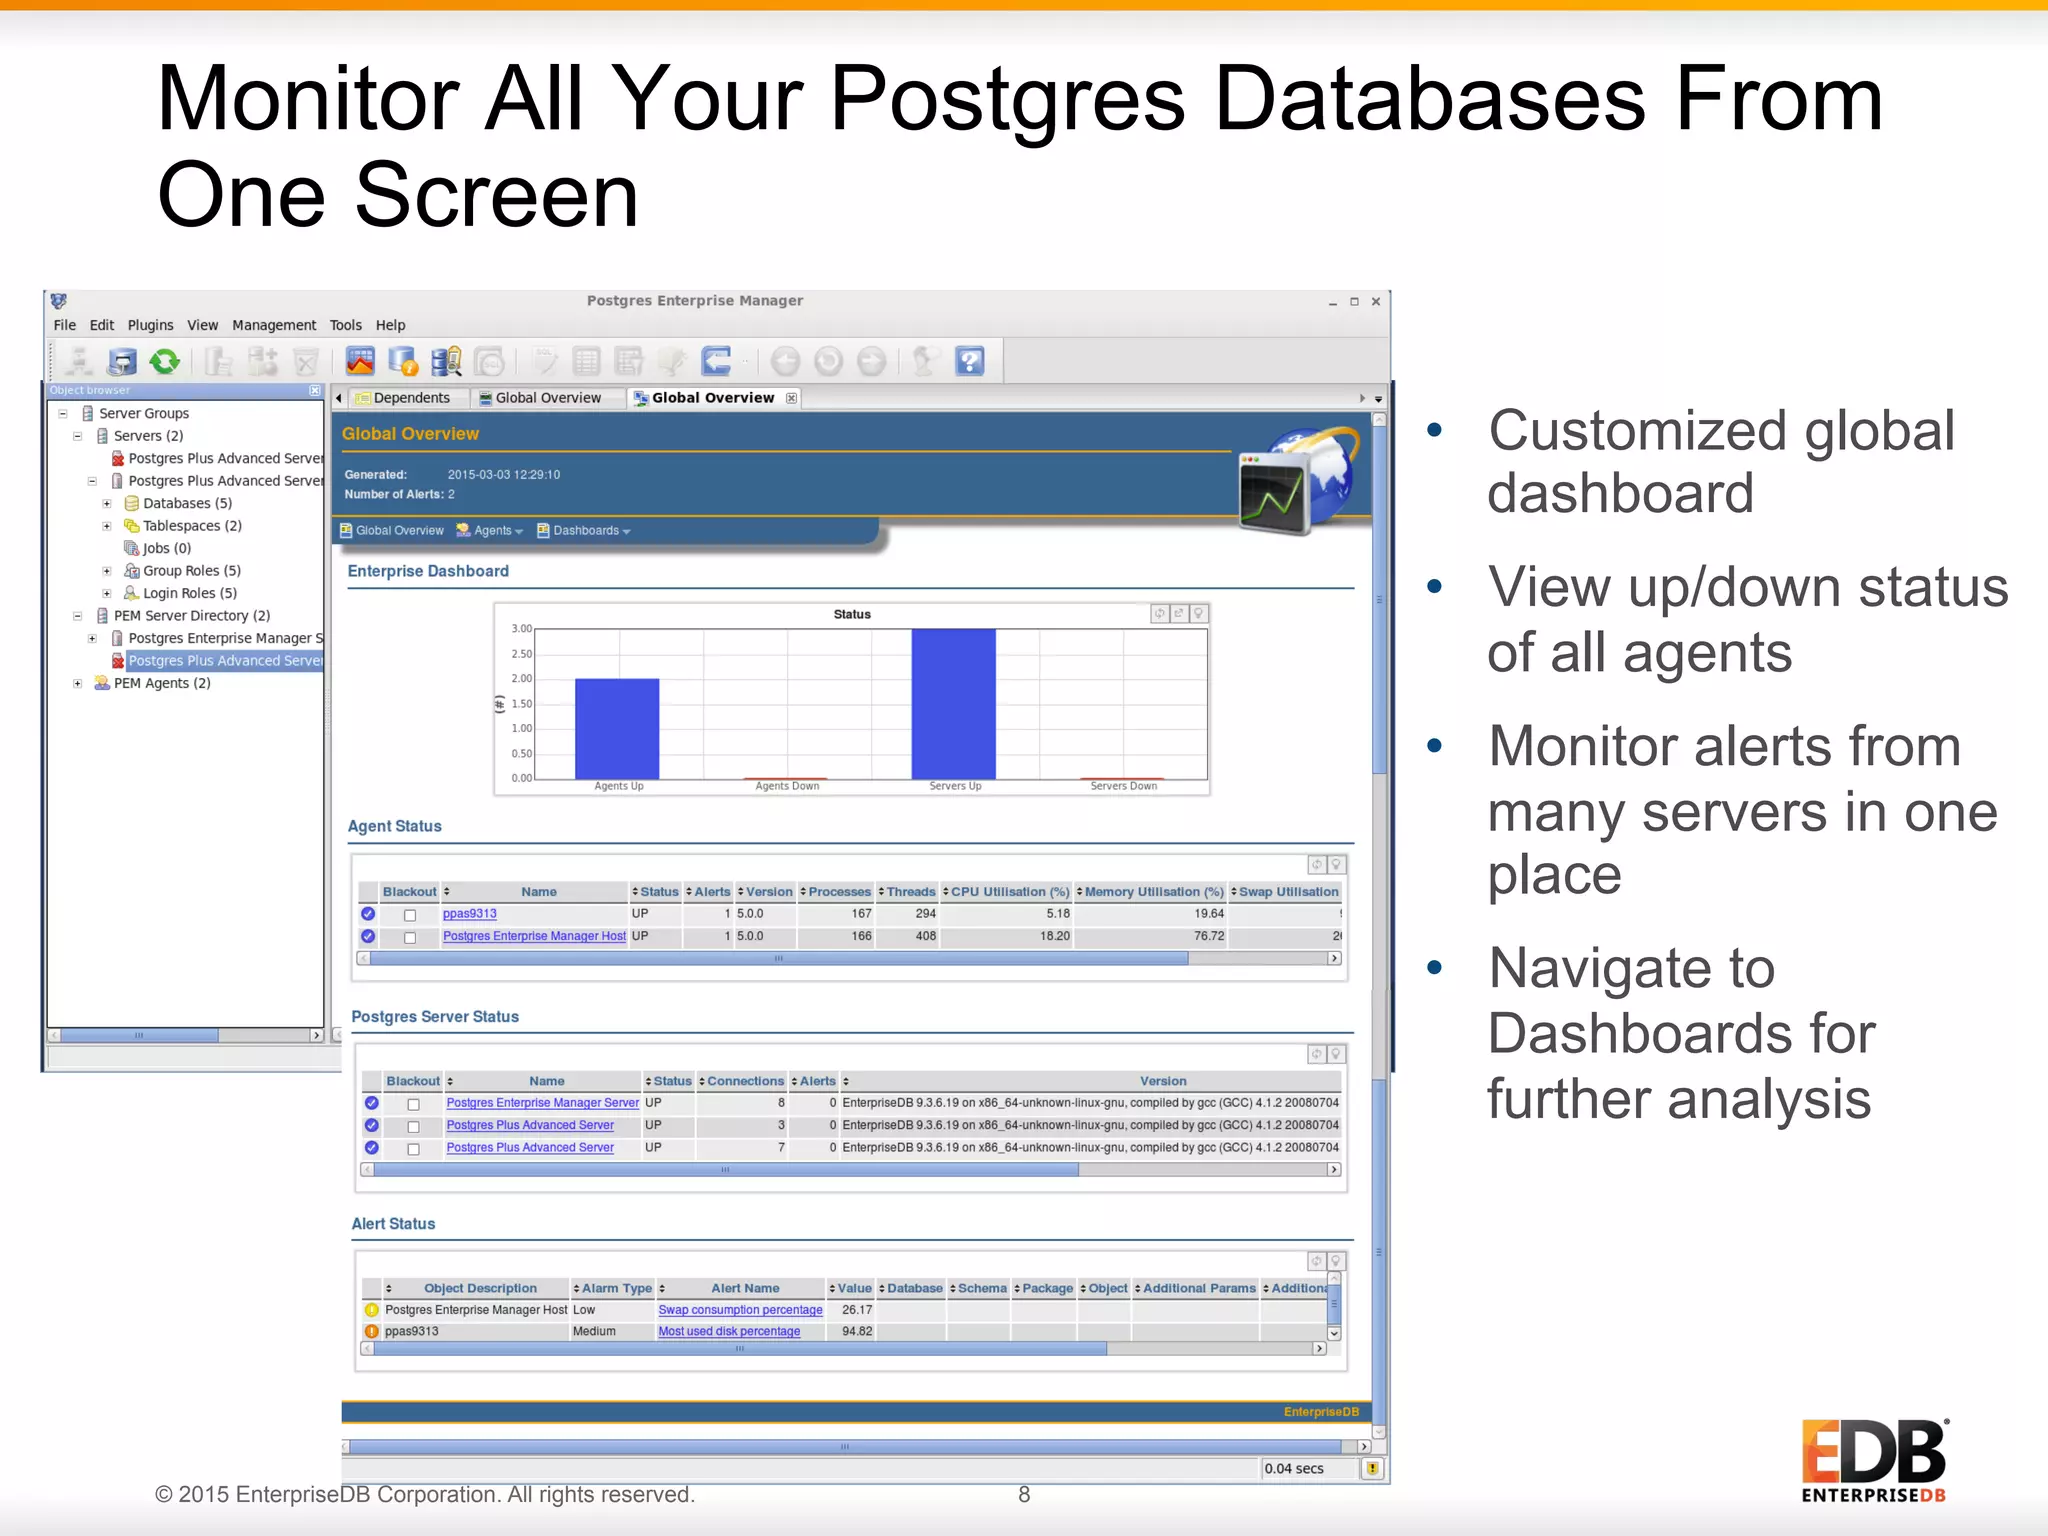
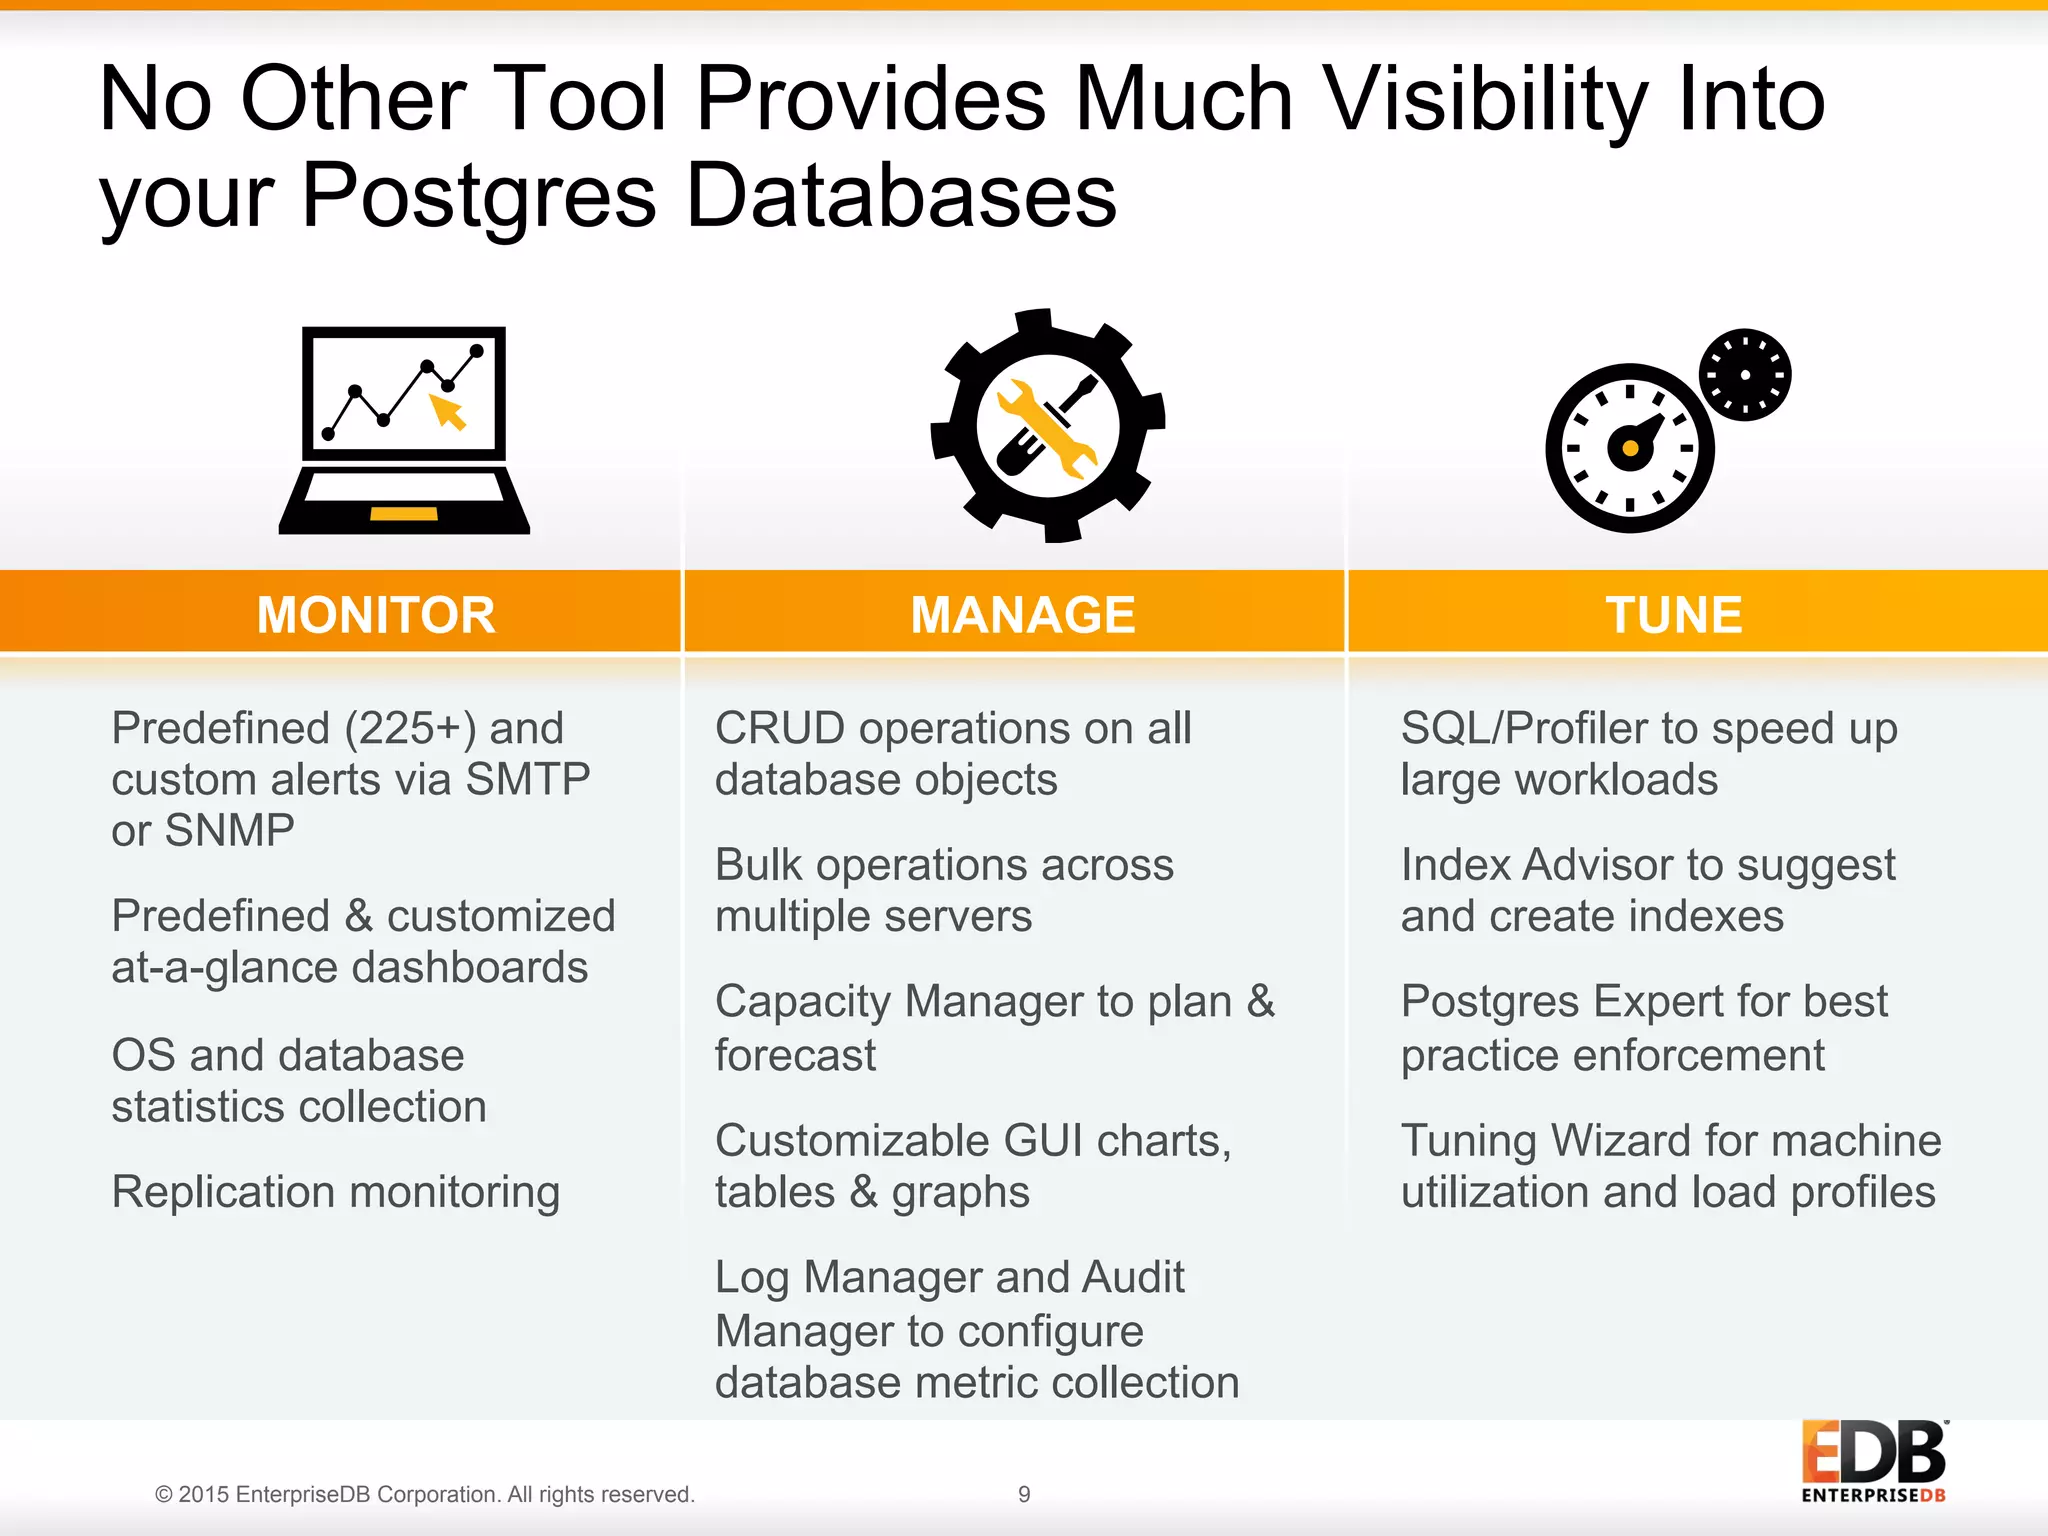
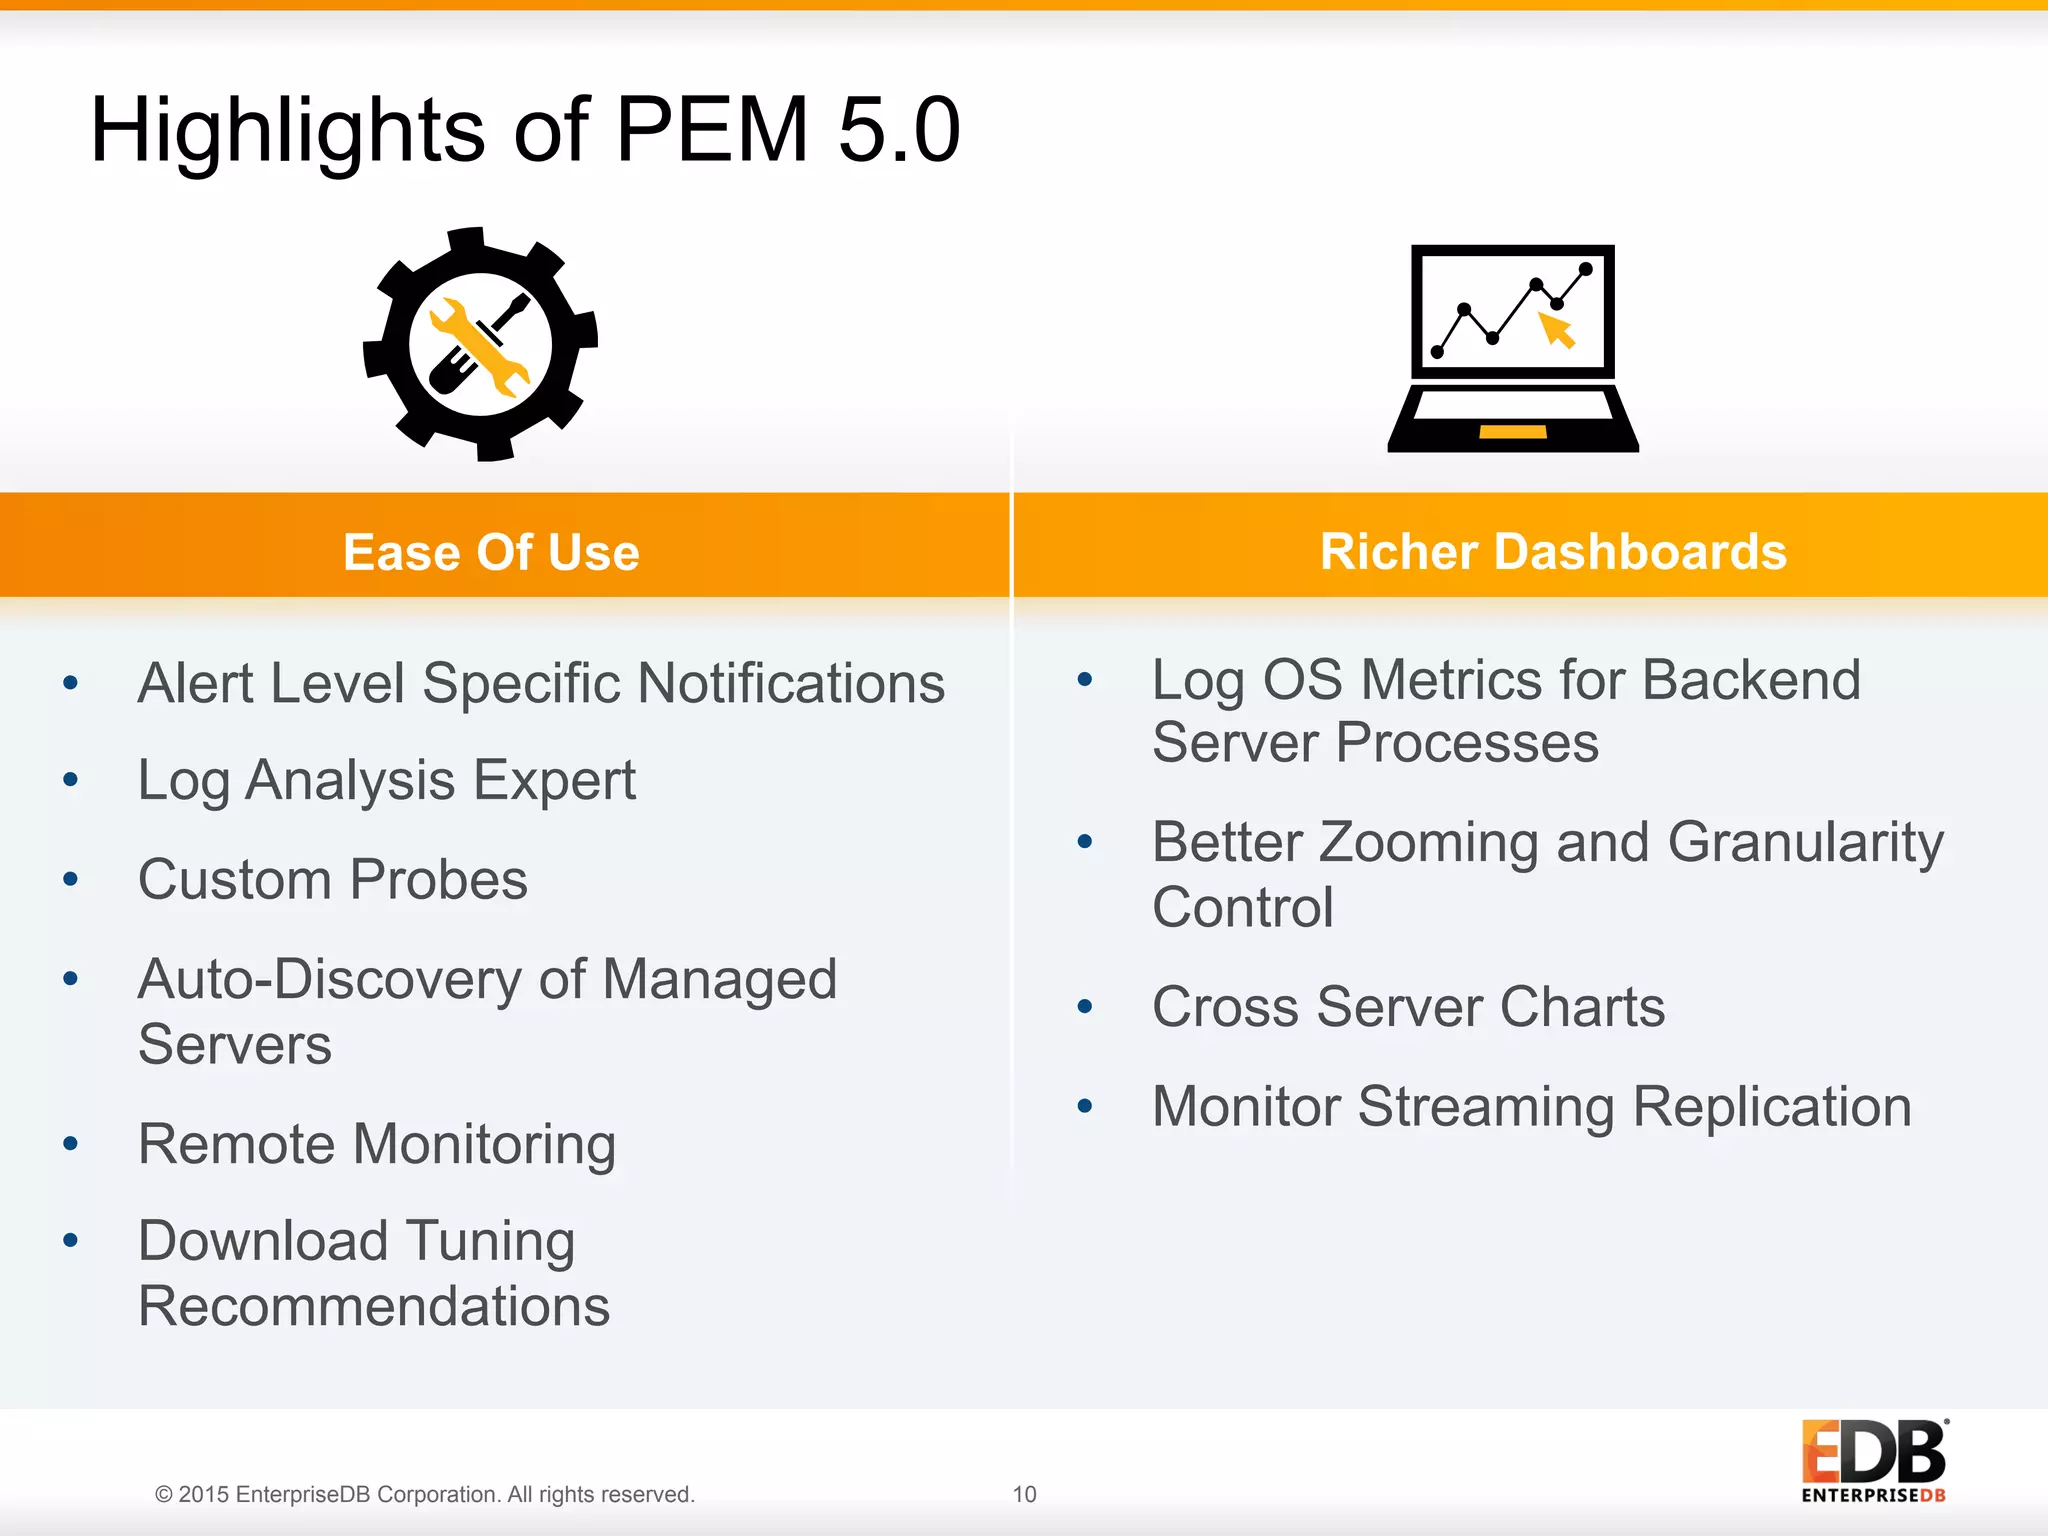
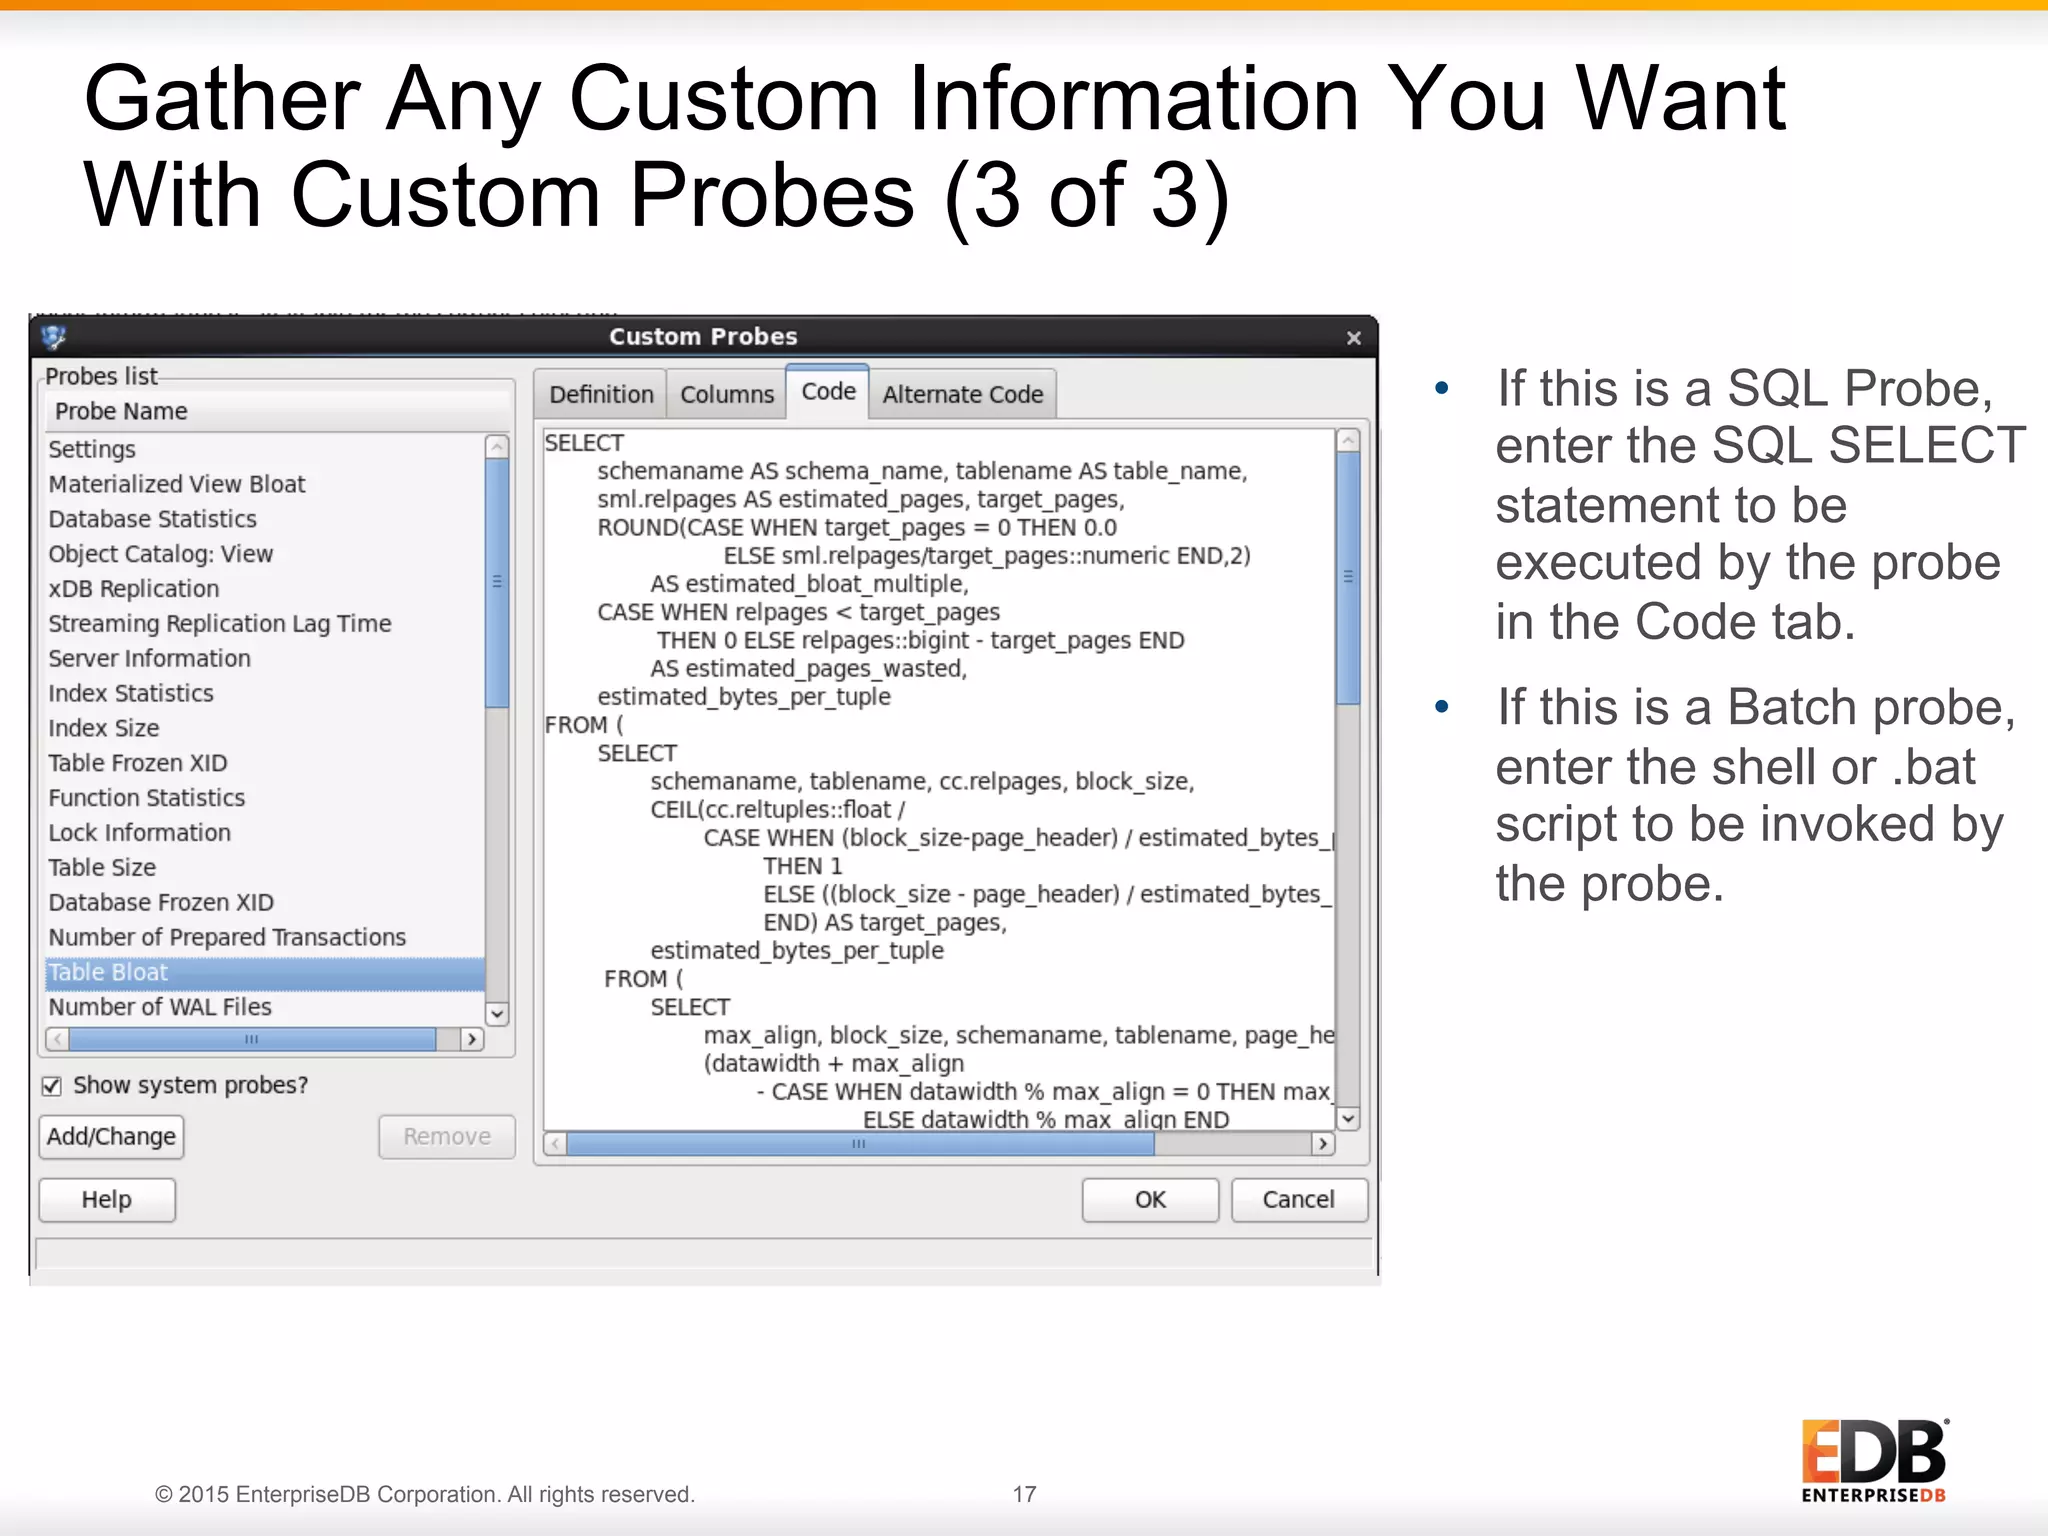
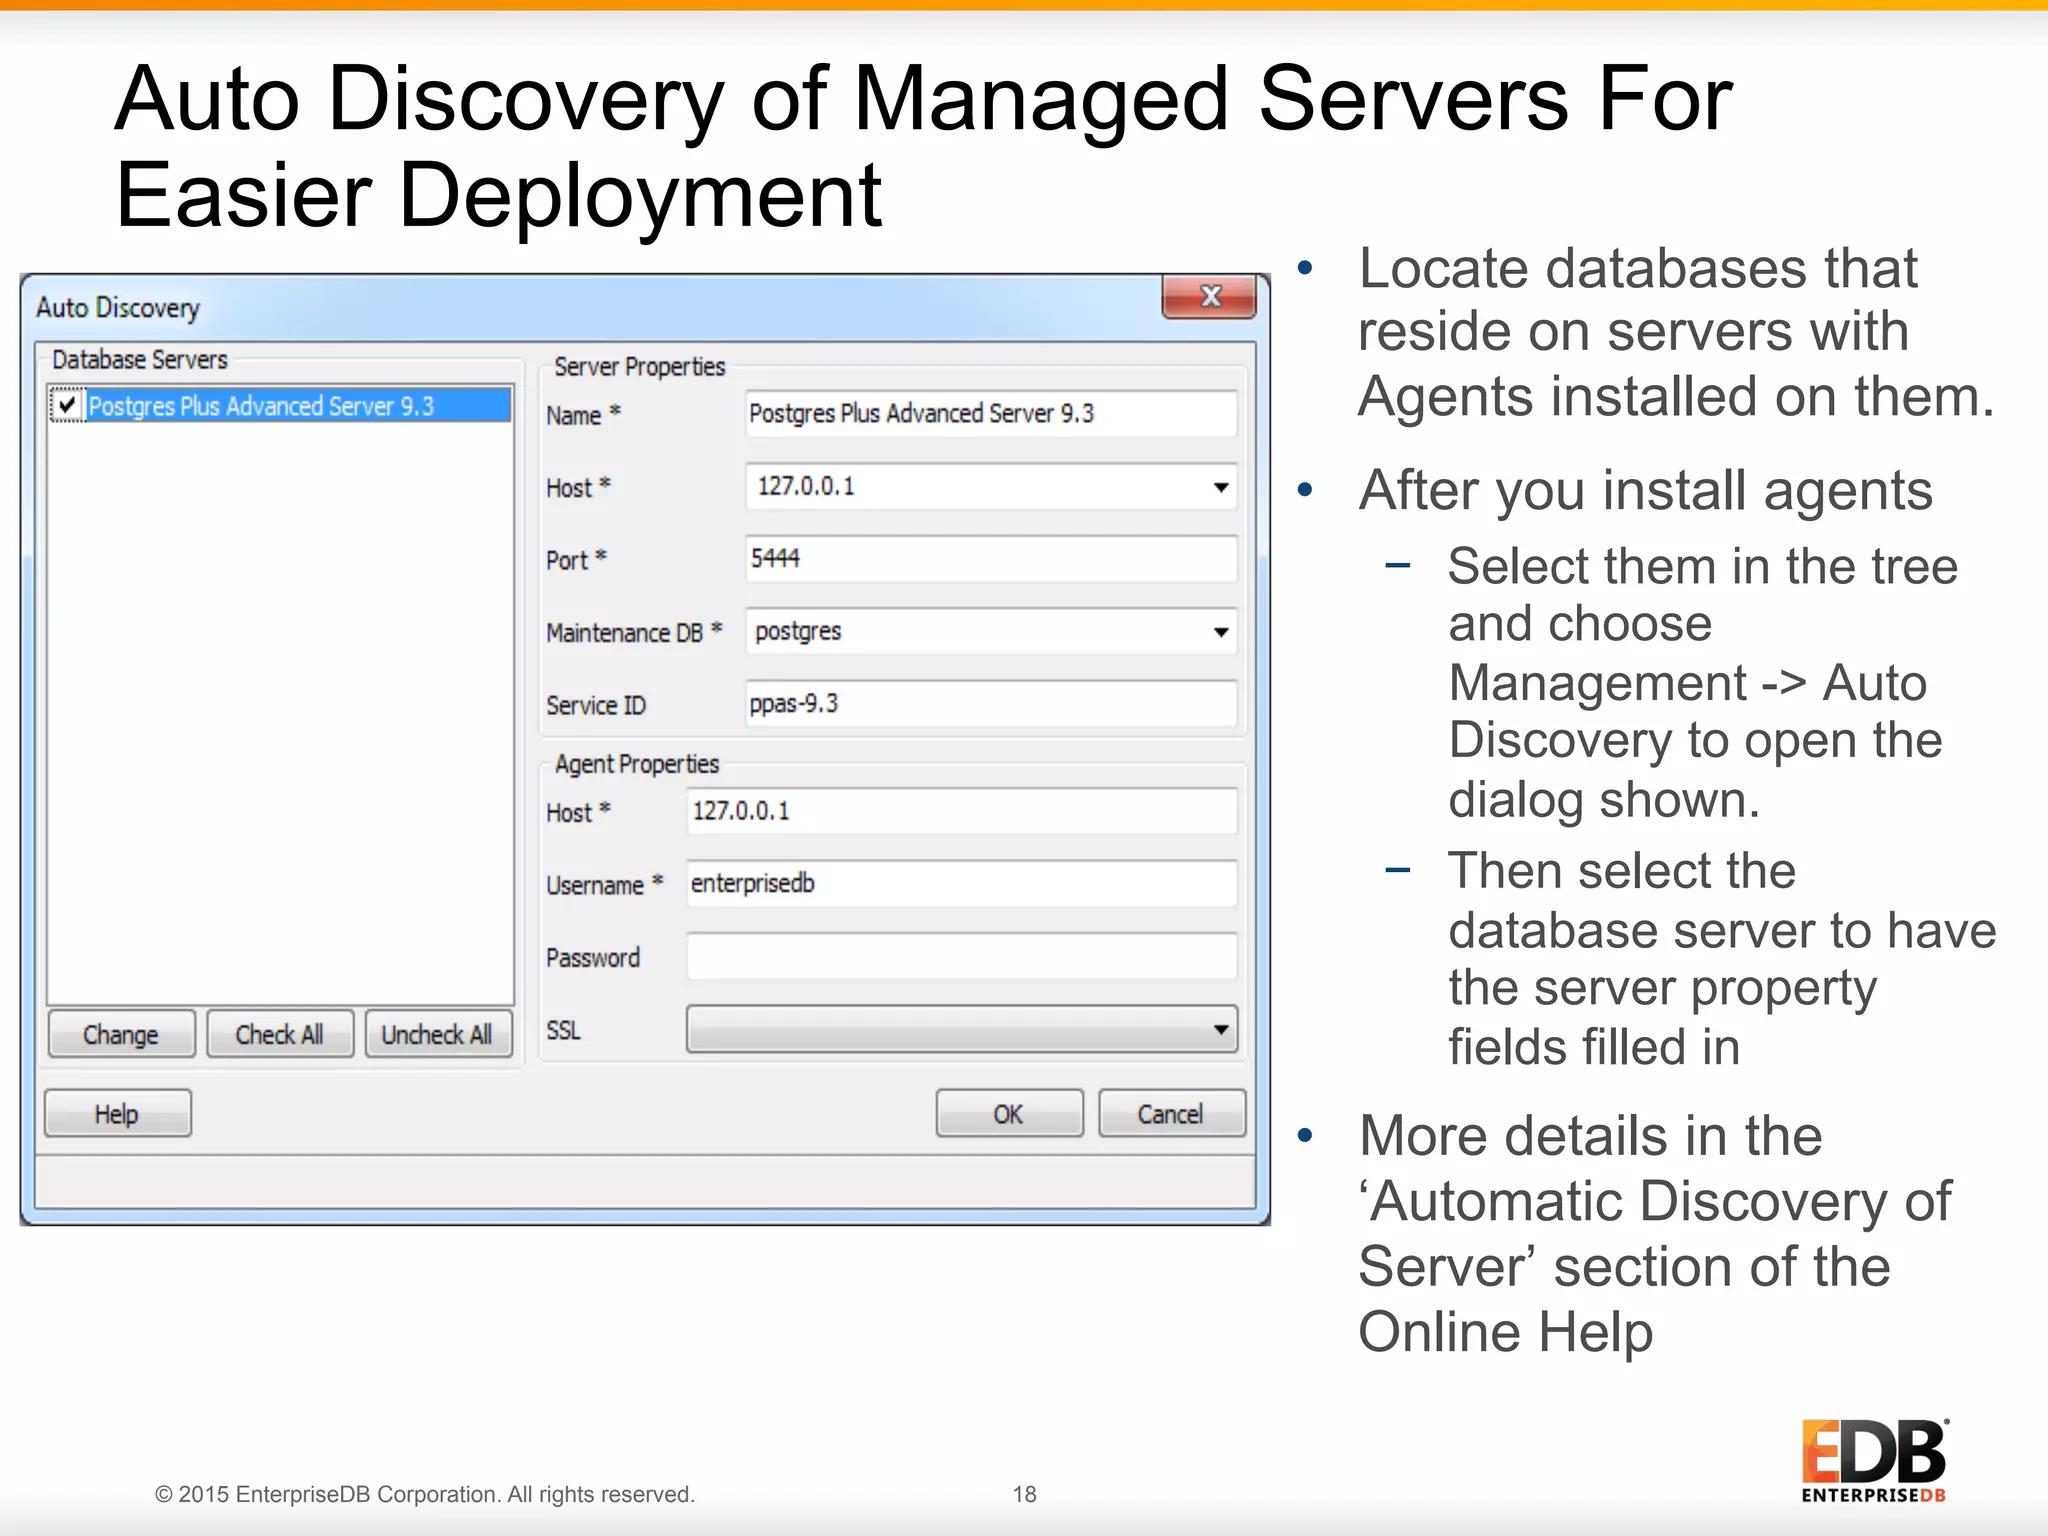
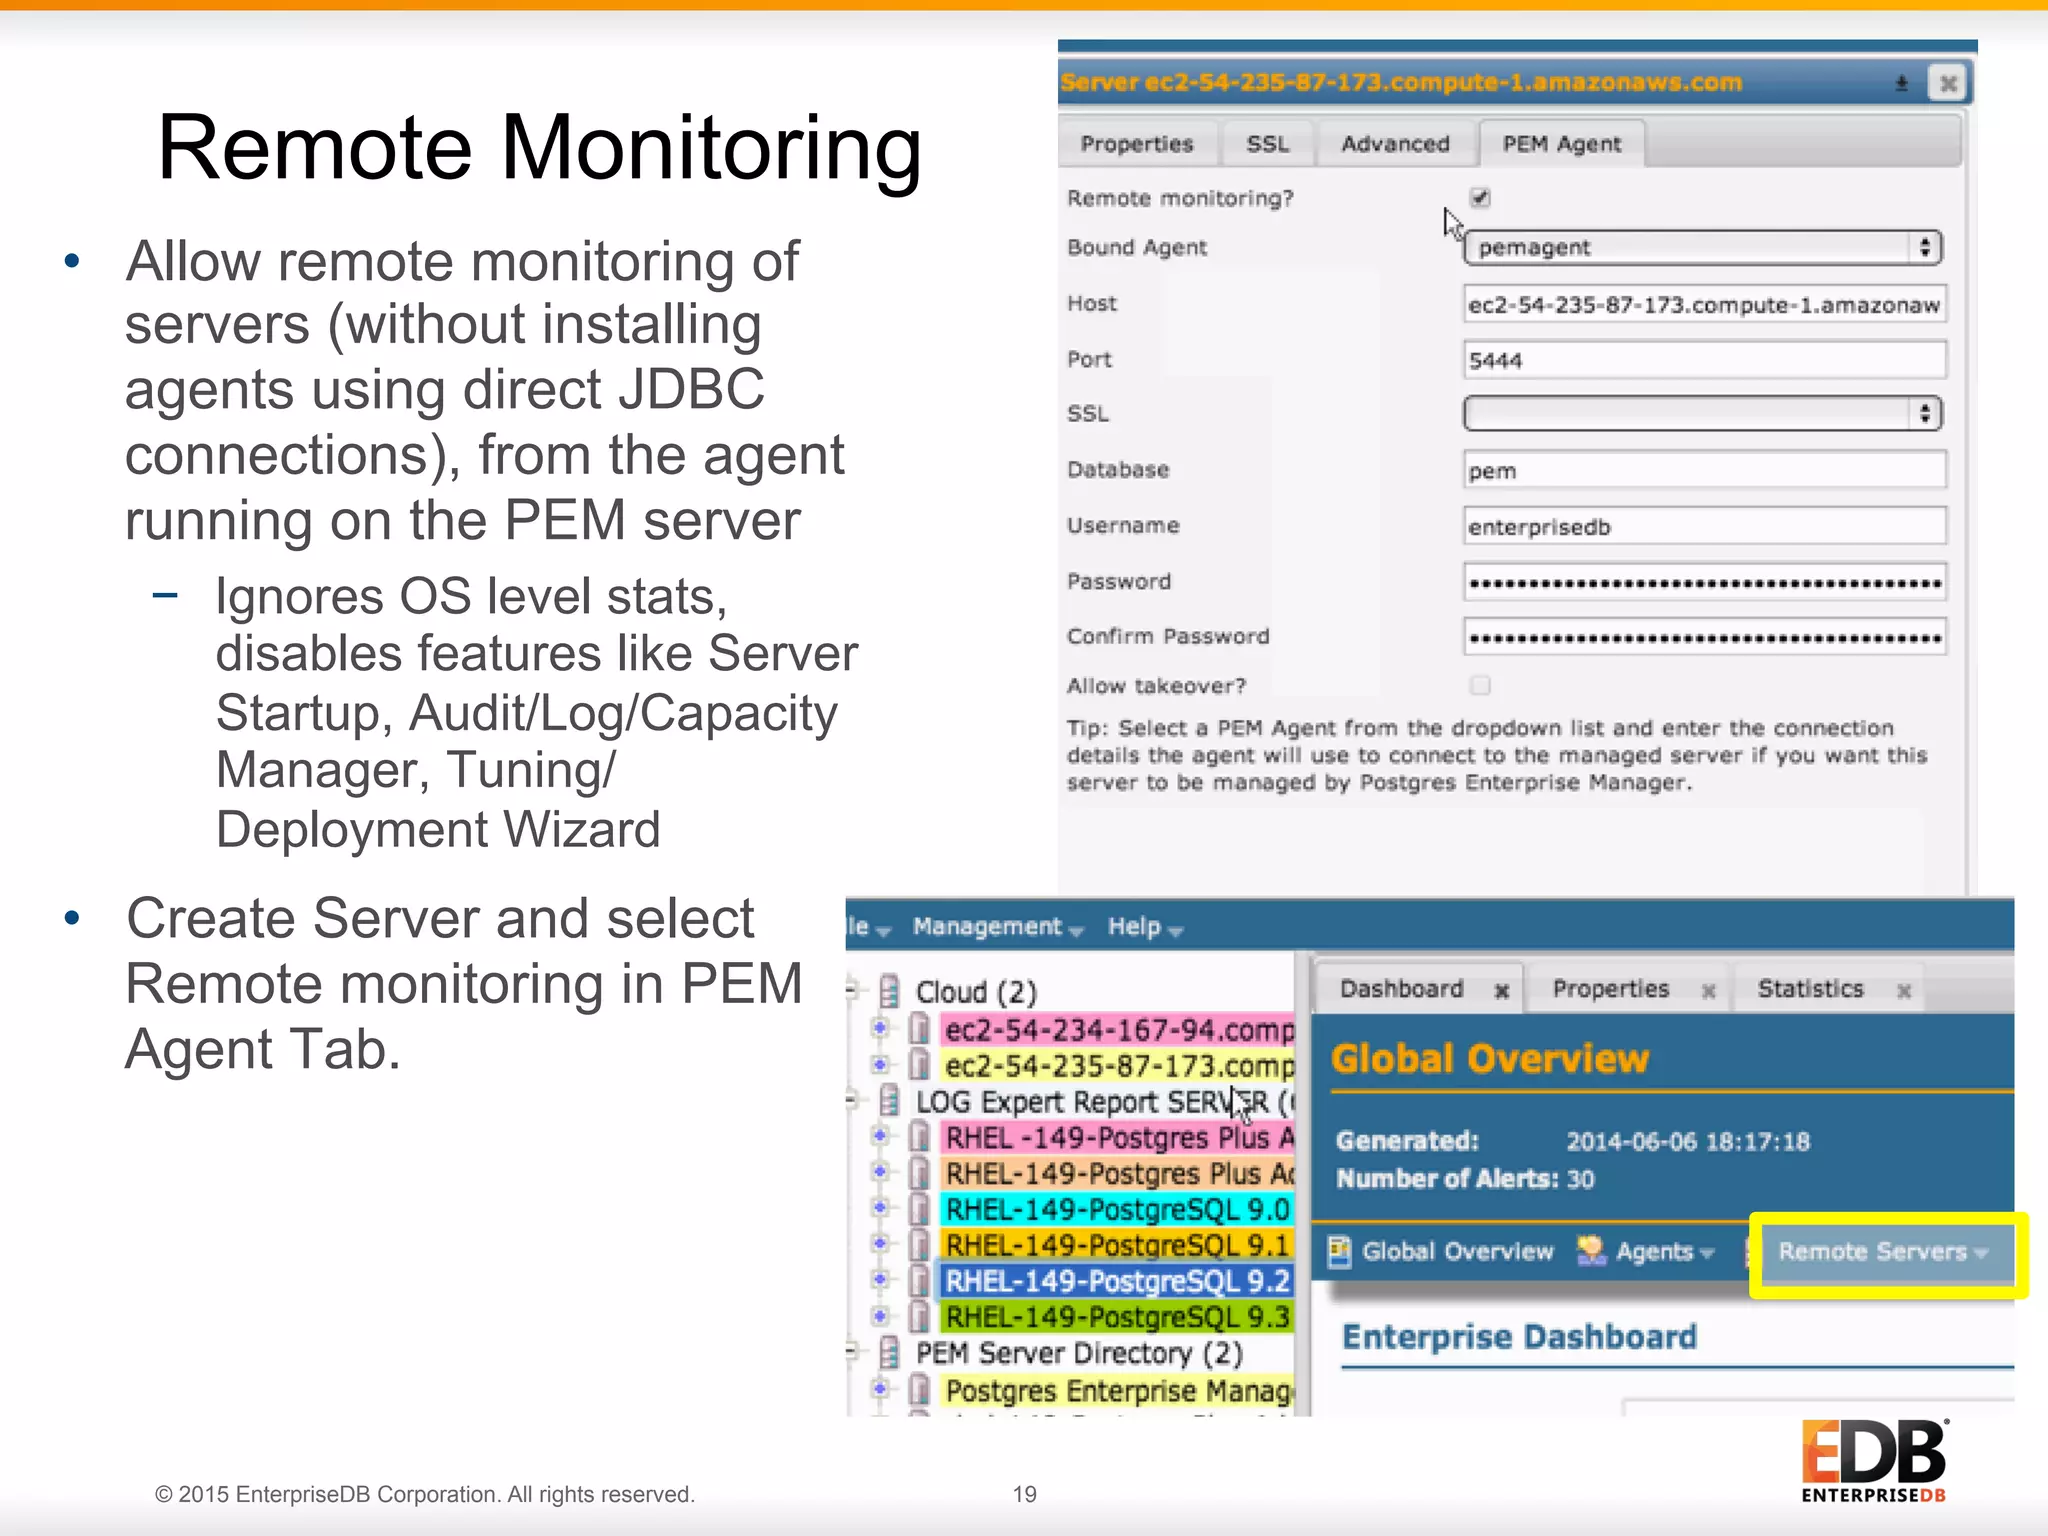
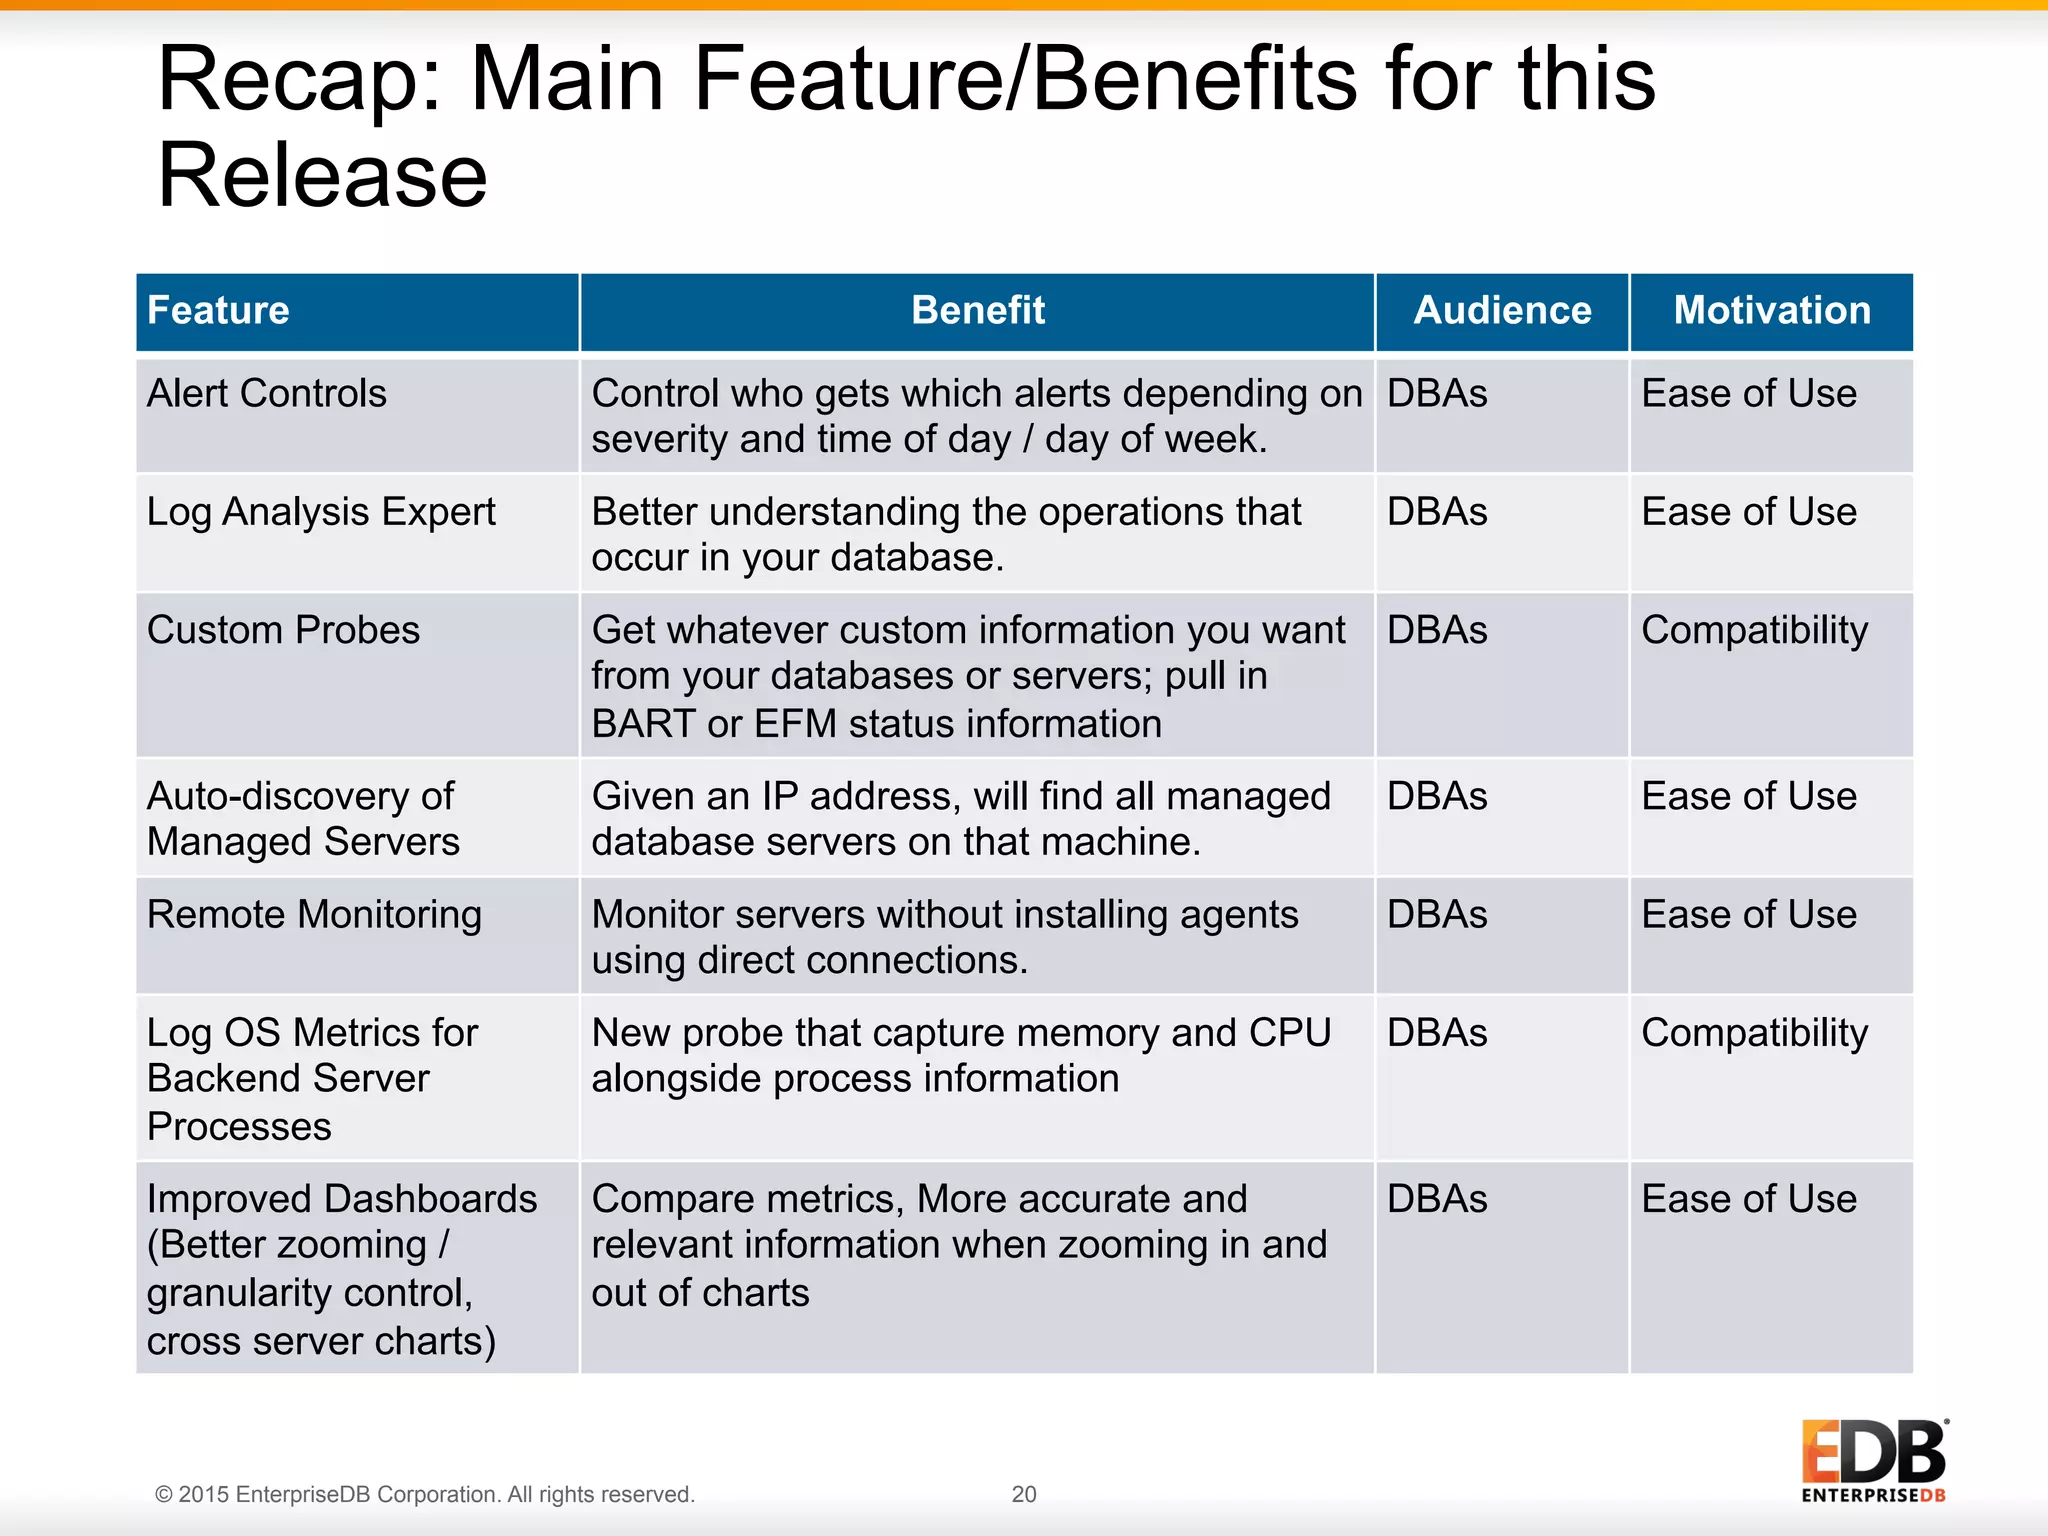

The document provides an overview of Postgres Enterprise Manager (PEM) 5.0, highlighting new features like enhanced alerting, log analysis expert, custom probes, auto-discovery of managed servers, and remote monitoring. It discusses the tool's capabilities for managing, monitoring, and tuning multiple Postgres servers through a single management console. Additionally, it emphasizes ease of use for database administrators and offers links for further information and downloads.