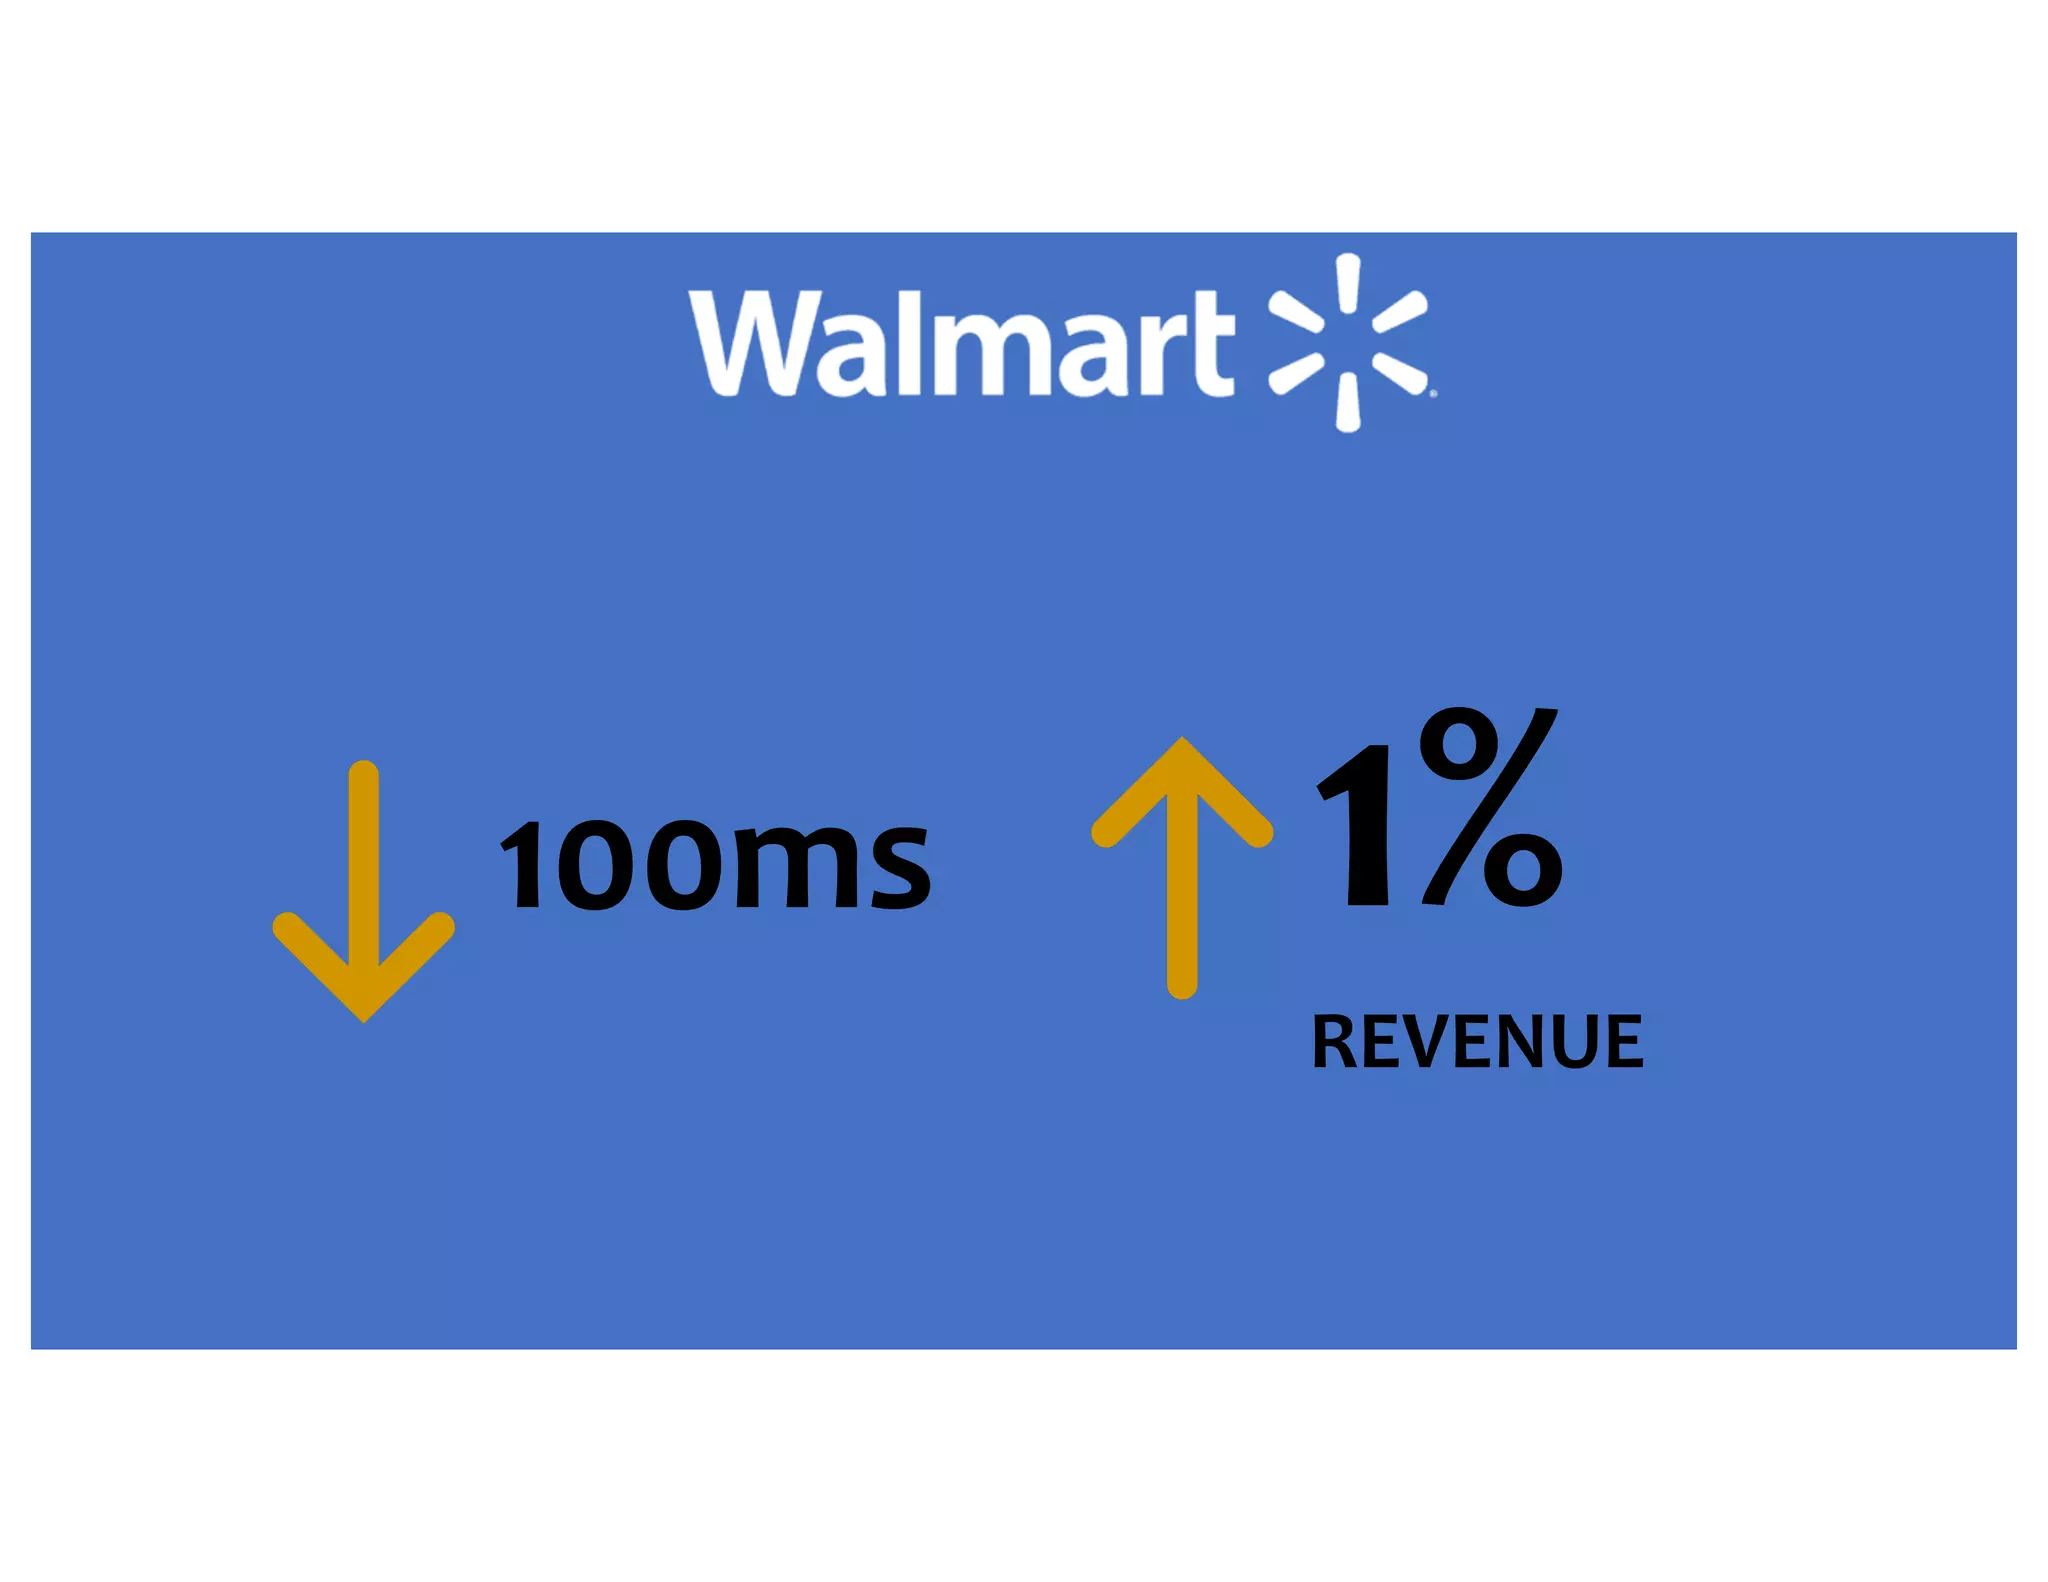
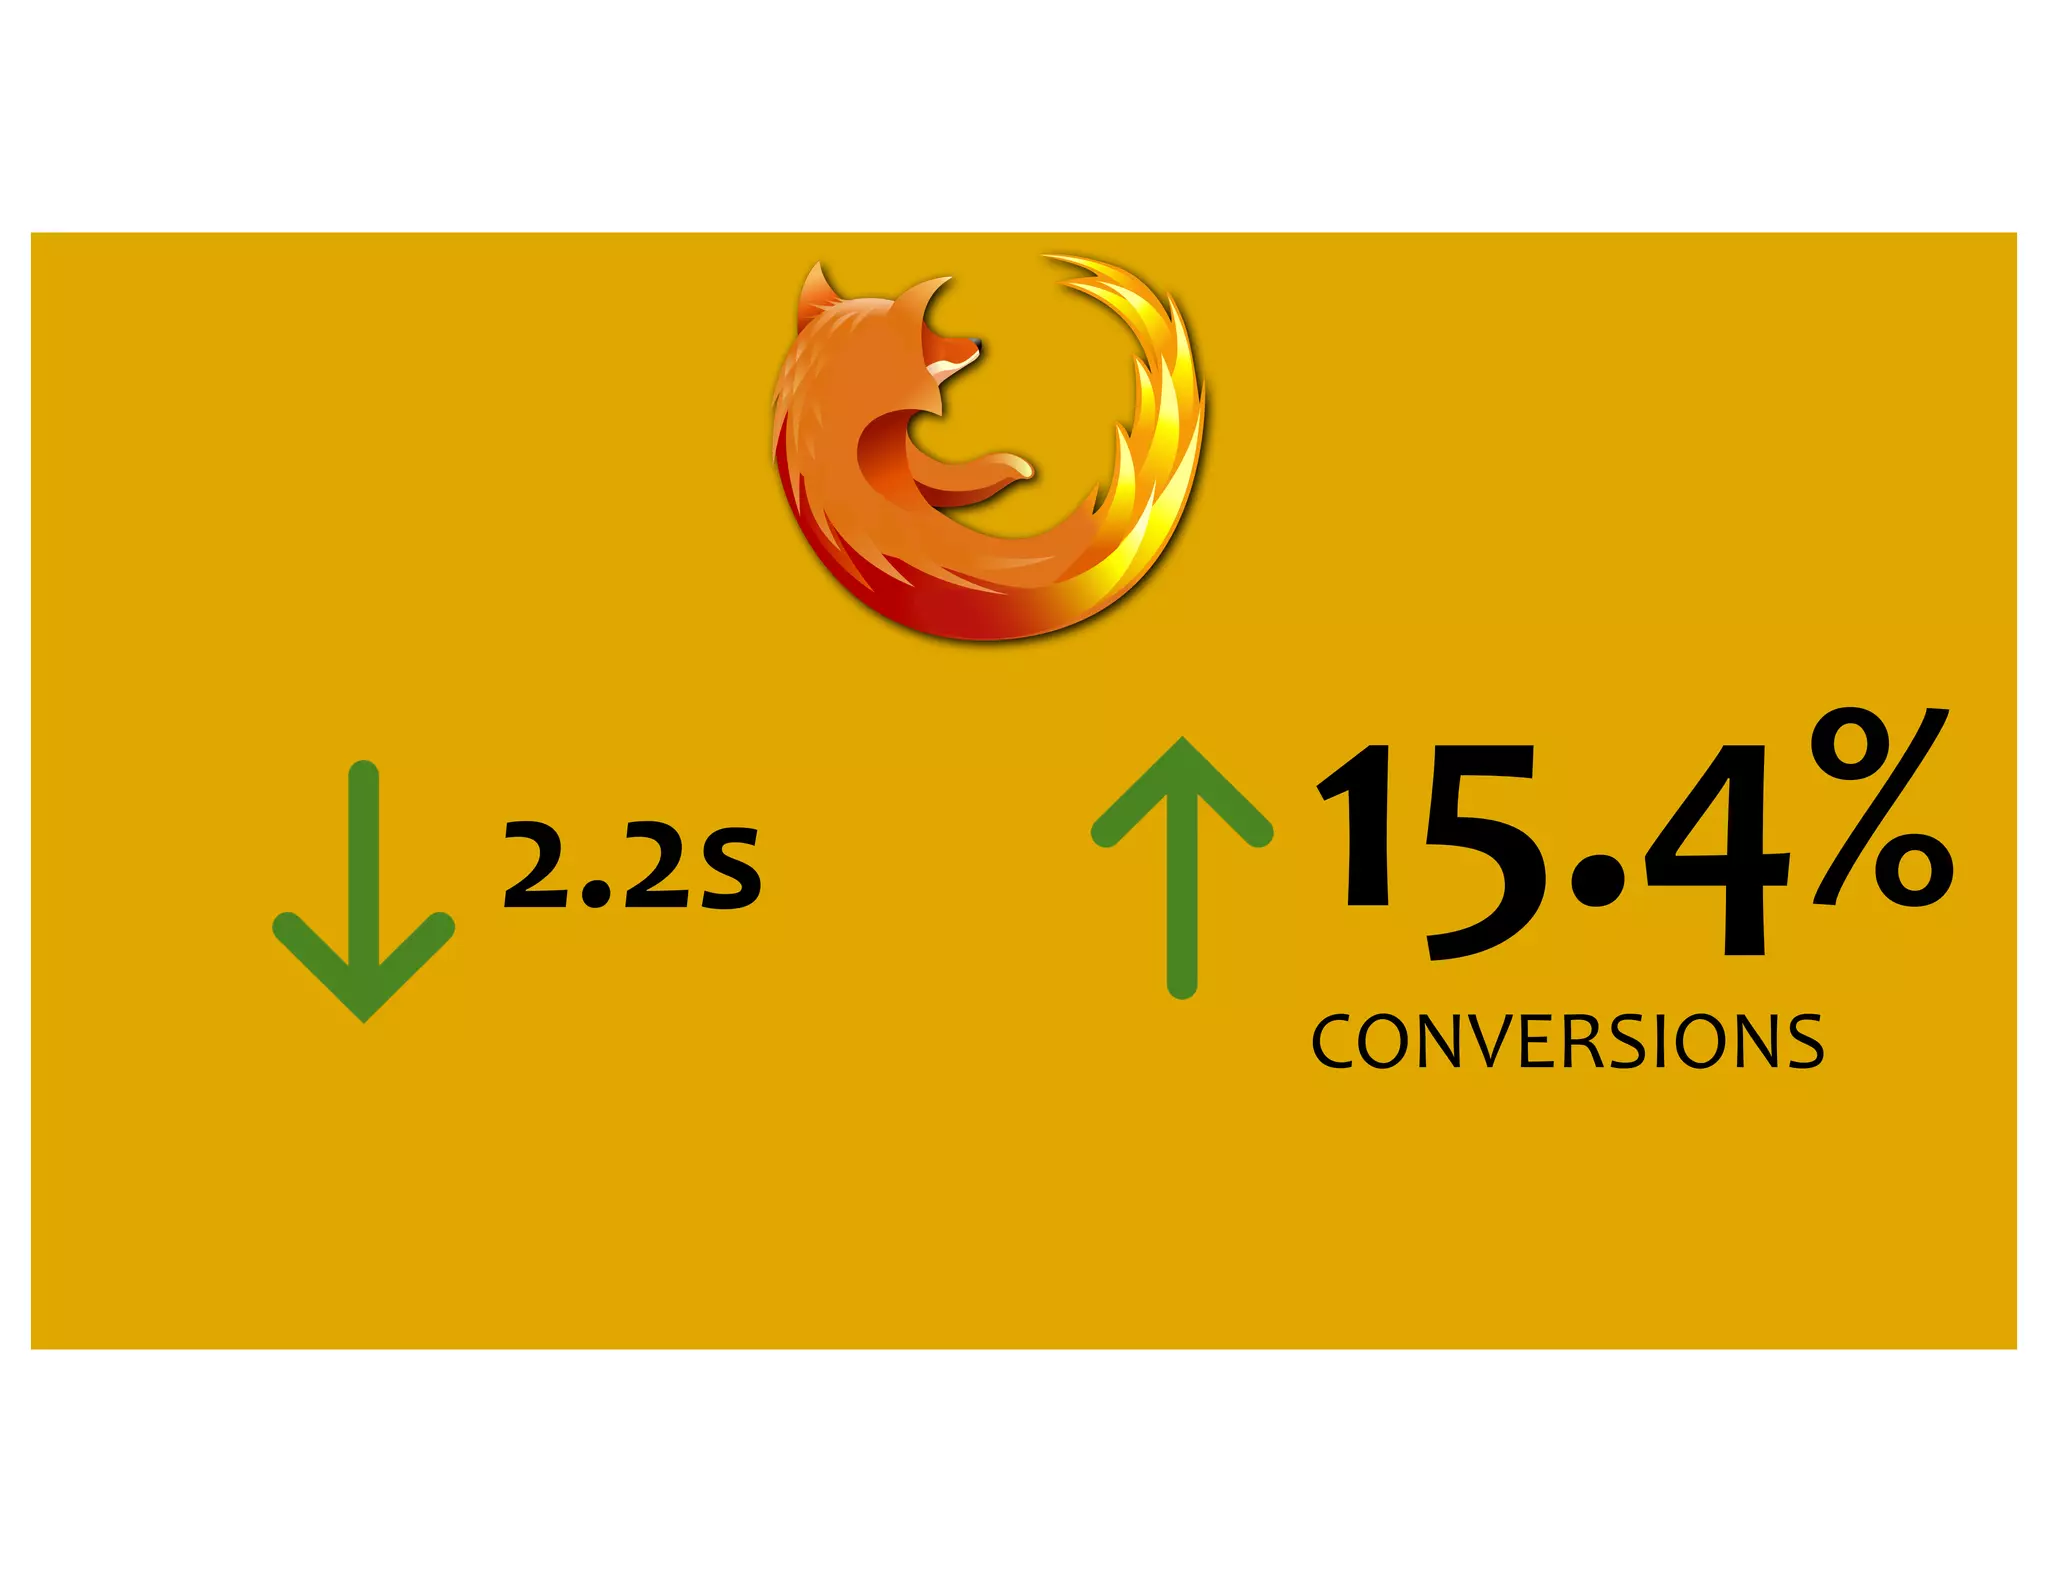
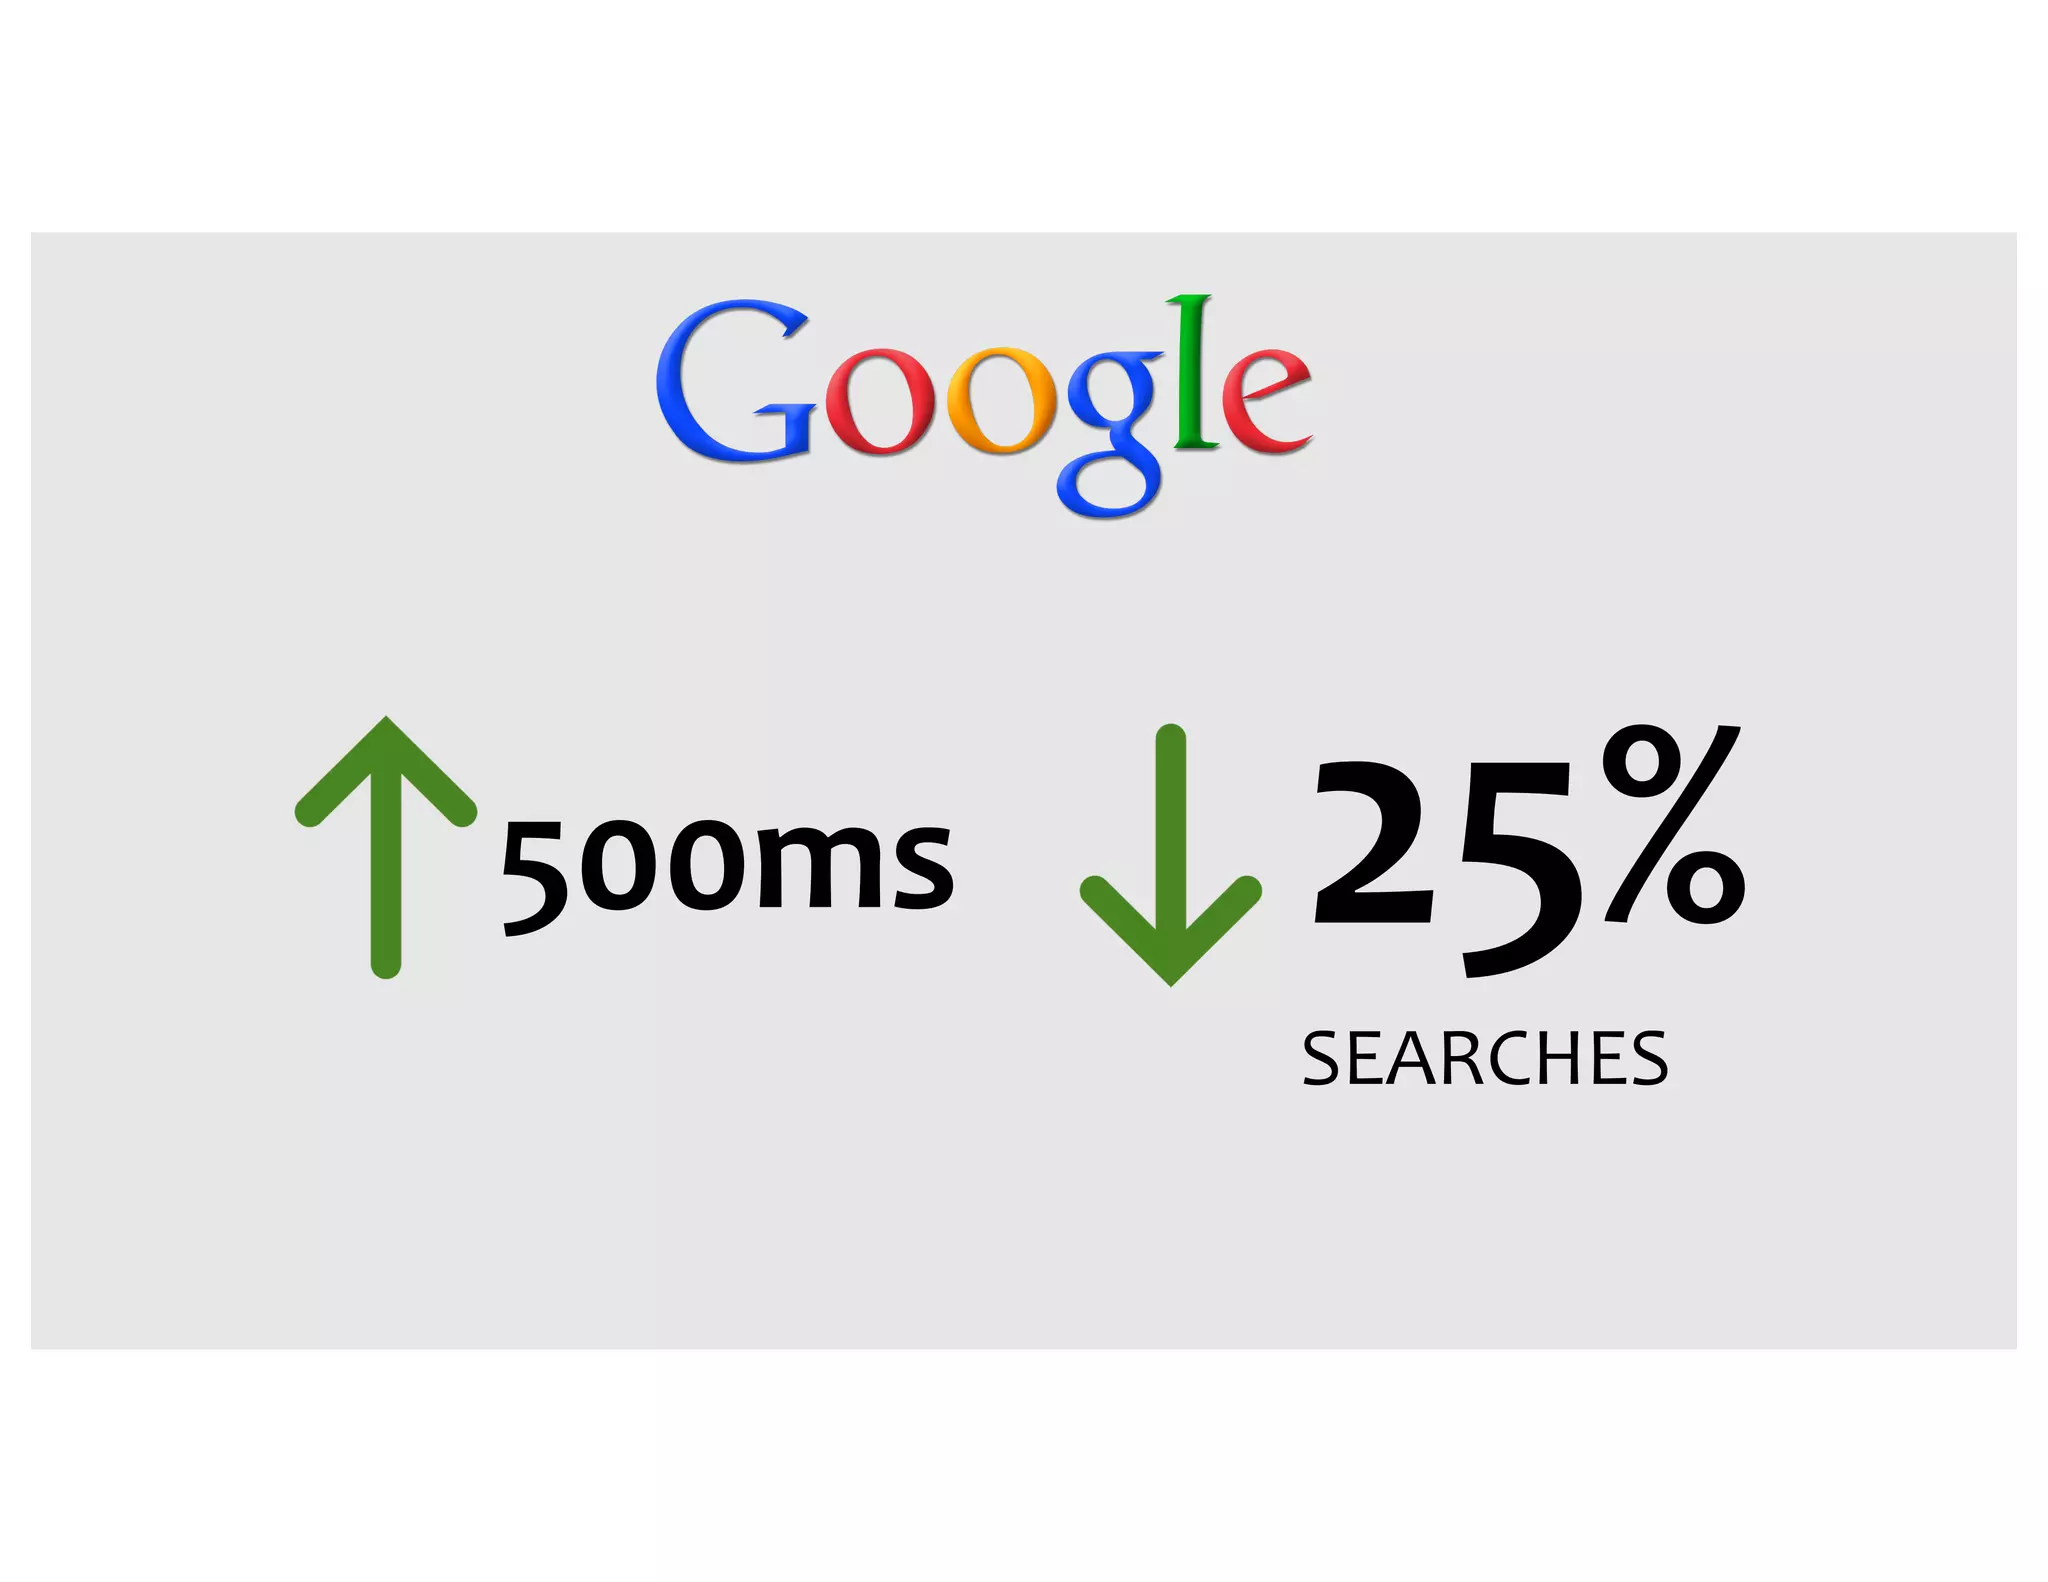
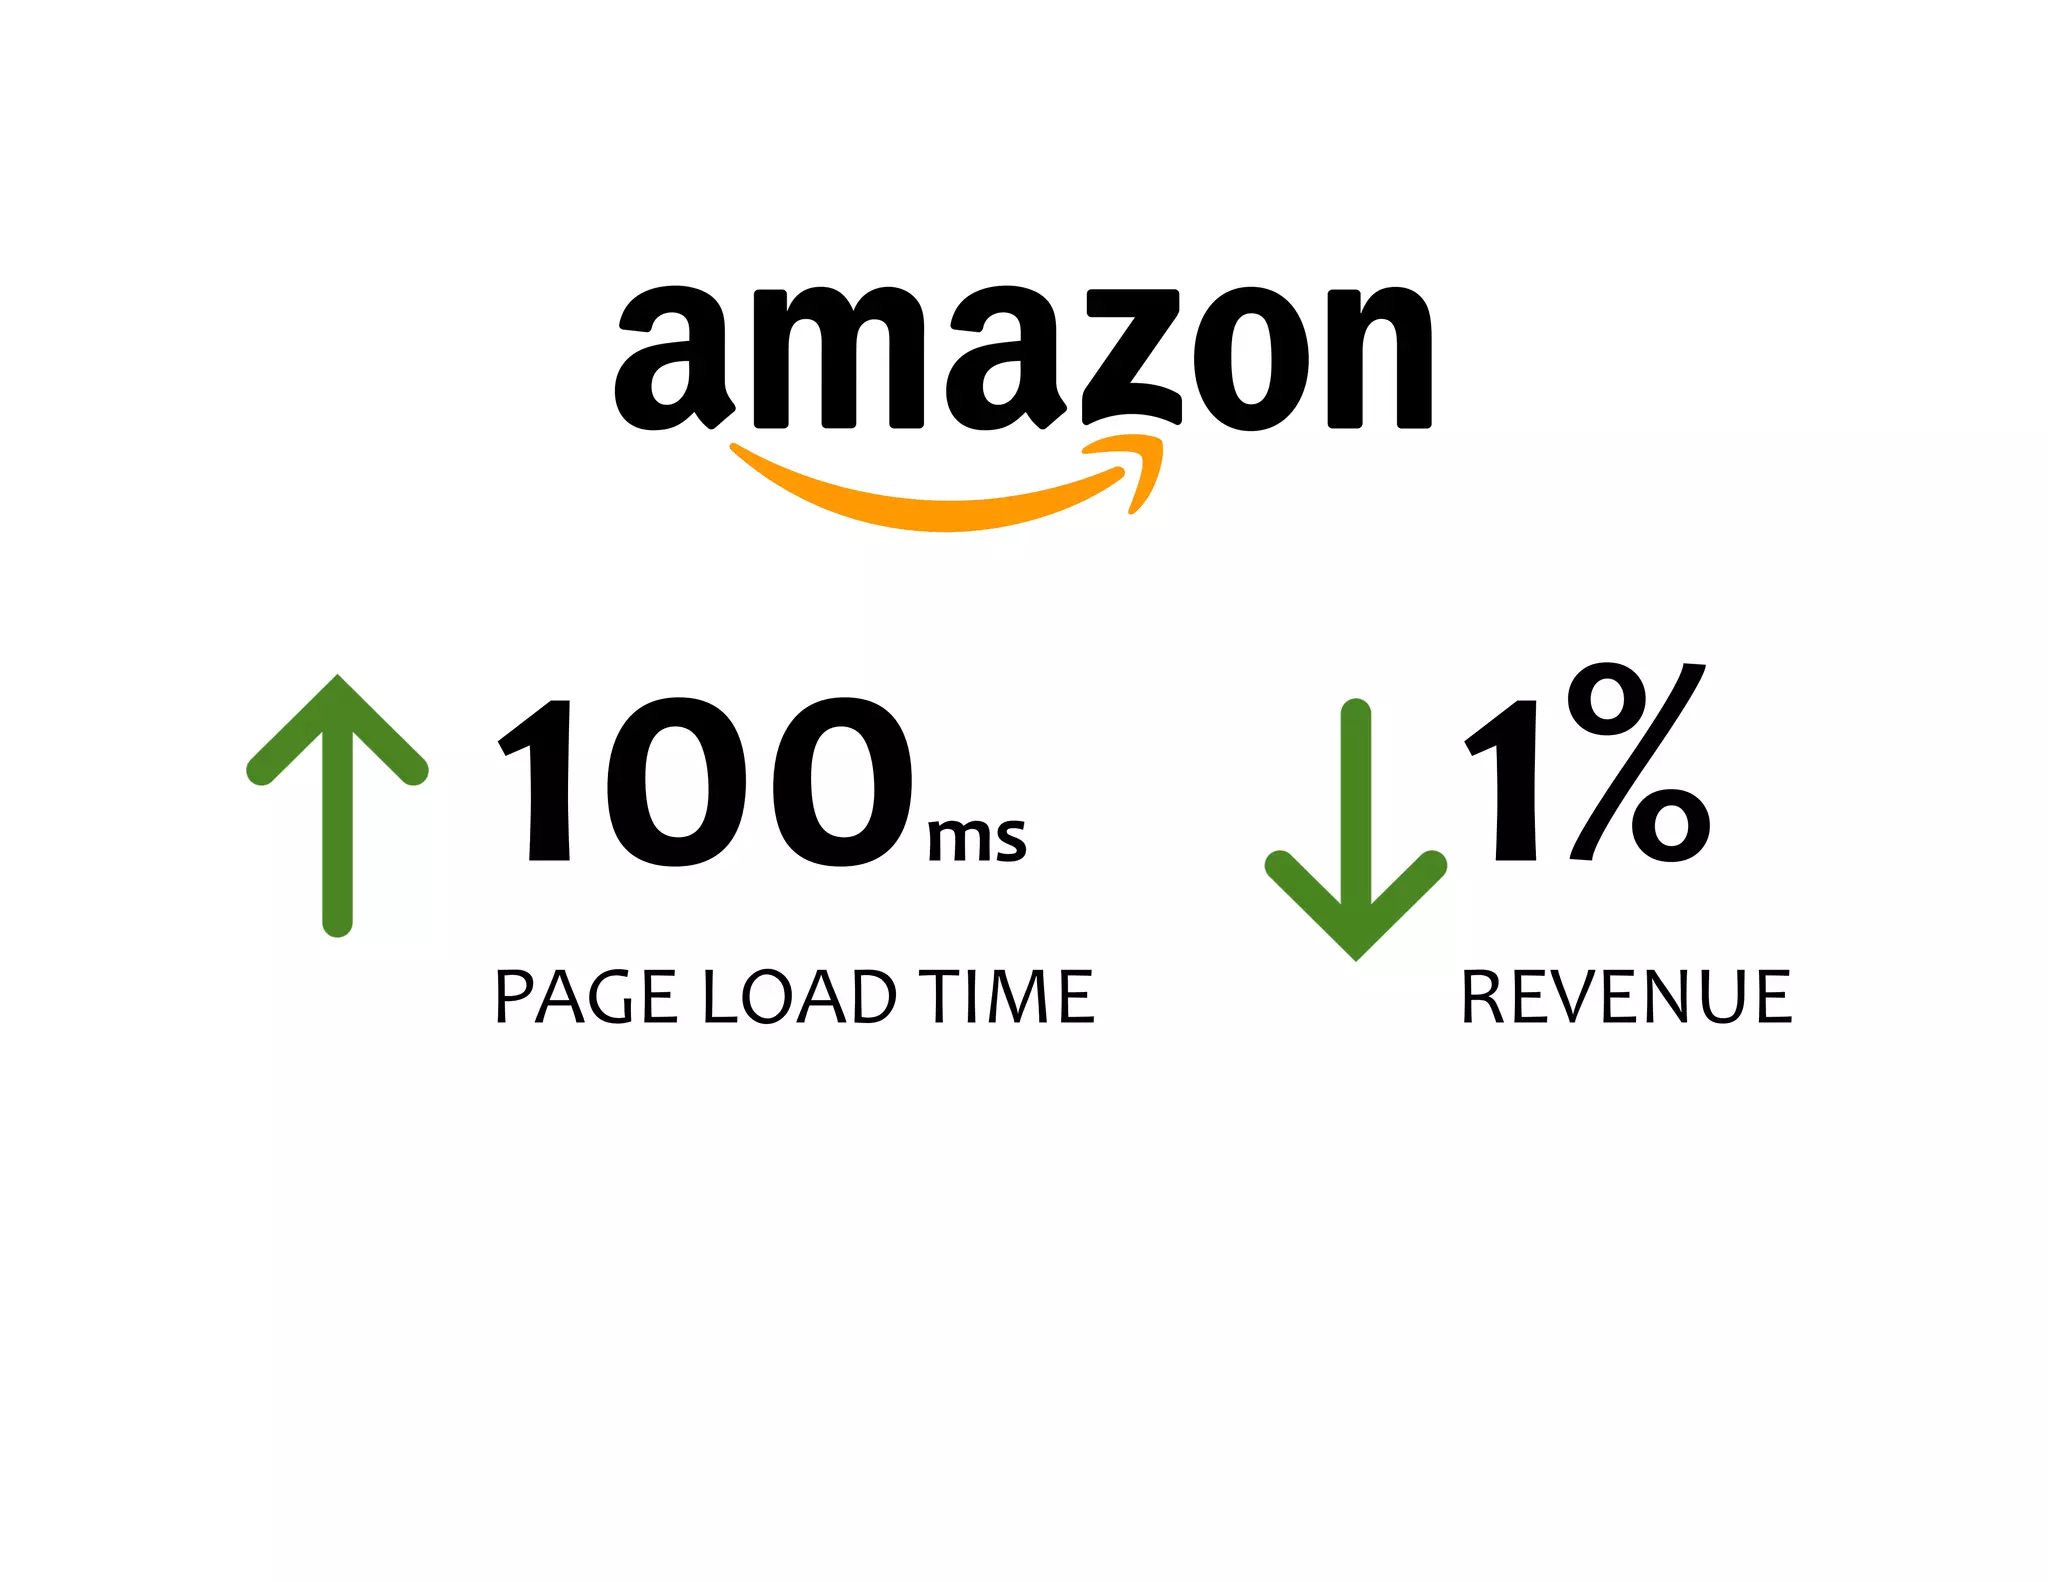
Performance Bytes Measuring what matters
HELLO! I AM .. SAGAR DESARDA • < 1 year at AWS, but living the dream • Fun Fact about me: I met Shaquille O'Neal in ‘19 & have a picture taken with him
The views in this presentation are mine alone and do not represent my employer
How much is a millisecond worth?
100ms 1% REVENUE
400ms 9% TRAFFIC
2.2s 15.4% CONVERSIONS
25% SEARCHES 500ms
1% REVENUE 100ms PAGE LOAD TIME
1 SECOND SLOWER
11% PAGE VIEWS
16% CUSTOMER SATISFACTION
7% CONVERIONS
Where are the end-users coming from?
Can one size fit all? • Lots of devices • Different screen sizes • Varying Internet or Data speeds • Many different browsers
Every thought about ..
Average time to load a mobile landing page 22 seconds
If a page takes more than 3 sec to load 53%abandon
How do I look for the problem then? Where do I begin?
DISCOVERY MEASURING WHAT MATTERS DEFINE THE SCOPE MEDIA ANALYSIS APPLING FIRST PRINCIPLES Map it to the organizational initiatives: Example: Improving Page Speed, SEO, Reducing page size, Improving conversions etc. Identifying the metrics that mean the most to your site Is it the entire web site? Or, just the homepage, or a product page, or a checkout? Optimize website images and videos for maximum web performance and user experience 1. Splitting the code 2. Slimming down libraries 3. Shared Bundles 4. Brotli/Zopfli Compression 5. Leverage HTTP2 Server Push, priorities, resource hints, dns- prefetch and preconnect. The 5-Point Plan
User-centric metrics
KEY METRICS • First Meaningful Paint • Largest Contextual Paint • First Interactive • Consistently Interactive • Cumulative Layout Shift • Visually Complete • Total Blocking Time • Custom Metric GOALS • Speed Index: 1,100-2,500 • First Meaningful Paint: 1-3s • First Interactive: 2-4s User-centric metrics
Content Breakdown per Page § Average bytes per page, per content type Source: HTTP Archives
Image Optimization Time to look beyond JPEGs and PNGs Format Savings WebP 25-40% JPEG 2000 (JPX) 20% JPEG XR (JXR) 25% HEIF (heef) 25% Zopfli PNG 20% Guetzli JPEG 20-30%
Images Stop using animated GIFs!Stop Use Animated PNGs or Animated WebP or muted videosUse Optimize and serve images based on end-user’s device and bandwidthOptimize Choose the right file type based on the browserChoose
Images The future looks interesting! § AVIF § BPG § FLIF
Automatic Image Transformation § Image management solution on the cloud which automatically optimizes the website images based on the end user’s device, network, browser, bandwidth etc. § Simplicity with image management § Lighter and faster web pages improving overall performance of the website § Quality images, with the goal being the keep the perceptual quality intact Source: Netflix
ALL of this applies to videos as well
Analyzing web fonts
1 2 3 4 6 5 Optimizing Delivery Of Web Fonts Prefetching As an example, prefetching Google Fonts to resolve the domain name faster. Include this in the HEAD section of your HTML: Prioritize based on browser support 86% of all modern browsers support WOFF format, provide WOFF and WOFF2 (better compression) and then fall back to web safe font. Choose what styles do you need Choose only the styles that you need, keep the style down to a minimum. Character sets Also ensure that the character sets are down to a minimum. Host files locally & frontend it by a CDN Many fonts are under an open source license. Open Sans is a good example of one you can host locally, say Amazon S3. Further, front it by a CDN, say Amazon CloudFront and cache it at the Edge to accelerate the downstream delivery. Caching the fonts Set up TTLs to cache the font files on the CDN and also on the browser
Consider preloading fonts
“ Shopify’s switch to preloading fonts saw a 50% (1.2 second) improvement in time- to-text-paint. This removed their flash- of-invisible text completely. “ O’REILLY FLUENT CONFERENCE ‘18 Provides a declarative fetch primitive that initiates an early fetch and separates fetching from resource execution.
75% of the font requests on the web are from Google Fonts. 29% pages include a Google fonts stylesheet link in the document <head> 1.7% of the mobile pages reconnect to the Web fonts hosts 0.4% of the pages include a Google fonts stylesheet link as the first child in the document <head> 75% 29% 1.7% 0.4% Fonts on the Web today
dns-prefetch Resolve DNS ahead of time Example: Third party content where you know the domain
Enabling DNS Prefetch (rel=dns-prefetch) No DNS Prefresh With DNS Prefresh enabled ** You can run this on Web Page Test.
dns-prefetch preconnect DNS look up + TCP handshake + TLS negotiation Example: Third party content where you know the domain
Enabling DNS Preconnect (rel=preconnect) No DNS Preconnect With DNS Preconnect enabled ** You can run this on Web Page Test.
dns-prefetch preconnect preload • Fetch a resource ahead of time • Example: Image or js that you will need for the current page
dns-prefetch preconnect Preload prefetch Informs the browsers that a given resource should be prefetched so it can be loaded more quickly
dns-prefetch preconnect Preload prefetch prerender Prerender a page in the background for future navigation Example: Marketing funnel where next navigation is predictable
‘Prerender’ Use-Case Source: www.netlify.com
dns-prefetch preconnect Preload prefetch prerender CURRENT PAGE NEXT NAVIGATION
Does my browser support it? Ref: https://caniuse.com/#search=dns-prefetch "Can I use" provides up-to-date browser support tables for support of front-end web technologies on desktop and mobile web browsers.
Another Example: Checking HTTP2 vs HTTP3 Browser Support
Compression Defaults • text/javascript • font/ttf • application/javascript • text/xml • application/json • application/xml Amazon CloudFront does a good job at covering the wide range of MIME type in the default settings to ensure that they are compressed. Source: HTTP Archives
Compression techniques developed by Google Brotli: Up to 25% gains over gzip compression Compression Calculator is here. LOTs of room to optimize the overall Internet. Only 11% of the total compressed content on the web is Brotli-encoded. § Process intensive § General preference is to have the CDN do offline processing to have the gzip-content Brotli encoded Many CDNs support Brotli compression 01 02 03 04 Brotli & Zopfli Compression
15% 20% 7.2% JavaScript size reduction CSS size reduction Faster Time-To-Interactive
It provides user experience metrics for how real-world Chrome users experience popular destinations on the web. Powered by real user measurement of key user experience metrics across the public web, gathered from millions of Chrome users. It is THAT data which is used by Google for SEO, Ad Rankings. Chrome User Experience Report (CRUX)
How do I look at CRUX reports? • Official Link: g.co/chromeuxdash [Use Chrome] • Use-Cases: • Look at the overall performance of your site • Month-over-month analysis of performance (Especially good to know if the code changes on the site have influence the performance in any way) • Since the data is publicly-available, do competitor analysis and know where you stand vs others. How do I look at CRUX reports?
Impact of 3rd Parties § Performance § Privacy Concerns § Security • British Airways breach of up to 380,000 payment cards • $6.5 Million Class-Action Suit Over Ticketmaster Data Breach Filed
Source: Catchpoint Google DoubleClick ‘2018 Outage Impact Customer Experience
Google DoubleClick ‘2018 Outage: Impact Customer Experience Source: Catchpoint
How do I protect myself against these 3rd party services? Configure 3rd party services to load after the page is interactive 01 Only implement 3rd parties when necessary. Set some expectations with Marketing! 03 Monitor the performance of the 3rd parties for performance degradation 05 Set scripts to load asynchronously 02 Ensure that the 3rd parties are always up-to-date on the latest version 04 Use a Tag Manager 06
If you can’t measure it, you can’t improve it!
SYNTHETIC TOOLS REAL USER MONITORING (RUM) Dynatrace, Catchpoint § Active Monitoring: Help you constantly monitor round the clock § Important for regression testing, production environment monitoring § A/B testing Dynatrace RUM, New Relic Browser § Helps you accurately view the performance that is experienced by the end users § Helps you map the performance metrics to the business metrics (say, conversions) How do I measure?
What I didn’t cover 1. HTTP3 2. Mobile-first approach and how that translates to in the web performance world 3. Understanding waterfall charts: https://nooshu.github.io/blog/2019/10/02/how-to-read- a-wpt-waterfall-chart/ 4. Web Vitals: A Google initiative to improve the user- experience on the web
Take Aways 1. Every millisecond that you can shave off the website matters 2. If you can’t measure it, you can’t improve it 3. Brotli/Zopfli Compression 4. HTTP2 must! (HTTP3 soon) 5. Optimize images based on the end-user, device, browser and bandwidth 6. WebPageTest - This seems the most highly regarded in the webperf circles I know about. You pick a location and a browser. Gives you 3 runs, shows waterfall, and a bunch of stats with letter grades for compression/TTFB, FCP, Document Complete and Fully Loaded times. 7. PageSpeed Insights - The original PageSpeed test from Google, aka Lighthouse run on the web - gives you FCP, FID, TTI, screenshots, opportunities, and Diagnostics 8. RequestMap from Webperf.Tools - Simon Hearnes' request map generator which focuses on visualizing Third Party Assets. Pick a location, and a device. 9. Caniuse.com: provides up-to-date browser support tables for support of front-end web technologies on desktop and mobile web browsers. 10. CRUX: performance data is based on real-world measurement, as experienced by Chrome users
Thank You

Improving frontend performance

  • 1.
  • 2.
    HELLO! I AM.. SAGAR DESARDA • < 1 year at AWS, but living the dream • Fun Fact about me: I met Shaquille O'Neal in ‘19 & have a picture taken with him
  • 3.
    The views inthis presentation are mine alone and do not represent my employer
  • 4.
    How much isa millisecond worth?
  • 5.
  • 6.
  • 7.
  • 8.
  • 9.
  • 10.
  • 11.
  • 12.
  • 13.
  • 14.
  • 15.
    Can one sizefit all? • Lots of devices • Different screen sizes • Varying Internet or Data speeds • Many different browsers
  • 16.
  • 17.
    Average time toload a mobile landing page 22 seconds
  • 18.
    If a pagetakes more than 3 sec to load 53%abandon
  • 19.
    How do Ilook for the problem then? Where do I begin?
  • 20.
    DISCOVERY MEASURING WHAT MATTERS DEFINE THESCOPE MEDIA ANALYSIS APPLING FIRST PRINCIPLES Map it to the organizational initiatives: Example: Improving Page Speed, SEO, Reducing page size, Improving conversions etc. Identifying the metrics that mean the most to your site Is it the entire web site? Or, just the homepage, or a product page, or a checkout? Optimize website images and videos for maximum web performance and user experience 1. Splitting the code 2. Slimming down libraries 3. Shared Bundles 4. Brotli/Zopfli Compression 5. Leverage HTTP2 Server Push, priorities, resource hints, dns- prefetch and preconnect. The 5-Point Plan
  • 21.
  • 22.
    KEY METRICS • FirstMeaningful Paint • Largest Contextual Paint • First Interactive • Consistently Interactive • Cumulative Layout Shift • Visually Complete • Total Blocking Time • Custom Metric GOALS • Speed Index: 1,100-2,500 • First Meaningful Paint: 1-3s • First Interactive: 2-4s User-centric metrics
  • 23.
    Content Breakdown per Page §Average bytes per page, per content type Source: HTTP Archives
  • 24.
    Image Optimization Time to lookbeyond JPEGs and PNGs Format Savings WebP 25-40% JPEG 2000 (JPX) 20% JPEG XR (JXR) 25% HEIF (heef) 25% Zopfli PNG 20% Guetzli JPEG 20-30%
  • 25.
    Images Stop using animatedGIFs!Stop Use Animated PNGs or Animated WebP or muted videosUse Optimize and serve images based on end-user’s device and bandwidthOptimize Choose the right file type based on the browserChoose
  • 26.
    Images The future looksinteresting! § AVIF § BPG § FLIF
  • 27.
    Automatic Image Transformation § Imagemanagement solution on the cloud which automatically optimizes the website images based on the end user’s device, network, browser, bandwidth etc. § Simplicity with image management § Lighter and faster web pages improving overall performance of the website § Quality images, with the goal being the keep the perceptual quality intact Source: Netflix
  • 28.
    ALL of thisapplies to videos as well
  • 29.
  • 30.
    1 2 3 4 6 5 Optimizing Delivery OfWeb Fonts Prefetching As an example, prefetching Google Fonts to resolve the domain name faster. Include this in the HEAD section of your HTML: Prioritize based on browser support 86% of all modern browsers support WOFF format, provide WOFF and WOFF2 (better compression) and then fall back to web safe font. Choose what styles do you need Choose only the styles that you need, keep the style down to a minimum. Character sets Also ensure that the character sets are down to a minimum. Host files locally & frontend it by a CDN Many fonts are under an open source license. Open Sans is a good example of one you can host locally, say Amazon S3. Further, front it by a CDN, say Amazon CloudFront and cache it at the Edge to accelerate the downstream delivery. Caching the fonts Set up TTLs to cache the font files on the CDN and also on the browser
  • 31.
  • 32.
    “ Shopify’s switch topreloading fonts saw a 50% (1.2 second) improvement in time- to-text-paint. This removed their flash- of-invisible text completely. “ O’REILLY FLUENT CONFERENCE ‘18 Provides a declarative fetch primitive that initiates an early fetch and separates fetching from resource execution.
  • 33.
    75% of thefont requests on the web are from Google Fonts. 29% pages include a Google fonts stylesheet link in the document <head> 1.7% of the mobile pages reconnect to the Web fonts hosts 0.4% of the pages include a Google fonts stylesheet link as the first child in the document <head> 75% 29% 1.7% 0.4% Fonts on the Web today
  • 34.
    dns-prefetch Resolve DNSahead of time Example: Third party content where you know the domain
  • 35.
    Enabling DNS Prefetch(rel=dns-prefetch) No DNS Prefresh With DNS Prefresh enabled ** You can run this on Web Page Test.
  • 36.
    dns-prefetch preconnect DNS lookup + TCP handshake + TLS negotiation Example: Third party content where you know the domain
  • 37.
    Enabling DNS Preconnect(rel=preconnect) No DNS Preconnect With DNS Preconnect enabled ** You can run this on Web Page Test.
  • 38.
    dns-prefetch preconnect preload • Fetch aresource ahead of time • Example: Image or js that you will need for the current page
  • 39.
    dns-prefetch preconnect Preload prefetch Informs thebrowsers that a given resource should be prefetched so it can be loaded more quickly
  • 40.
    dns-prefetch preconnect Preload prefetch prerender Prerender a pagein the background for future navigation Example: Marketing funnel where next navigation is predictable
  • 41.
  • 42.
  • 43.
    Does my browsersupport it? Ref: https://caniuse.com/#search=dns-prefetch "Can I use" provides up-to-date browser support tables for support of front-end web technologies on desktop and mobile web browsers.
  • 44.
    Another Example: Checking HTTP2vs HTTP3 Browser Support
  • 45.
    Compression Defaults • text/javascript •font/ttf • application/javascript • text/xml • application/json • application/xml Amazon CloudFront does a good job at covering the wide range of MIME type in the default settings to ensure that they are compressed. Source: HTTP Archives
  • 46.
    Compression techniques developedby Google Brotli: Up to 25% gains over gzip compression Compression Calculator is here. LOTs of room to optimize the overall Internet. Only 11% of the total compressed content on the web is Brotli-encoded. § Process intensive § General preference is to have the CDN do offline processing to have the gzip-content Brotli encoded Many CDNs support Brotli compression 01 02 03 04 Brotli & Zopfli Compression
  • 47.
    15% 20% 7.2% JavaScript size reduction CSSsize reduction Faster Time-To-Interactive
  • 48.
    It provides userexperience metrics for how real-world Chrome users experience popular destinations on the web. Powered by real user measurement of key user experience metrics across the public web, gathered from millions of Chrome users. It is THAT data which is used by Google for SEO, Ad Rankings. Chrome User Experience Report (CRUX)
  • 49.
    How do Ilook at CRUX reports? • Official Link: g.co/chromeuxdash [Use Chrome] • Use-Cases: • Look at the overall performance of your site • Month-over-month analysis of performance (Especially good to know if the code changes on the site have influence the performance in any way) • Since the data is publicly-available, do competitor analysis and know where you stand vs others. How do I look at CRUX reports?
  • 50.
    Impact of 3rdParties § Performance § Privacy Concerns § Security • British Airways breach of up to 380,000 payment cards • $6.5 Million Class-Action Suit Over Ticketmaster Data Breach Filed
  • 51.
    Source: Catchpoint Google DoubleClick‘2018 Outage Impact Customer Experience
  • 52.
    Google DoubleClick ‘2018 Outage: ImpactCustomer Experience Source: Catchpoint
  • 53.
    How do Iprotect myself against these 3rd party services? Configure 3rd party services to load after the page is interactive 01 Only implement 3rd parties when necessary. Set some expectations with Marketing! 03 Monitor the performance of the 3rd parties for performance degradation 05 Set scripts to load asynchronously 02 Ensure that the 3rd parties are always up-to-date on the latest version 04 Use a Tag Manager 06
  • 54.
    If you can’tmeasure it, you can’t improve it!
  • 55.
    SYNTHETIC TOOLS REALUSER MONITORING (RUM) Dynatrace, Catchpoint § Active Monitoring: Help you constantly monitor round the clock § Important for regression testing, production environment monitoring § A/B testing Dynatrace RUM, New Relic Browser § Helps you accurately view the performance that is experienced by the end users § Helps you map the performance metrics to the business metrics (say, conversions) How do I measure?
  • 56.
    What I didn’t cover 1.HTTP3 2. Mobile-first approach and how that translates to in the web performance world 3. Understanding waterfall charts: https://nooshu.github.io/blog/2019/10/02/how-to-read- a-wpt-waterfall-chart/ 4. Web Vitals: A Google initiative to improve the user- experience on the web
  • 57.
    Take Aways 1. Everymillisecond that you can shave off the website matters 2. If you can’t measure it, you can’t improve it 3. Brotli/Zopfli Compression 4. HTTP2 must! (HTTP3 soon) 5. Optimize images based on the end-user, device, browser and bandwidth 6. WebPageTest - This seems the most highly regarded in the webperf circles I know about. You pick a location and a browser. Gives you 3 runs, shows waterfall, and a bunch of stats with letter grades for compression/TTFB, FCP, Document Complete and Fully Loaded times. 7. PageSpeed Insights - The original PageSpeed test from Google, aka Lighthouse run on the web - gives you FCP, FID, TTI, screenshots, opportunities, and Diagnostics 8. RequestMap from Webperf.Tools - Simon Hearnes' request map generator which focuses on visualizing Third Party Assets. Pick a location, and a device. 9. Caniuse.com: provides up-to-date browser support tables for support of front-end web technologies on desktop and mobile web browsers. 10. CRUX: performance data is based on real-world measurement, as experienced by Chrome users
  • 58.