The document presents a hybrid algorithm for image compression that enhances data transmission and storage efficacy while maintaining high image quality. It discusses various image processing techniques, including lossless and lossy compression methods, redundancies reduction, and segmentation algorithms, emphasizing their application in performance improvement. The proposed hybrid image compression algorithm (HICA) showcases effective results in minimizing file sizes through advanced processing techniques and aims to improve image analysis in various fields.
![Hybrid Algorithm for Enhancing and Increasing Image Compression Based on Image Processing Techniques Khalil Ibrahim Mohammad Abuzanouneh IT Department, College of Computer, Al Qassim University, Al Qassim, Saudi Arabia, ka.abuzanouneh@qu.edu.sa Abstract—The data compression and decompression play a very important role and are necessary to minimize the storage media and increase the data transmission in the communication channel, the images quality based on the evaluating and analyzing different image compression techniques applying hybrid algorithm is the important new approach. The paper uses the hybrid technique applied to images sets for enhancing and increasing image compression, and also including different advantages such as minimizing the graphics file size with keeping the image quality in high level. In this concept, the hybrid image compression algorithm (HCIA) is used as one integrated compression system, HCIA has a new technique and proven itself on the different types of file images. The compression effectiveness is affected by the quality of image sensitive, and the image compression process involves the identification and removal of redundant pixels and unnecessary elements of the source image. The proposed algorithm is a new approach to compute and present the high image quality to get maximization compression [1]. In This research can be generated more space consumption and computation for compression rate without degrading the quality of the image, the results of the experiment show that the improvement and accuracy can be achieved by using hybrid compression algorithm. A hybrid algorithm has been implemented to compress and decompress the given images using hybrid techniques in java package software. Index Terms—Lossless Based Image Compression, Redundancy, Compression Technique, Compression Ratio, Compression Time. Keywords Data Compression, Hybrid Image Compression Algorithm, Image Processing Techniques. I. INTRODUCTION Data compression processes are one of the important topics in the nowadays, and the image processing has become a ground of it research today. There are different types of data must be stored in data warehouses, archives, and they must be transmitted through communication channels, and therefore several of data compression algorithms were designed for image processing[2]. The main compression techniques are a lossy and lossless compression. The lossless compression is applied when the file information has to be uncompressed as the same it was before compression. The files can be stored using the lossless compression technique, losing any data or character could be made the data misleading the in the worst case. So there are limits to the amount of space saving that can be gotten with lossless compression. In general, the ratios of Lossless compression the range from 20% to 60%, while the lossy compression process on the image file doesn't have to be stored completely [3]. Based on the lossless method a lot of bits can be thrown away from some images, such as audio data and video when the uncompressed process is done, and the total of data can be acceptable quality. Compression image is an encoding rules process for decreasing the number in the original image to store or transmit it, the image compression can be identified removed unnecessary pixels of the source image, by reducing the memory size that needed for keeping the image high quality. The lossy compression can be more meaningful when the compressed images have high quality and in the general can be satisfactory in the most cases [4]. The goal of the image compression process is to get the minimum number of bits for storing process and transmission. In the final experiments, the data encoding could possibly reach a 30-80% reduction in the size of data. II. IMAGE PROCESSING AND COMPRESSION Image processing is the image operation into a collection of pixels connected together, and it also the most significant task in the image compression to get better image analysis, the original image can be formed into different sizes and pieces, so the most important task in the image compression is to explore and apply the appropriate algorithms and parameters selection [5]. Any Image is characterized by a set of pixels, and in the images, there are a lot of common parts existing with the neighboring pixels and correlated together include a lot of redundant pixels. The two supporting components of compression are irrelevancy reduction and redundancy reduction. 1. Redundancy Reduction: The property in an image due to redundant bits is called redundancy. It means the data duplication in the images. Data elimination is called redundant data reduction, it helps to get a minimal storages spaces and results in the image compression. The image compression can apply a set of methods for reducing the total number of bits required for representing an image achieved by eliminating the difference of redundancy pixels existing in the pixels of an image[6]. There are three International Journal of Computer Science and Information Security (IJCSIS), Vol. 16, No. 3, March 2018 90 https://sites.google.com/site/ijcsis/ ISSN 1947-5500](https://image.slidesharecdn.com/12paper28021830ijcsiscamerareadypp-180403170327/75/Hybrid-Algorithm-for-Enhancing-and-Increasing-Image-Compression-Based-on-Image-Processing-Techniques-1-2048.jpg)
![basic types of redundancies in the digital image as the following: a. Psycho Visual Redundancy is a type of redundancy that correlates with different sensitivities to whole image signals using human eyes. So the eliminating process for some pixels in the image processing is acceptable. Therefore, the deleting of some bits which less relative important colors of the human vision can be acceptable b. Inter-pixel Redundancy is a redundancy corresponding to statistical dependencies among pixels, especially between neighboring pixels, the information related to individual pixels is comparatively small, the neighboring pixels of image are not independent, due to the correlation between the images neighboring pixels, the dependencies between values of pixels in the image is called inter-pixel redundancy or spatial redundancy [7]. c. Coding- Redundancy: The uncompressed image generally is coded each pixel in a fixed length, and is implemented using lookup tables to be reversible in the compression process. The uncompressed image is coded with each pixel, Hoffman code technique is the main algorithm to found coding redundancies. 2. Irrelevancy Reduction– In the image compression can be applied Irrelevancy technique with the actual information that is removed to reduce the required bits for compression image process, the elimination of irrelevant bits will be lost the information that cannot be recovered. In order to justify this, the removal of information which is least perceivable by the human visual system is performed. Irrelevance reduction bits are used in lossy compression. The success compression of recognition original image is related to the edges marked quality.In this research will be investigated and evaluated edge detection techniques and active contour model to enhance and detect the image color at different levels. there are several algorithms are applied such as Prewitt, segmentation algorithm, and Canny edge detection based on comparison criteria with artificially generated images, the edge quality, and map quality are very important parameters in this stage [8]. The experiments results are explained that apply to these criteria could be utilized for further analysis and find the best edge detector in the compression image. There are different types of image compression based on segmentation algorithm are: 1. The regions segmentation compression (RSC) can be used to cover the image coordinates. 2. The linear structures segmentations compression (LSSC) that including line segments and curve segments used active contour model. 3. The two-dimensional shapes segmentations compression (2DSSC), such as ellipses, circles, and strips (regions, long, symmetric), the cluster pixels inside salient image boundaries, the regions corresponding to objects surfaces, or objects natural parts. The image segmentation compression (ISC) can be used in different felids such as the image recognition that is using for face recognition, the medical image such as diagnosis operations, locating diseases and other dangers pathologies. For the video, image systems can be applied ISC in the traffic control system that is focusing to identify the shapes, sizes, and moving scene objects. The video image compression is divided into two approaches of segmentation: the region based compression, and boundary based compression, in the first segmentation, the purpose is to determine when a pixel belongs to an object or not [96], in the second segmentation the goal is to locate the boundary curves between the background and the objects. The region segmentation algorithms can be applied as the following: a) The thresholding method technique of region-based segmentation can be used to segment the original image for the objects separating from the background using a colors features values to compare with a threshold values in order to extract the color pixels class, a method starts from the first one pixel of a potential region and expands by adding adjacent pixels for an image that contains different types regions, the image should be segmented based on the image different areas which each area has a features values range, the thresholds are important to select a colors features values of the image regions to be very useful and effective in the images segmentation quality and compression process [10] , after this stage, the statistical test can be used to take a set of decisions related to which the pixels can be deleted into a region segmentation or not for increasing the image compression ratio. b) Clustering-based colors segmentation technique Any image can be divided into different classes or the same type of classes, the redundancy pixels of the image colors should be collected together in the similar classes for building the compression algorithm, and the different colors that contain a different type of pixels will be in different classes. c) Edge-based colors segmentation technique is the main features technique of the colors image, which includes valuable pixels in the image analysis and diagnosis classification to explore the boundaries detection between the various region's colors by using the selected features of the pixels values as textures, and intensities of the image colors. III. LOSSLESS METHOD OF IMAGE COMPRESSION Lossless methods are usually having two stages of algorithms operations. The first stage is transforming the source image into another format for reducing the redundancy colors. In the second stage can be used an entropy encoder for removing the coding redundancy. The lossless decompressors are strong inverse processes of the lossless compressors [11]. In the medical images can be used lossless compressors methods to get more than 50 % of original image size. While can be applied entropy methods in the lossless compression with several an application to compute MSE (mean square error ) and PSNR (peak signal to noise ratio ) between images and digitized radiographs, X-rays, and gamma rays to found a bit rate from 4 to 5 bpp (bytes/pixel). In the Lossless compression can be applied various methods such as linear transformation, multiresolution methods, and investigated prediction in the decorrelation medical images before the coding stage, and getting best results. The compression results were 3:1 for angiograms images, a less than 2:1 for MRI images. International Journal of Computer Science and Information Security (IJCSIS), Vol. 16, No. 3, March 2018 91 https://sites.google.com/site/ijcsis/ ISSN 1947-5500](https://image.slidesharecdn.com/12paper28021830ijcsiscamerareadypp-180403170327/75/Hybrid-Algorithm-for-Enhancing-and-Increasing-Image-Compression-Based-on-Image-Processing-Techniques-2-2048.jpg)
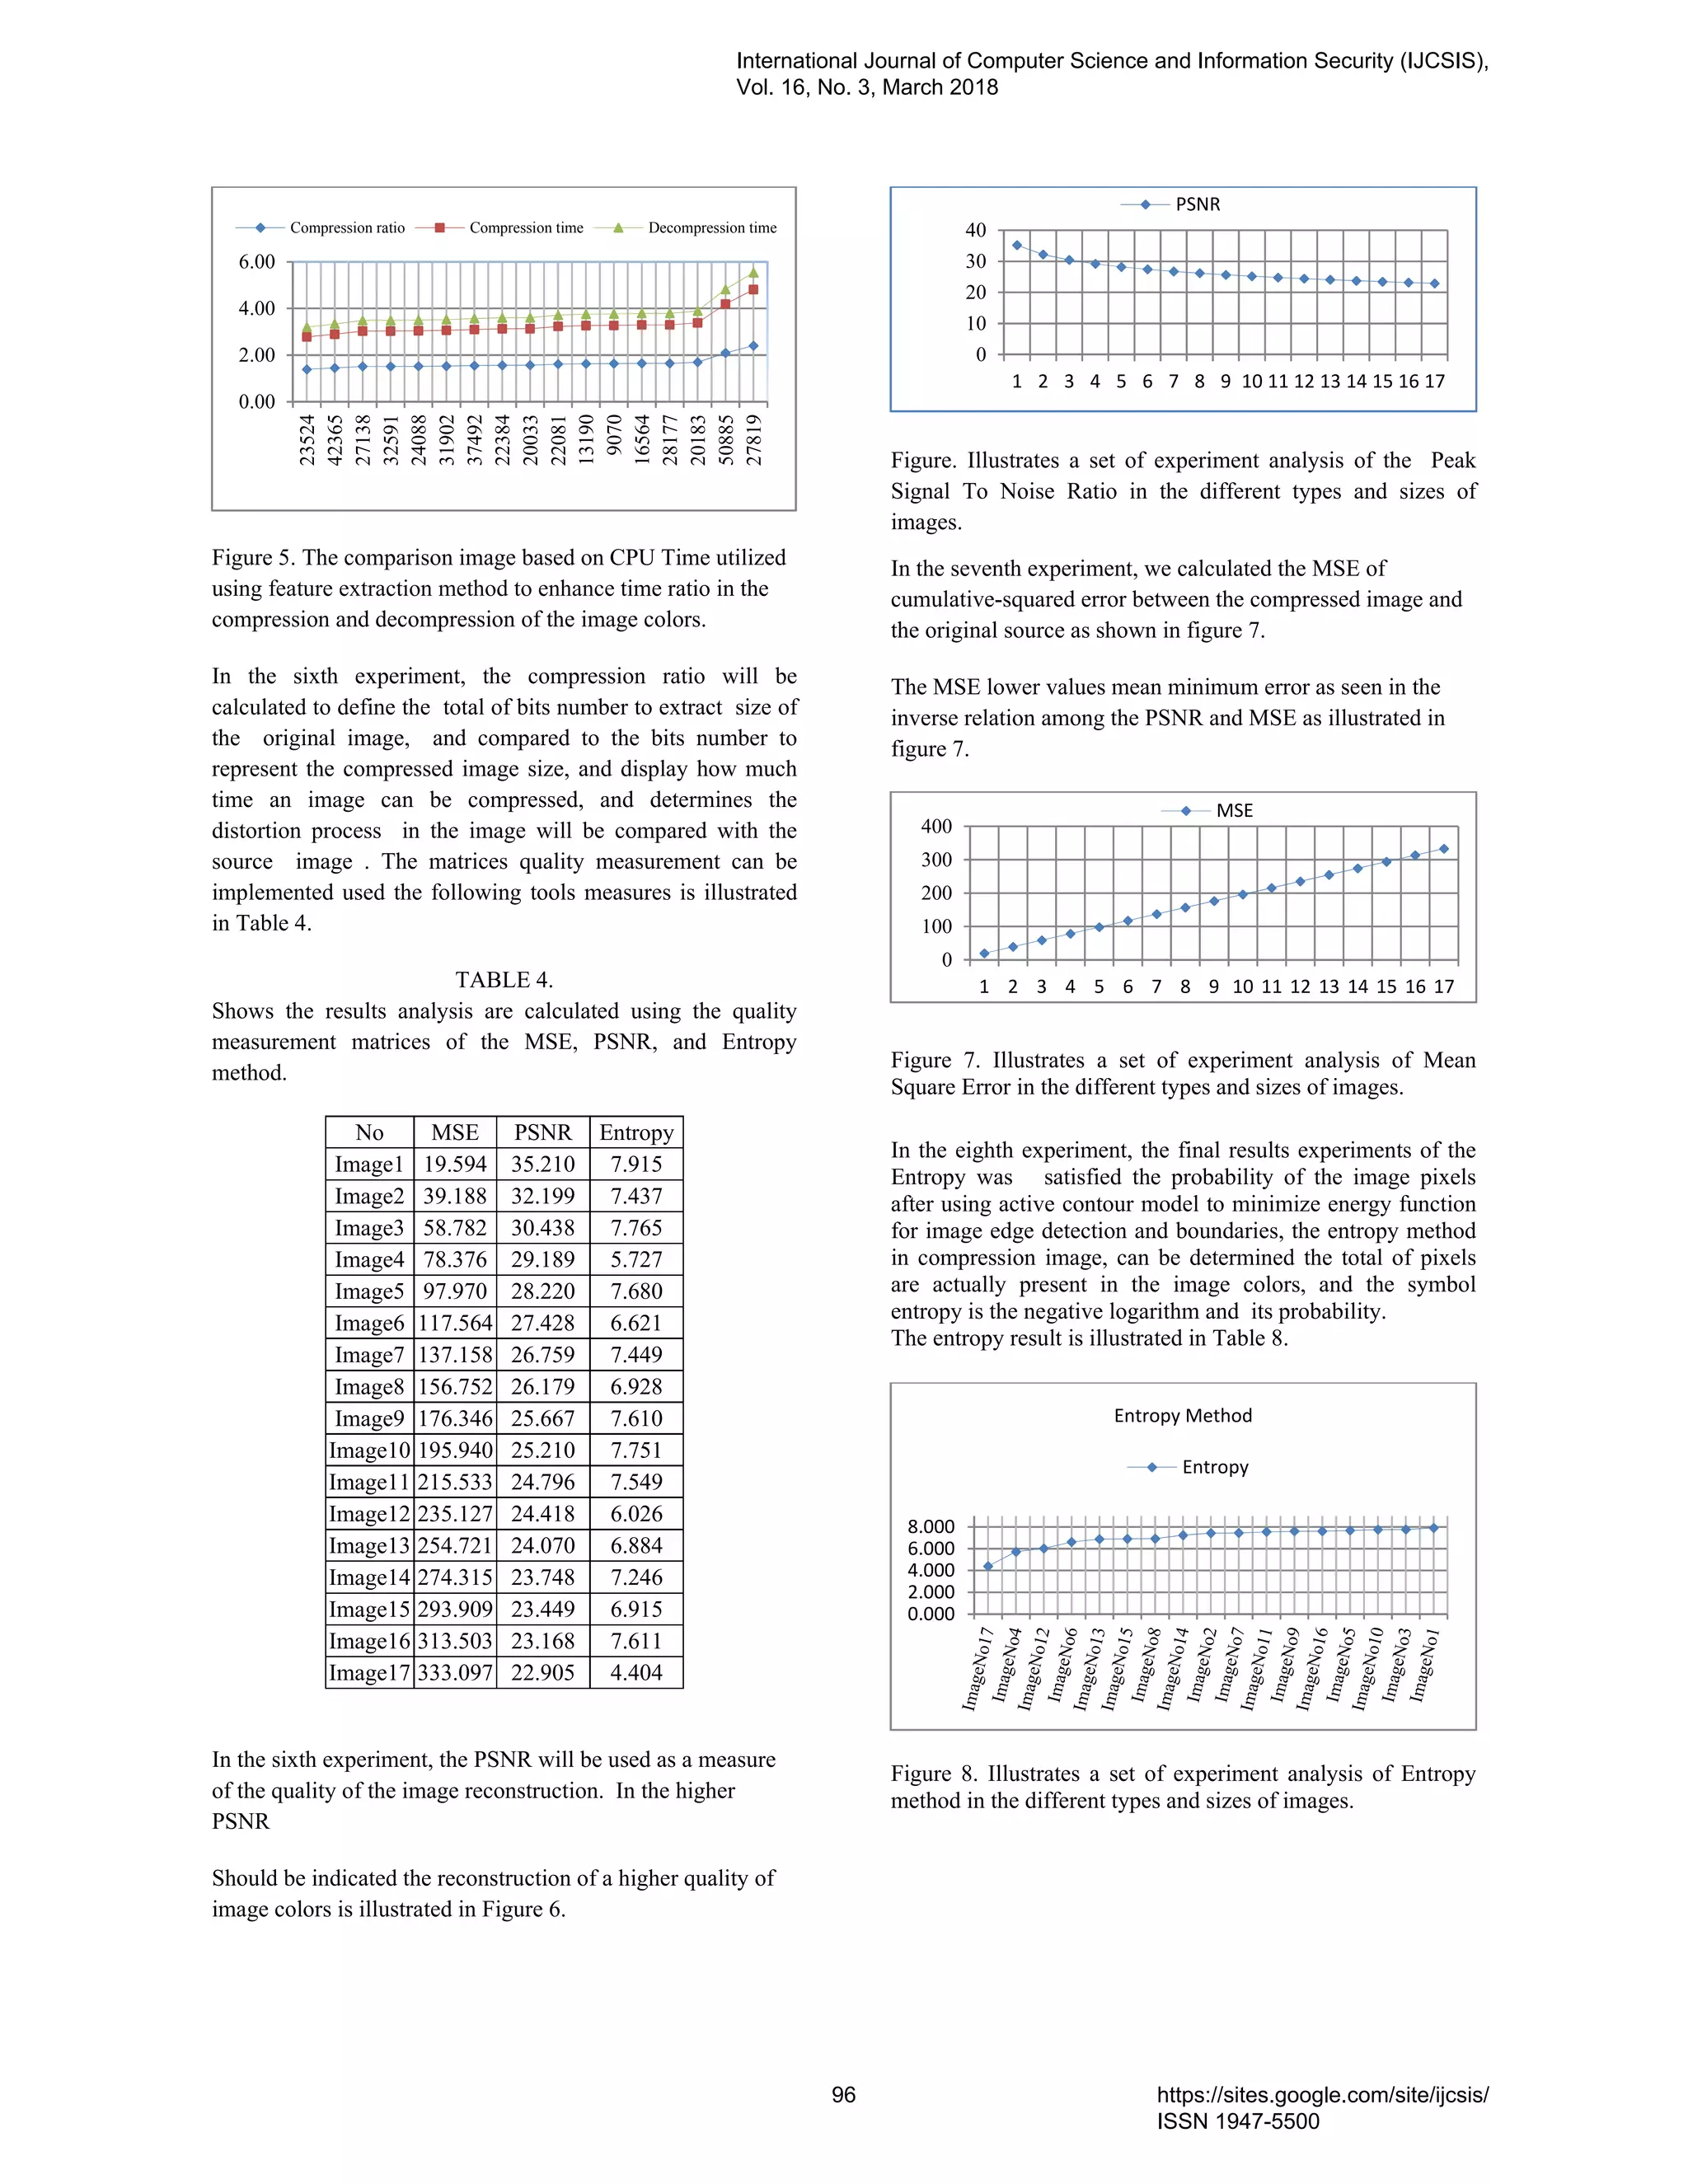
![The interpolation techniques and found-linear prediction interpolation techniques can be given good results in the compression ratios [12]. IV. IMAGE SEGMENTATION USING HICA ALGORITHM The parameters selection and different types of algorithms will be applied to enhance the images segmentation and improve outputs file. The pixel scale and level of segmentation implement based on HICA algorithm to complete region labeling tasks of the image segmentation processes, the HICA algorithm should be used the image adaptive segmentation included the following steps [11]: 1. Compute the image statistics tables give us the probability for a given degree of a confidence level and identically distributed normally colors to select suitable threshold. 2. The segmentation process will generate initial values for image pixels. 3. Compute the segmentation of image pixels based on quality measures to satisfy conditions of the segmentation function. 4. The image segment should be used new parameters to calculate and keep the image segmentation quality. 5. The analyzing and modifying process based on the knowledge structures of the new image will be implemented by calculating MSE and PSNR for each image. V. IMAGE COMPRESSION AND CHROMATIC FEATURES In the research paper will apply HICA algorithm using chromatic features to determine and describe RGB colors distribution and the grey-level of an image, which are the most discriminative features of the image compression. the image pixels are represented a segmented object, The selection parameters are used to detect the edge of image boundaries that have the same colors of pixels from the current image that will be used extracted chromatics features. The convergence process can be completed and achieved in under the number iterations required to detect the chromatic features and complete colors counted for the image compression.In the next step, the solutions have represented the intensity of colors pixels and chromatic features which can be detected and computed using the Hybrid algorithm of image compression. In this stage of research will improve its searching capacity for the image process environment. The image process is a stochastic process where pixels values are modeled as random variables, for calculating the probability density of grey level and color distribution as its image compression [13]. In this stage of image processing can get robust convergence as building simulations for image compression as possible with the reliable and high convergence of the original image. the compression hybrid algorithm efficiently improves the performance compression in the image processing environment, and the best selection individual of color pixels based on features function to finding probability density of grey level, colors gradient, colors distribution, pixels color and boundaries shapes into the original image. The selection operators of HCA will be selected set of colors pixels to be the best solutions that have a better classification, based on a features function for reconstruction new image [14]. VI. PROPOSED SYSTEM The proposed analysis system (HICA) of the image compression process will be explained the phases are shown in figure 1. The Transform process is applied for improving contrast variation and luminance in the original images. In the second phase, segmentation processes are applied and implemented to explore and isolate the interest pixels colors and remove noises before the image compression. The third phase goal is to extract the image characters to be used in the next phase of the compression process; the Features selection method is applied to decrease the redundant pixels and built a classification of the new Image. The selected features are selected for input to the classification method and take the decision about the class assignment by using the hybrid algorithm as shown in figure 1, the goal of the segmentation process in image compression is to separate colors from another different ingredient of the image[15]. Fig 1: Illustrates the block diagram of the HICAs proposed a system based on Lossless image compression. VII. ACTIVE CONTOUR AND IMAGE SEGMENTATION MODELS In the last years, there are recent developments in the image compression fields with a new techniques research for improving features analysis of image compression images. the techniques have been developed to identify specific structures in image colors. The active contour one of the main methods can be adaptable for the required and desired features in the image compression, an active contour is using to delineate an object outline of a possibly noisy for 2D images, and can be applied in several fields such as shape recognition, object tracking, edge detection and segmentation image[15]. In this research, experiments have a set of forms and several types of images. The selection process of an appropriate method for image variable colors and segmenting for specific type image have been always and forever a challenge to select the algorithm of the image compression. In the active contour method there are a lot of enhancements and implemented in Image Decompression Inverse Transform Transform Image Image Segmentation Entropy Coding Image Edge Detection Image Feature Extraction Original Image Image compression Entropy Decoding International Journal of Computer Science and Information Security (IJCSIS), Vol. 16, No. 3, March 2018 92 https://sites.google.com/site/ijcsis/ ISSN 1947-5500](https://image.slidesharecdn.com/12paper28021830ijcsiscamerareadypp-180403170327/75/Hybrid-Algorithm-for-Enhancing-and-Increasing-Image-Compression-Based-on-Image-Processing-Techniques-3-2048.jpg)
![the image colors segmentation, in some images should be applied active contour method in the changeable curves and change forms to avoid distort colors of image boundaries in the segmentation process[16]. The active contour models can be moved based on internal or external forces extracted based on different characteristics of the image colors. The active contour adaptation occurs in response to both internal and external forces, the external forces model has described the grayscale level gradient, the active contour models can be divided into two types: the parametric models like the Snakes model, which defines a flexible contour that can dynamically adapt to required edges of the image colors, and the geometric models, such as the Level Set model it embeds the front to be zero level set in the higher dimensional function, to calculate the new function evolution, this evolution operation is dependent on the image characteristics extracted and geometric restrictions of the function, the segmentations of image colors are implemented on sub-images, the parametric active contour model is a curve x(s) defined in Equation.1 [17], to be moved in the image spatial domain to minimize the time and energy function Emin(t,s) is defined in Eq.1, and therefore the ccompression time will be decreased as possible is defined by Eq.1. ( ) = ( ) , ( ) , ∈ {1,0} (1) ( ) = ( | ( )| ) + (| ( ) | ) + ( ) (2) Where x'(s), x″(s) use to found the first and second derivative, of x(s) respectively. α, β donate the weighting parameters of active contour model. Ext is the function of external energy which is derived from the image to take smaller values of boundaries features [18]. Energy Surface and Optimum Thresholding is the basics approach to image segmentation is an amplitude thresholding, a threshold T is chosen to separate the two regions modes, the image point for I(x,y) >T is considered as object points[19], otherwise, the point is called a background point. The threshold method is defined by Eq.3. ( , ) = 1 , ( , ) ≥ 0 , ( , ) < (3) Where T is set on the entire image basis I(x, y), and the threshold is global. When T depends on spatial coordinates x and y, based on a dynamic threshold, when T depends on both I(x,y) and set property p(x,y) of local image[19], the average of gray level in a neighborhood centered on I(x,y), the threshold will be local and T is set according to a fitness function is defined by Eq.4. : ( , ) = ( , ), ( , ) (4) The object locating will be described in the image I[x,y], using a template T[x,y], The best match Searching to minimize the mean squared errors (MSE) is written below: , = , − ( − ), ( − ) ( ) VIII. COMPUTE MSE, PSNR, AND ENTROPY A. Mean Square Error (MSE) In this part of the research, the MSE will be computed MSE between the source image and the compressed image. The MSE lower values mean minimum error as seen in the inverse relation among the PSNR and MSE.To find the PSNR, in the first, it should calculate the mean-squared error is defined as. = | ( , ) − ( , )| ., (6) In this equation, x, y denote the rows number and columns in the original images, respectively. B. Peak Signal-to-Noise Ratio (PSNR) The PSNR block computes PSNR between two images. The ratio will be used as a quality measurement of the source image and a compressed image. PSNR will be used as a quality measure of the image reconstruction, the higher PSNR should be evaluated the higher quality reconstruction. The PSNR is computed as in the following equation: = 10 (7) In the above equation, where R denotes the maximum range in the data type of original image. For example, the data type has an 8-bit integer of the image, so R = 255. C. Image Entropy Entropy image encoding is a lossless compression that can be implemented on an image color after the quantization process to represent image colors in a more efficient with minimum memory for saving stage or transmission. In the research paper will be applied the entropy encoding to increase the image compression ratio. In this paper will use the entropy encoding to evaluate and describe the image quantity, the pixels amount that should be coded by a compression algorithm. The low entropy images which containing a black sky, and has little bit contrast with pixels large run with similar digital numbers. In the image is perfectly flat, the entropy will equal zero. So, the image can be compressed to a small size. In the terrain images that have a lot of difference in a contrast from one pixel to another, it has very high entropy and cannot be compressed as much as the low entropy of image. In the image, colors have corresponded to the gray levels and the individual pixels can be adopted. In the image pixels that have been perfectly histogramming equalized, the pixels should be equally occupied in all states of pixels, and the spread of pixels is a maximum for the image entropy. On the other hand, the image colors which have been a threshold, there are two states are occupied and the entropy will be very low. International Journal of Computer Science and Information Security (IJCSIS), Vol. 16, No. 3, March 2018 93 https://sites.google.com/site/ijcsis/ ISSN 1947-5500](https://image.slidesharecdn.com/12paper28021830ijcsiscamerareadypp-180403170327/75/Hybrid-Algorithm-for-Enhancing-and-Increasing-Image-Compression-Based-on-Image-Processing-Techniques-4-2048.jpg)
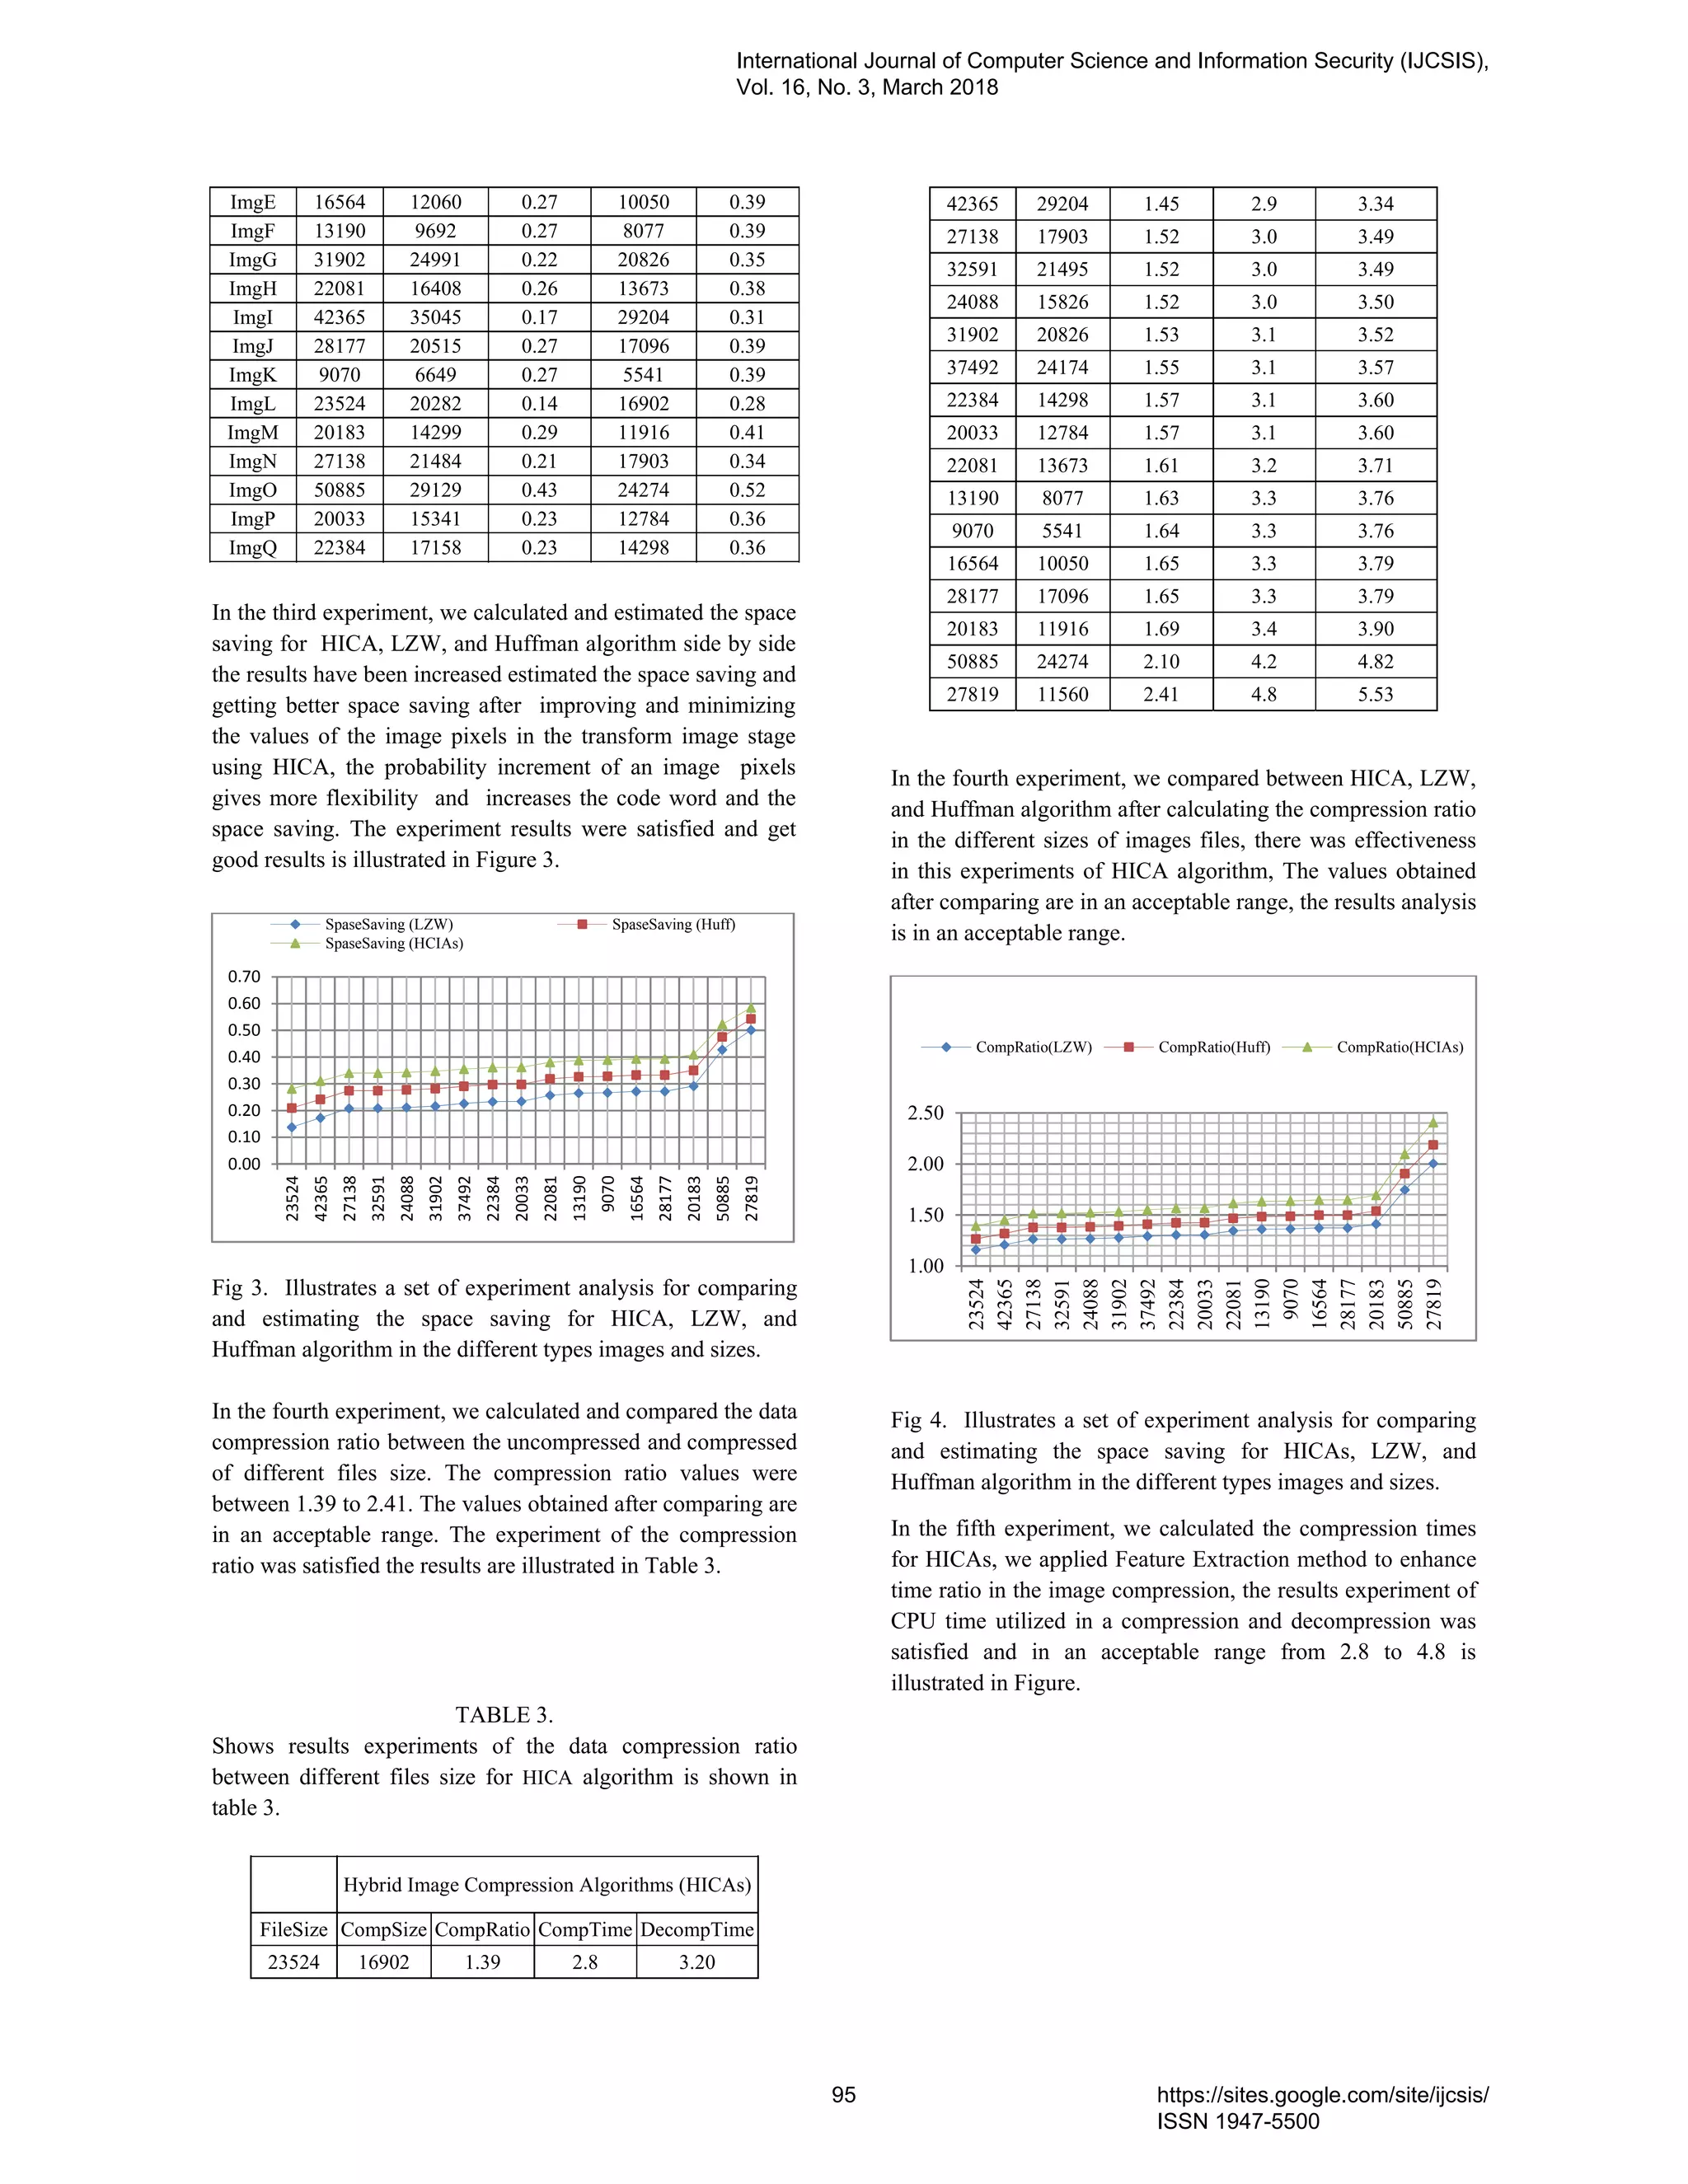
![The image entropy is equal zero when the pixels have the same values. in this research progression, we can note that the image entropy is decreased, in this case, the image colors should be moved from a full grayscale image to a threshold binary image (high entropy to zero entropy). So the compression ratio will be increased. All changes in the image colors are meaningful, the Changes of image pixels that due to noise to be part of an image, and it represents the image as more than required. the heat and Noise can be played the same roles in the entropy increased of Images. The image entropy H is defined as. = − ( ) (8) Where M is equal the gray levels number, while pi is the correlated probability with gray level i. Maximum entropy is achieved in the case of a uniform probability distribution, where M=2n and Pi is constant, given by = − 1 2 (9) The maximum entropy is found from = 1 1 (10) The image minimum entropy will be achieved if the image is not a variable, and all pixels have identical gray level i. For where the gray level pi = 1, and H = - log (1) = 0. The image entropy can restrict the lower bound on the bits average number per pixel for an image encoding without distortion and can apply to uncorrelated images is shown in figure 2. Fig 2. Illustrates a two image, the right has random noise; the right image has the same gray levels distribution. The left image has random noise and its entropy contains 8 bits and is uncompressible. The right image has the same gray levels distribution with strongly spatially correlated. IX. EXPERIMENTS AND RESULTS The proposed algorithm is applied to various types of Images such as medical images, classical images, commercial digital camera images etc. The experiments results show that the proposed algorithm has better efficiency and activity in the images compression from other algorithms; the results of the experiment were implemented in the Java application for image compression algorithms Package as illustrated above [1]. In the first experiment of the HICA proposed, the results quality and the compression ratio among the compressed image and the uncompressed image should be taken into consideration. The final size of compressed images is compared with the original images between Huffman Algorithm and HICA. Also, the compression time increases as the original size increases, and in contrast, the compression ratio decreases as the original file size increases. The algorithm gives a good compression ratio that lies between 30% and 58%. The results experiments are explained in table 1. TABLE1. Shows results analysis between Huffman Algorithm and HICA for compression images and space saving. Images FileSize (bits) Huffman Algorithm HCIAs Compression Size(bits) SpaceSaving (Huffman)% Compression Size(bits) SpaceSaving (HCIAs)% ImgA 37492 26591 0.29 24174 0.36 ImgB 27819 12716 0.54 11560 0.58 ImgC 32591 23645 0.27 21495 0.34 ImgD 24088 17409 0.28 15826 0.34 ImgE 16564 11055 0.33 10050 0.39 ImgF 13190 8885 0.33 8077 0.39 ImgG 31902 22909 0.28 20826 0.35 ImgH 22081 15040 0.32 13673 0.38 ImgI 42365 32124 0.24 29204 0.31 ImgJ 28177 18806 0.33 17096 0.39 ImgK 9070 6095 0.33 5541 0.39 ImgL 23524 18592 0.21 16902 0.28 ImgM 20183 13108 0.35 11916 0.41 ImgN 27138 19693 0.27 17903 0.34 ImgO 50885 26701 0.48 24274 0.52 ImgP 20033 14062 0.30 12784 0.36 ImgQ 22384 15728 0.30 14298 0.36 In the second experiment, we compared the results analysis of the space saving and compression images between LZW Algorithm and HICA. The results obtained after comparing and it was in an acceptable range, we can observe that the HICAs algorithm performs in an efficient way and gives better results is shown in table 2. TABLE 2. Shows results experiments between LZW Algorithm and HICA of space saving for compression images is shown in table 2. No FileSize LZW Algorithm HCIAs Compressio n Size(bits) SpaceSavin g (LZW)% Compressio n Size(bits) SpaceSavin g (HCIAs)% ImgA 37492 29009 0.23 24174 0.36 ImgB 27819 13872 0.50 11560 0.58 ImgC 32591 25794 0.21 21495 0.34 ImgD 24088 18991 0.21 15826 0.34 International Journal of Computer Science and Information Security (IJCSIS), Vol. 16, No. 3, March 2018 94 https://sites.google.com/site/ijcsis/ ISSN 1947-5500](https://image.slidesharecdn.com/12paper28021830ijcsiscamerareadypp-180403170327/75/Hybrid-Algorithm-for-Enhancing-and-Increasing-Image-Compression-Based-on-Image-Processing-Techniques-5-2048.jpg)
![X. CONCLUSION AND FUTURE WORK In this research, .we applied Hybrid image compression algorithms on different images. The results of an experiment for CPU time utilized in a compression and decompression was satisfied and an acceptable. We developed Hybrid image compression algorithms to be capable of extending the image compression based on image processing techniques for better space saving. we recommend using this approach of Hybrid image compression algorithms (HICA) for enhancing and increasing compression images. In the Future work will apply the multi-objective of genetic algorithm based on image techniques with different types of optimization to improve the performance of Image compression in all entire domains. REFERENCES [1] Khalil Ibrahim Mohammed Abuzanounneh,” New Image Processing Techniques Using Elitism Immigrants Multiple Objective of Genetic Algorithms for Disease Detection”, International Journal of Computer Science and Information Security (IJCSIS), Vol. 15, No. 12, December 2017 [2] Khalil Ibrahim Mohammad Abuzanouneh.,” Develop and Design Hybrid Genetic Algorithms with Multiple Objectives in Data Compression”, IJCSNS International Journal of Computer Science and Network Security, VOL.17 No.10, October 2017 32 [3] Huffman D. A., “A Method for the Construction of Minimum Redundancy Codes”,'Proceedings of the IRE, Vol.40, pp.1098-1101,1952. [4] Jeffrey N.Ladino,”Data Compression Algorithms”, http://www.faqs.org/faqs/compression- faq/part2/section1.html. [5] Article-Compressing and Decompressing Data using Java by Qusay H.Mahmoud with contributions from KonstantinKladko. February 2002. [6] Mark Nelson, Jean-loup Gailly,”The Data Compression Book”, 2nd edition M&T Books, NY 1995, ISBN 1- 55851- 434- 1. NewYork, [7] Welch T . A., “A Technique for High -Performance Data Compression,'' Computer, pp. 8--18, 1984. [8] Object enhancement and extraction. Picture Processing and Psychopictorics by Prewitt JMS (1970), pp. 75–149. [9] Otsu N (1975) A threshold selection method from gray- level histograms. Automatic 11:285–296. [10] Woods RE, Gonzalez RC, Eddins SL (2003) Digital image processing using MATLAB. Prentice-Hall, Upper Saddle River. [11] SobelI (1978) Neighborhood coding of binary images for fast contour following and general array binary processing. Comput Graph Image Process 8:127–135. [12] Mark. Nelson, Interactive Data Compression Tutor & The data compression book2nd Ed. by M&T books, HTTP: www.bham. ac.uk. [13] Dr. Dobb's Mark Nelson,” LZW Data Compression”, by Journal October 1989. [14] P. D. Johnson, D. Hankerson and G. A. Harris, “Introduction to Information Theory and Data Compression “. [15] J. C. Vitter, P. G .Howard,”Arithmetic Coding for Data Compression,” Proceedings of the IEEE, vol. 82, no 6, 1994 , pp 857 - 865. [16] Terzopoulos D Kass M, Witkin A,”Snakes: active contour models”. Comput Graph Image Process 1: 321.1988 [17] Xu C and Prince J “Gradient vector flow: a new external force for snakes”. In 1997 IEEE Computer Society Conference on Computer Vision and Pattern Recognition, Proceedings, pp. 66 – 71. International Journal of Computer Science and Information Security (IJCSIS), Vol. 16, No. 3, March 2018 97 https://sites.google.com/site/ijcsis/ ISSN 1947-5500](https://image.slidesharecdn.com/12paper28021830ijcsiscamerareadypp-180403170327/75/Hybrid-Algorithm-for-Enhancing-and-Increasing-Image-Compression-Based-on-Image-Processing-Techniques-8-2048.jpg)
![[18] Canny J.”A computational approach to edge detection.”, IEEE Trans. Pattern Anal Mach Intel, pp 679 – 698, 1986. [19] Ahmed Kattan Riccardo Poli, " Evolutionary lossless compression with GP- ZIP *," in Proceedings of the 10th annual conference on Genetic and evolutionary computation, Atlanta, Georgia, USA, 2008, 2008, pp. 1211 - 1218. [20] Data compression Structures. http: www.gitta.info - Version from: 18.6.2010. Dr. Khalil Ibrahim Mohammed Abuzanouneh is an assistant professor in Computer College at the Department of Information Technology, Qassim University. In teaching, he has been focusing on applying genetic algorithms and solves the problem based on genetics approaches in Computer Education. In research, his current interests include Image processing, optimization problem, data compression and data security. Dr. Khalil received his Ph.D. degree in Computer Engineering, “Computer Aided Design”. International Journal of Computer Science and Information Security (IJCSIS), Vol. 16, No. 3, March 2018 98 https://sites.google.com/site/ijcsis/ ISSN 1947-5500](https://image.slidesharecdn.com/12paper28021830ijcsiscamerareadypp-180403170327/75/Hybrid-Algorithm-for-Enhancing-and-Increasing-Image-Compression-Based-on-Image-Processing-Techniques-9-2048.jpg)