Download to read offline
![International Research Journal of Engineering and Technology (IRJET) e-ISSN: 2395-0056 Volume: 11 Issue: 01 | Jan 2024 www.irjet.net p-ISSN: 2395-0072 © 2024, IRJET | Impact Factor value: 8.226 | ISO 9001:2008 Certified Journal | Page 386 FAULT DETECTION IN FIVE BUS SYSTEM USING MATLAB & SIMULINK (DISCRETE WAVELET TRANSFORM METHOD) Suraj Kumar Padhan1, Lokesh Jaiswal2, Pranjal Prajapati3 and Ganesh Ram Ratnakar4 1 Department of Electrical and Electronics Engineering, Chouksey Engineering College, Bilaspur, Chhattisgarh, India 2Department of Electrical and Electronics Engineering, Chouksey Engineering College, Bilaspur, Chhattisgarh,, India 3Department of Electrical and Electronics Engineering, Chouksey Engineering College, Bilaspur, Chhattisgarh,, India 4Assistant Professor, Department of Electrical and Electronics Engineering, Chouksey Engineering College, Bilaspur, Chhattisgarh,, India ---------------------------------------------------------------------***---------------------------------------------------------------------- Abstract - The transmission line is a critical component of the power system, but it is vulnerable to faults due to its exposure to harsh environmentalconditions. Thesefaults, such as open circuit and short circuit, directly affect the quality of the electric power supplied. Therefore, it is essential to promptly detect and fix any faults to ensure the reliable operation of the power system. Fault diagnostics are crucial for maintaining the stability of a multi-bus system within the power system. This research focuses on a five-bus system and presents twelve differenttypesoffaultswithvarying durations in transmission lines at different locations. To determine the specific fault type, the receiving end current signals of the line undergo Discrete Wavelet Transform (DWT). The resulting wavelet coefficients are then used in the fault identification process. The simulation and extraction of wavelet coefficients are carried out accordingly. Keywords: Line fault, Discrete Wavelet Transforms (DWT), Wavelet coefficient, five bus system, MATLAB. 1. Introduction Ensuring that energy is clean, affordable, and reliable is crucial in the fight against poverty and climate change. With the increasing integration of renewable energy by various agencies, Grid Automation is becoming an inevitable task in smart grids. Transmission line faults, whether symmetrical or unsymmetrical, occur frequently due to various adverse factors such as environmental imbalances, overloads, and lack of maintenance [1]. Detecting these faults in a timely manner is essential for maintaining a reliable power system with minimal interruptions. In recentyears,several decision algorithms have been proposed for locating faults in multi- terminal systems [2–4]. This paper focuses onusingwavelet transform [5–7], specifically the db8 wavelet,toextractfault features from line currents in transmission lines. By analyzing these features, the type of fault can be identified [9]. 2. System Under Study The provided Figure 1 illustratesthesingleLineDiagram of a five bus system that is being analyzed. This system consists of two sources and four loads, all interconnected through a transmission line network comprising seven lines [8]. Detailed specifications for the transmission lines, sources, and loads can be found in Tables 1 and 2. It is worth noting that Bus number2isconnectedto both a generator and a load. Additionally, Bus 1, referred toasthe Generator Bus, serves as the Slack Bus, responsible for maintaining a balance between active and reactive power. For the purpose of this study, a Typical 5 Bus configuration has been adopted as the base system for analysis. Table 1 presents the Transmission Linespecificationsfora T-section Model. A fitting reference value of 100 MVA, denoted as Sb, and a base kV of 230 kV, denoted as Vb, are utilized. The specifications include the values for Positive and Zero Sequence Resistance, as well as Inductance. Figure 1:- Five bus system under study. Table 1 :- Transmission line specifications Bus Length of Trans. Line km Positive Seq. R (Ω/km) Zero Seq. R (Ω/km) Positive Seq. L (H/km) Zero Seq. L (H/km) Positive Seq. C (F/km) Zero Seq. C (F/km) 1–2 46 0.23 0.66 0.0017 0.0052 6.3 × 10⁻⁹ 1.89 × 10−8](https://image.slidesharecdn.com/irjet-v11i163-240212101318-77fcdc93/75/FAULT-DETECTION-IN-FIVE-BUS-SYSTEM-USING-MATLAB-SIMULINK-DISCRETE-WAVELET-TRANSFORM-METHOD-1-2048.jpg)
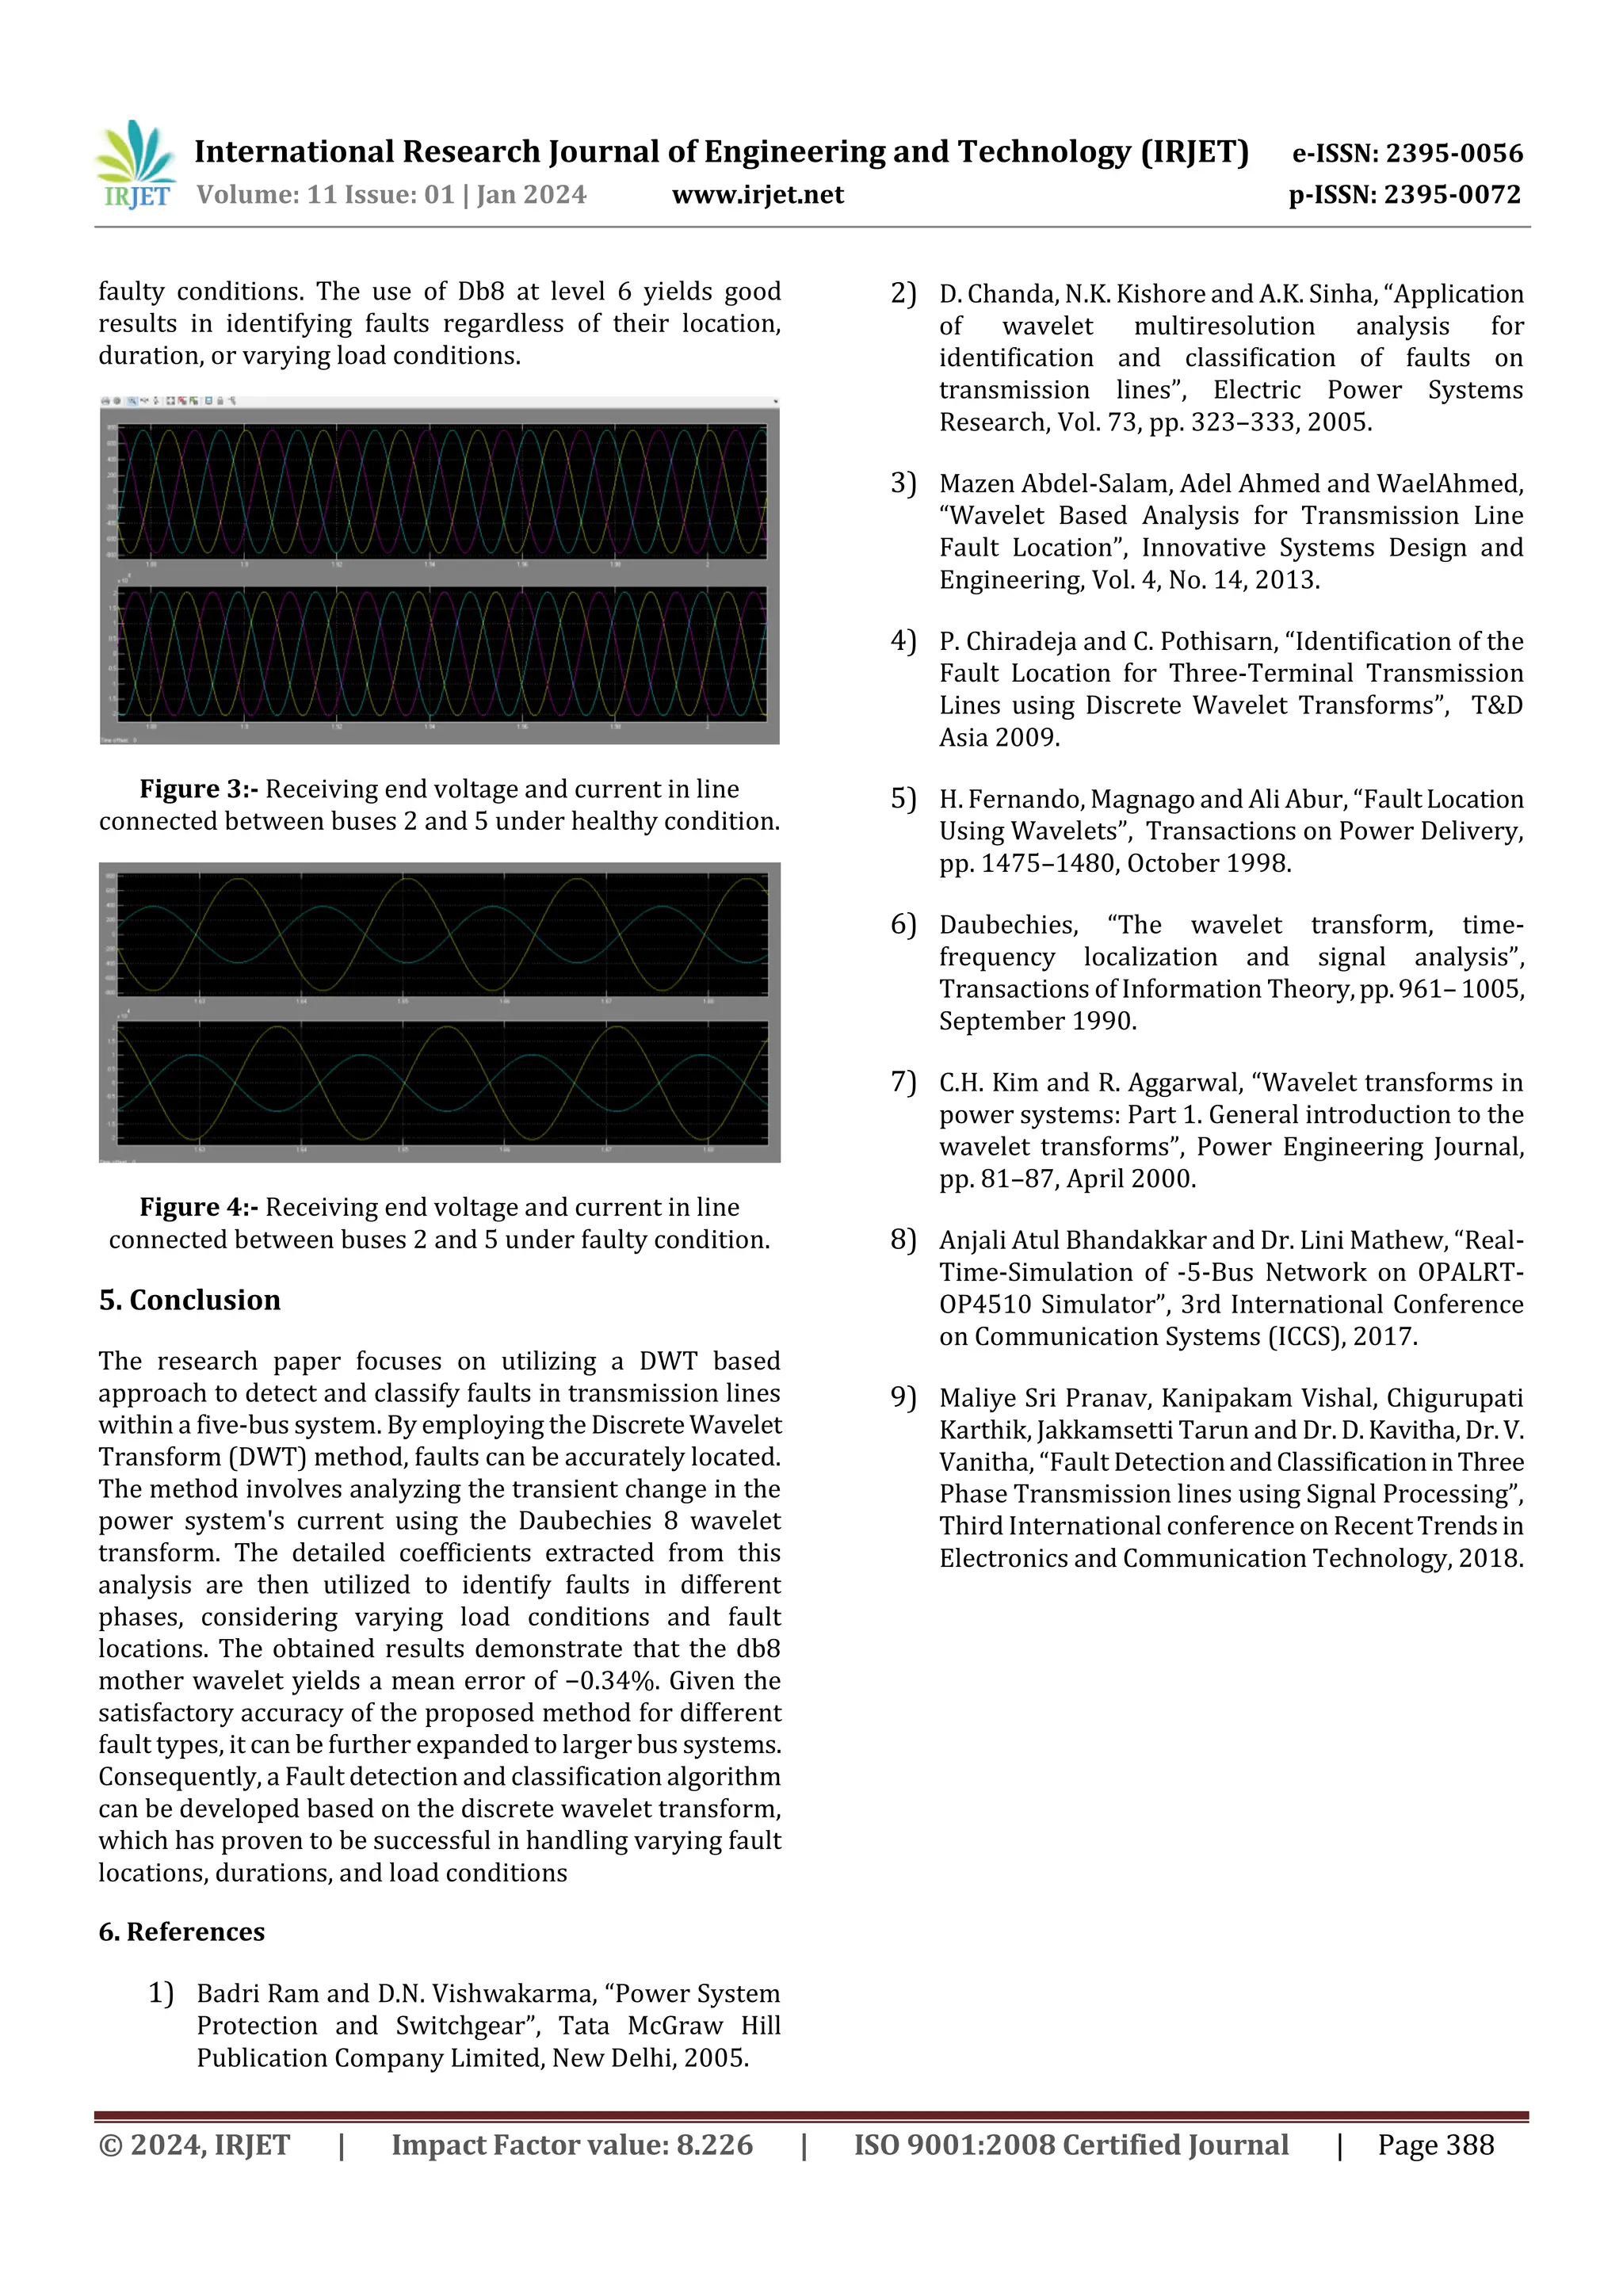
![International Research Journal of Engineering and Technology (IRJET) e-ISSN: 2395-0056 Volume: 11 Issue: 01 | Jan 2024 www.irjet.net p-ISSN: 2395-0072 © 2024, IRJET | Impact Factor value: 8.226 | ISO 9001:2008 Certified Journal | Page 387 1–3 86 0.47 1.45 0.0038 0.0115 2.87 × 10⁻⁹ 8.62 × 10⁻⁹ 2–3 68 0.46 1.40 0.0037 0.0112 2.97 × 10⁻⁹ 8.91 × 10⁻⁹ 2–4 68 0.46 1.40 0.0037 0.0112 2.97 × 10⁻⁹ 8.91 × 10⁻⁹ 2–5 46 0.45 1.34 0.0035 0.0105 3.15 × 10⁻⁹ 9.45 × 10⁻⁹ 3–4 18 0.27 0.813 0.0021 0.0064 5.14 × 10⁻⁹ 1.54 × 10⁻⁹ 4–5 86 0.47 1.455 0.0038 0.0115 2.87 × 10⁻⁹ 8.62 × 10⁻⁹ Table 2 Source and load specifications Bus PG (W) QG (VAR) Q-Max (VAR) Q-Min (VAR) PL (W) QL (VAR) 1 0 0 500 × 106 500 × 106 0 0 2 40 × 106 0 300 × 106 −300 × 106 20 × 106 10 × 106 3 0 0 0 0 45 × 106 15 × 106 4 0 0 0 0 40 × 106 5 × 10⁶ 5 0 0 0 0 60 × 106 10 × 106 The Transmission Line model incorporates the calculation and application of capacitance. The length of the Transmission Line is determined by considering the resistance and reactance values [8]. In MATLAB/Simulink, the Load Flow Bus Block should be connected to the Bus where the voltage and angle measurements are required. Table 2 provides information on the Load Flow requirements for the Source and Load Bus. The Real and Reactive Power values for all five Buses are obtained from the Generator and Load Block, as indicated in Table 2. 3. Simulation Of Five Bus System The MATLAB/Simulink environmentwasutilizedtodevelop the Five Bus model of the power system, with the specified parameters. A load flow study was conducted under normal operating conditions. The Load Flow Studies Block in MATLAB/Simulink was employed to obtain the Load Flow results after performing the simulation. These results are presented in Table 3, which demonstrates that the system is functioning flawlessly under steady state conditions. Additionally, Figure 2 illustrates a pie section model of the 5 bus system that was used for the simulation. Thecontinuous block was employed for simulation in discrete time. A 100 kVA system consisting of Five Buses was considered for the simulation, withthesystemspecificationsprovidedinTables 2 and 3. Figure 2 :- Simulated five buses system. Table 3 :- Load flow results of five bus system The MATLAB software is utilized to design and simulate the system. By employing the 3-phase Fault Generator Block, a three phase Fault is introduced to the system, and the resulting signals are captured at the receiving end for all twelve Fault conditions. The Simulation time that is taken into account is 0.1 s. 4. Interpretation From The Simulation Results The analysis for detecting three-phase faults is currently being conducted using the MATLAB/Simulink Tool. In order to effectively capture the features of fault signals, the Wavelet Transform Db8 Level 6 has been chosen for Fault Detection. If the fault involves the ground, the sum of detailed coefficients in the three phases will not be equal to zero. However, if there is no fault, the sum will be equal to zero. Under faulty conditions,thesumofdetailedcoefficients in the three phases is found to be different from that of healthy conditions. Even though the wavelet coefficients do not deviate significantly when the fault duration is reduced, they are still sufficient to distinguish between healthy and](https://image.slidesharecdn.com/irjet-v11i163-240212101318-77fcdc93/75/FAULT-DETECTION-IN-FIVE-BUS-SYSTEM-USING-MATLAB-SIMULINK-DISCRETE-WAVELET-TRANSFORM-METHOD-2-2048.jpg)

This document describes a study that uses discrete wavelet transform (DWT) to detect and classify faults in a five-bus power transmission system simulated in MATLAB/Simulink. Twelve different fault types with varying durations are introduced at different transmission line locations in the five-bus system. The current signals at the receiving end of lines undergoing faults are analyzed using DWT to extract wavelet coefficients. These coefficients are then used to identify the specific fault type, location, and duration. The results demonstrate that DWT with the db8 mother wavelet can accurately detect and classify faults with mean error of -0.34% under different system conditions.