Downloaded 46 times


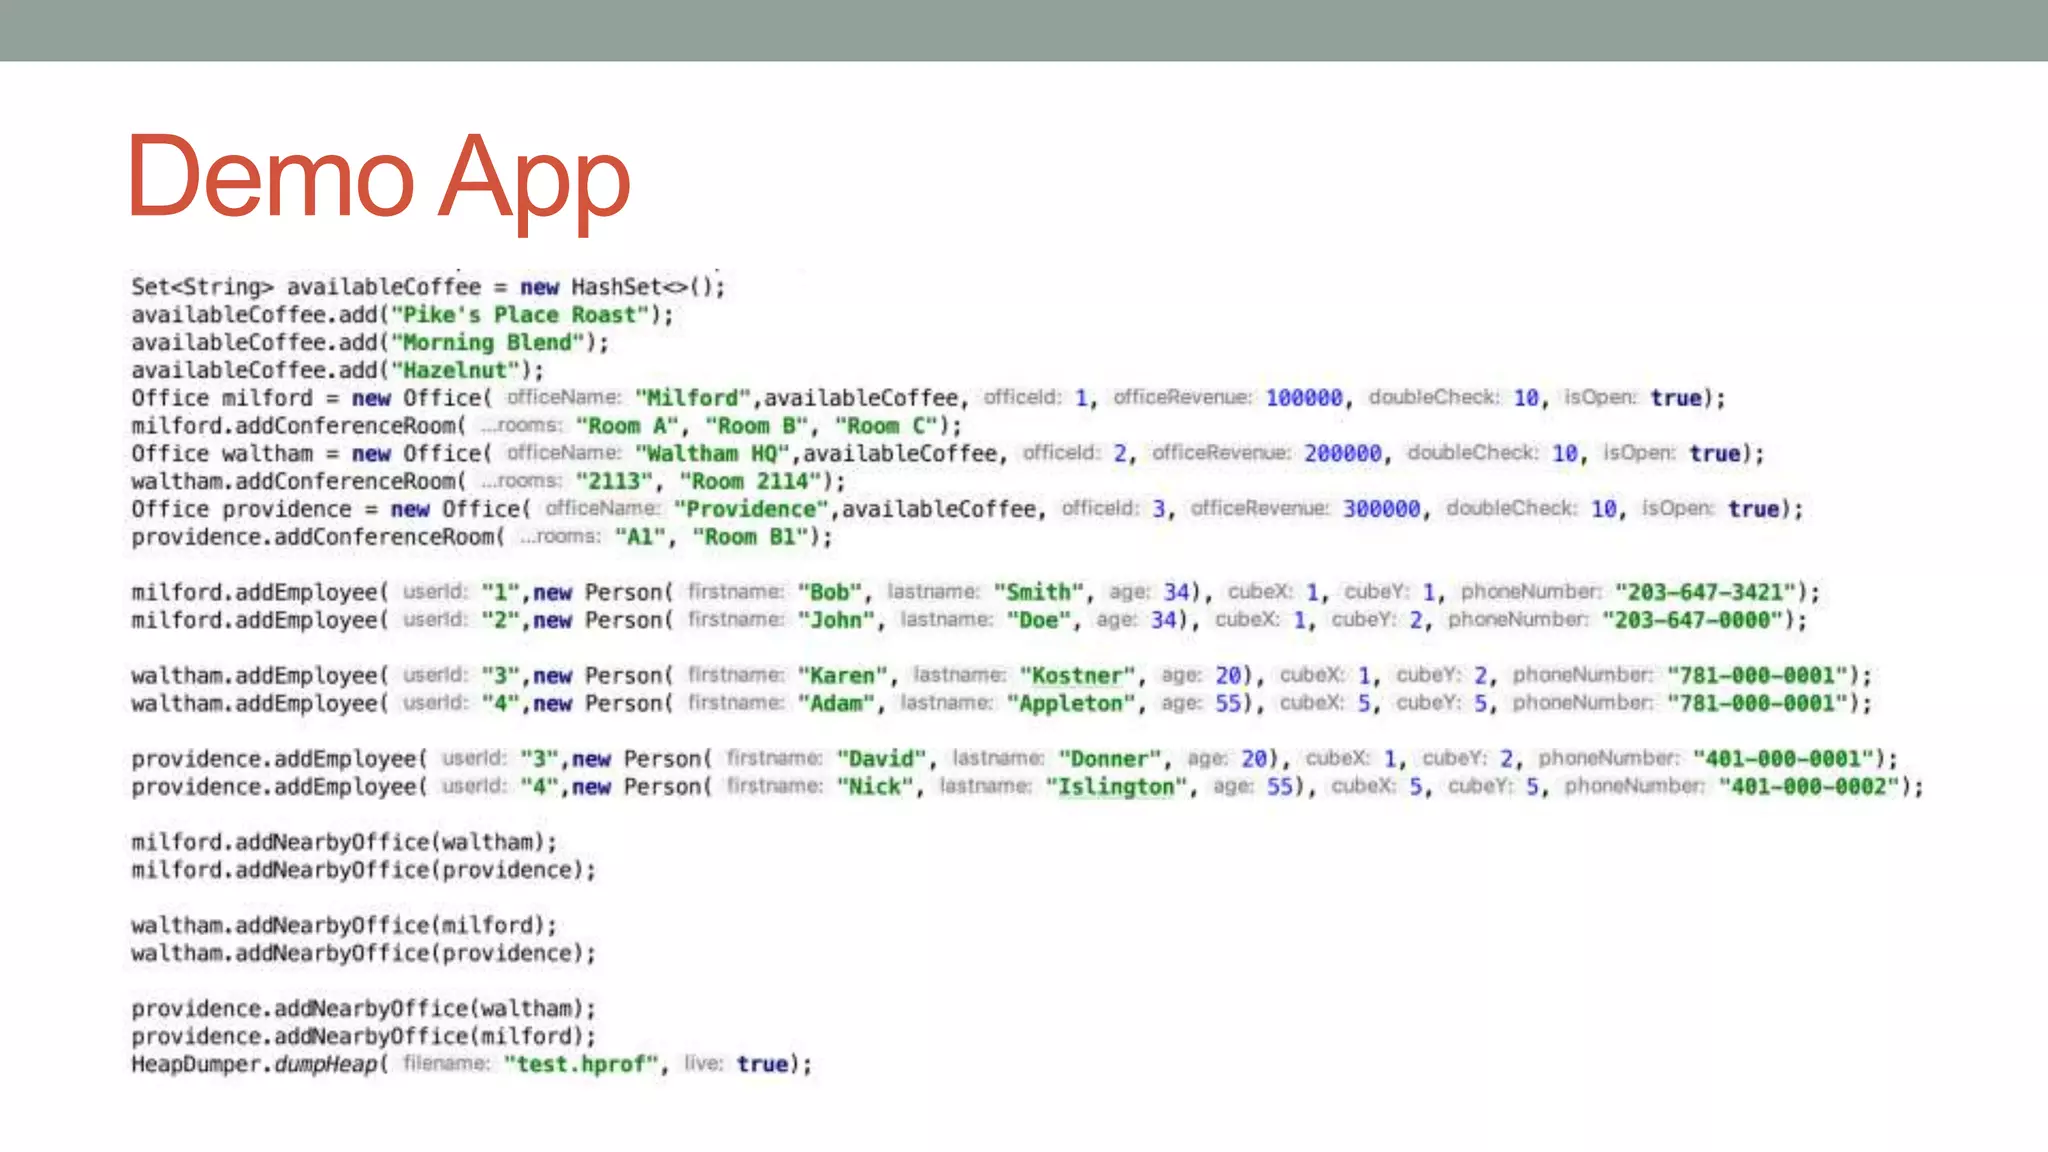
![Demo App Note: Used HashSets, Arrays[][], Lists, and Vectors](https://image.slidesharecdn.com/exploringheapdumpsv1-181023032517/75/Exploring-Java-Heap-Dumps-Oracle-Code-One-2018-57-2048.jpg)
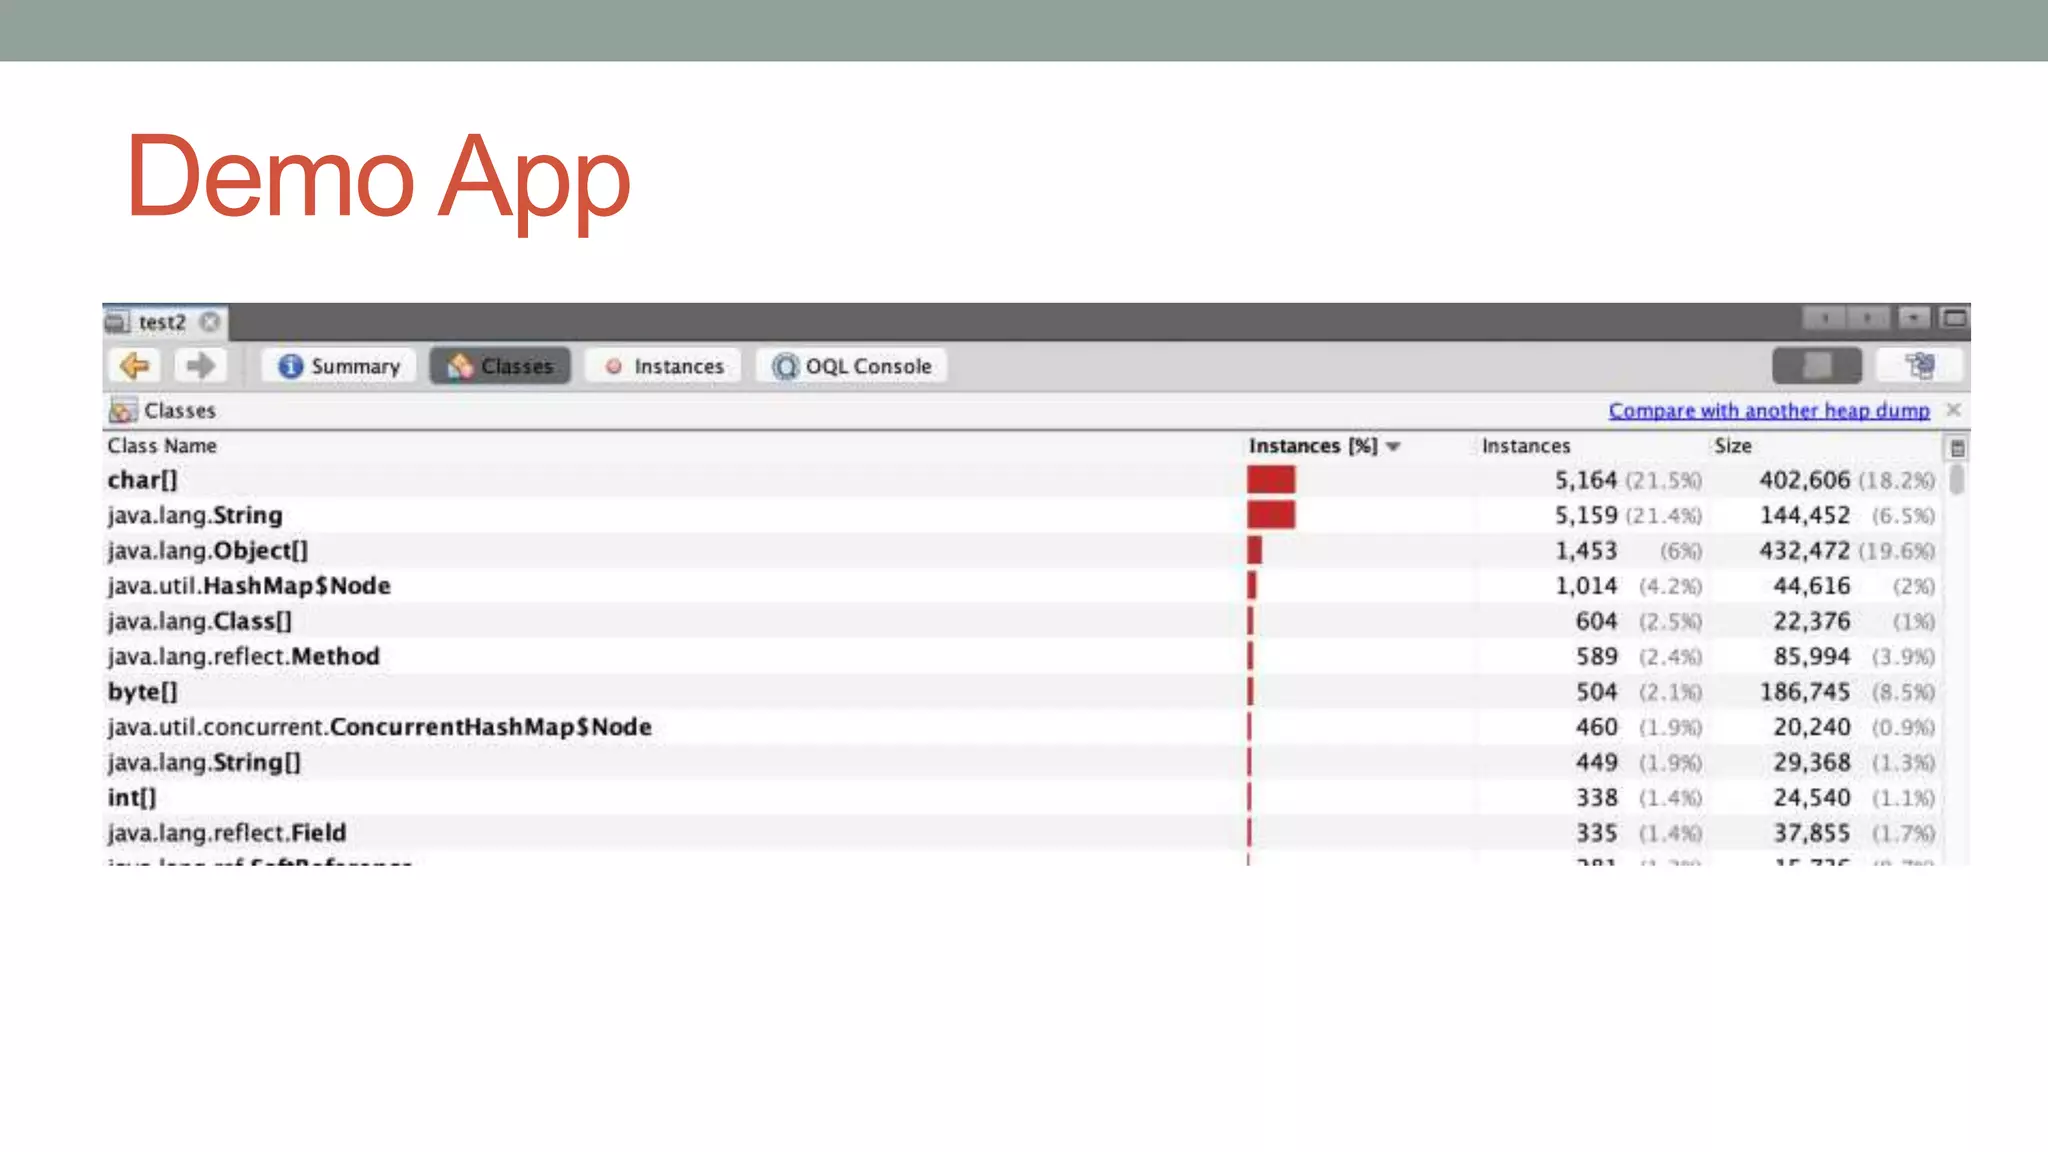
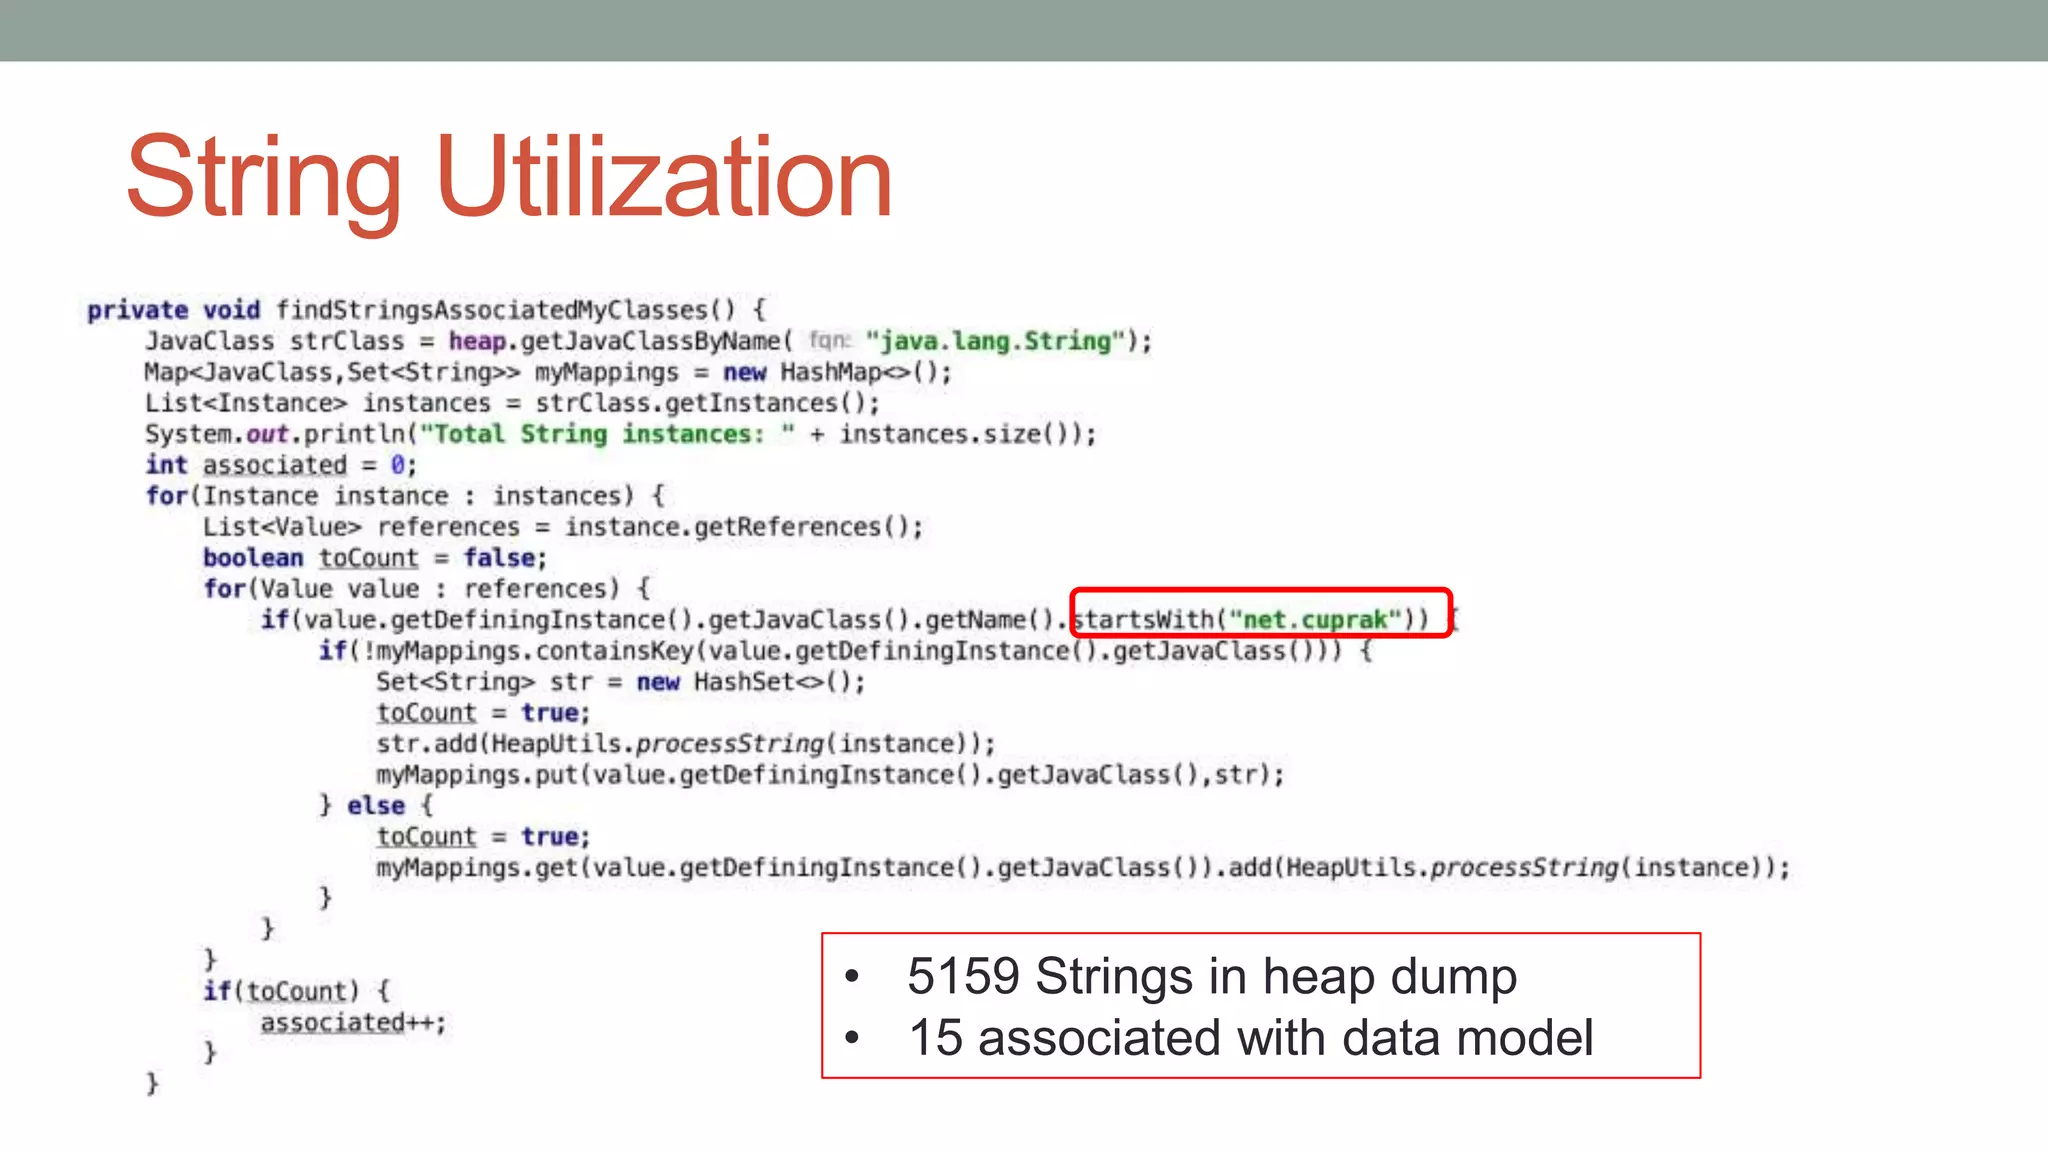
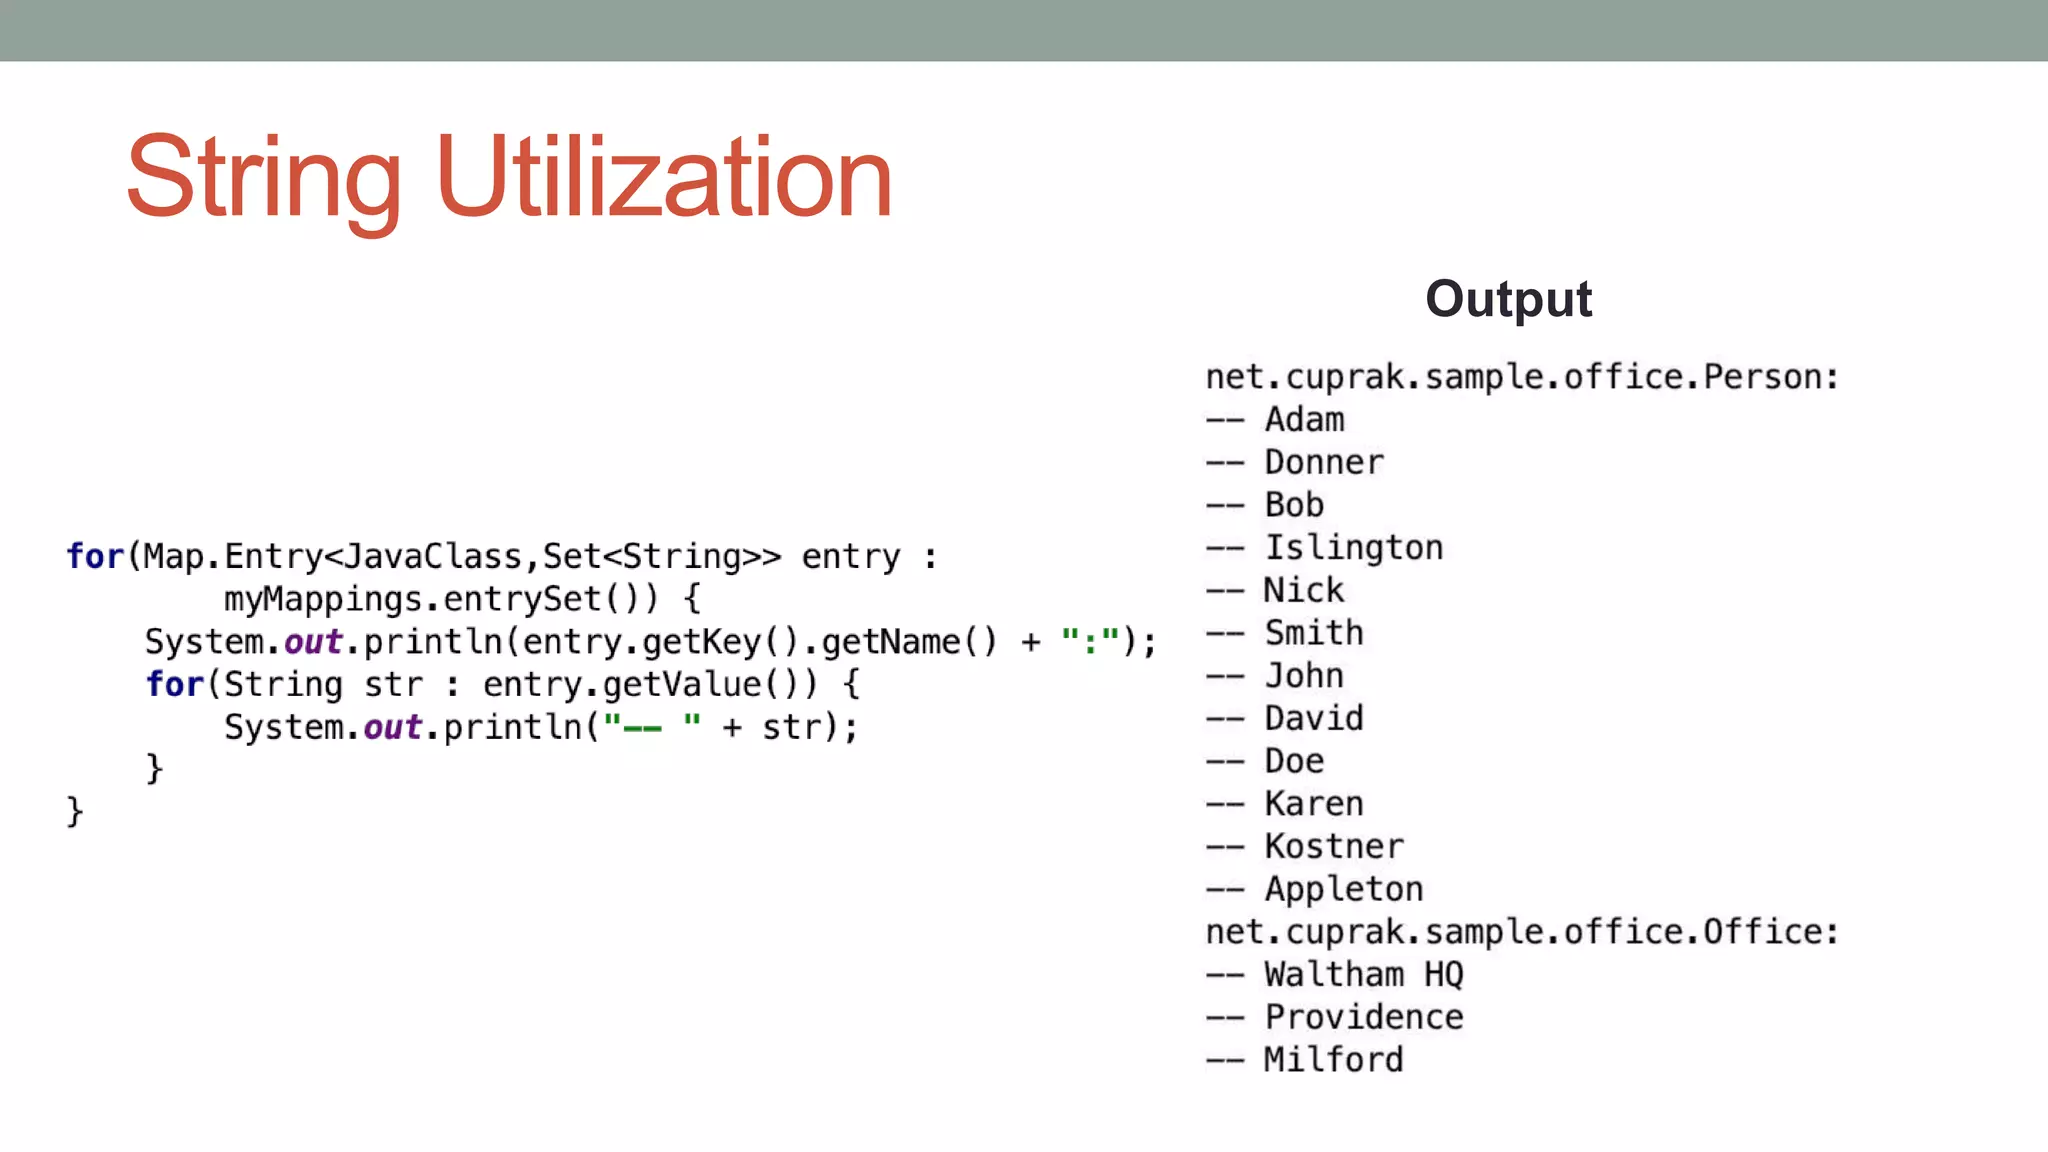
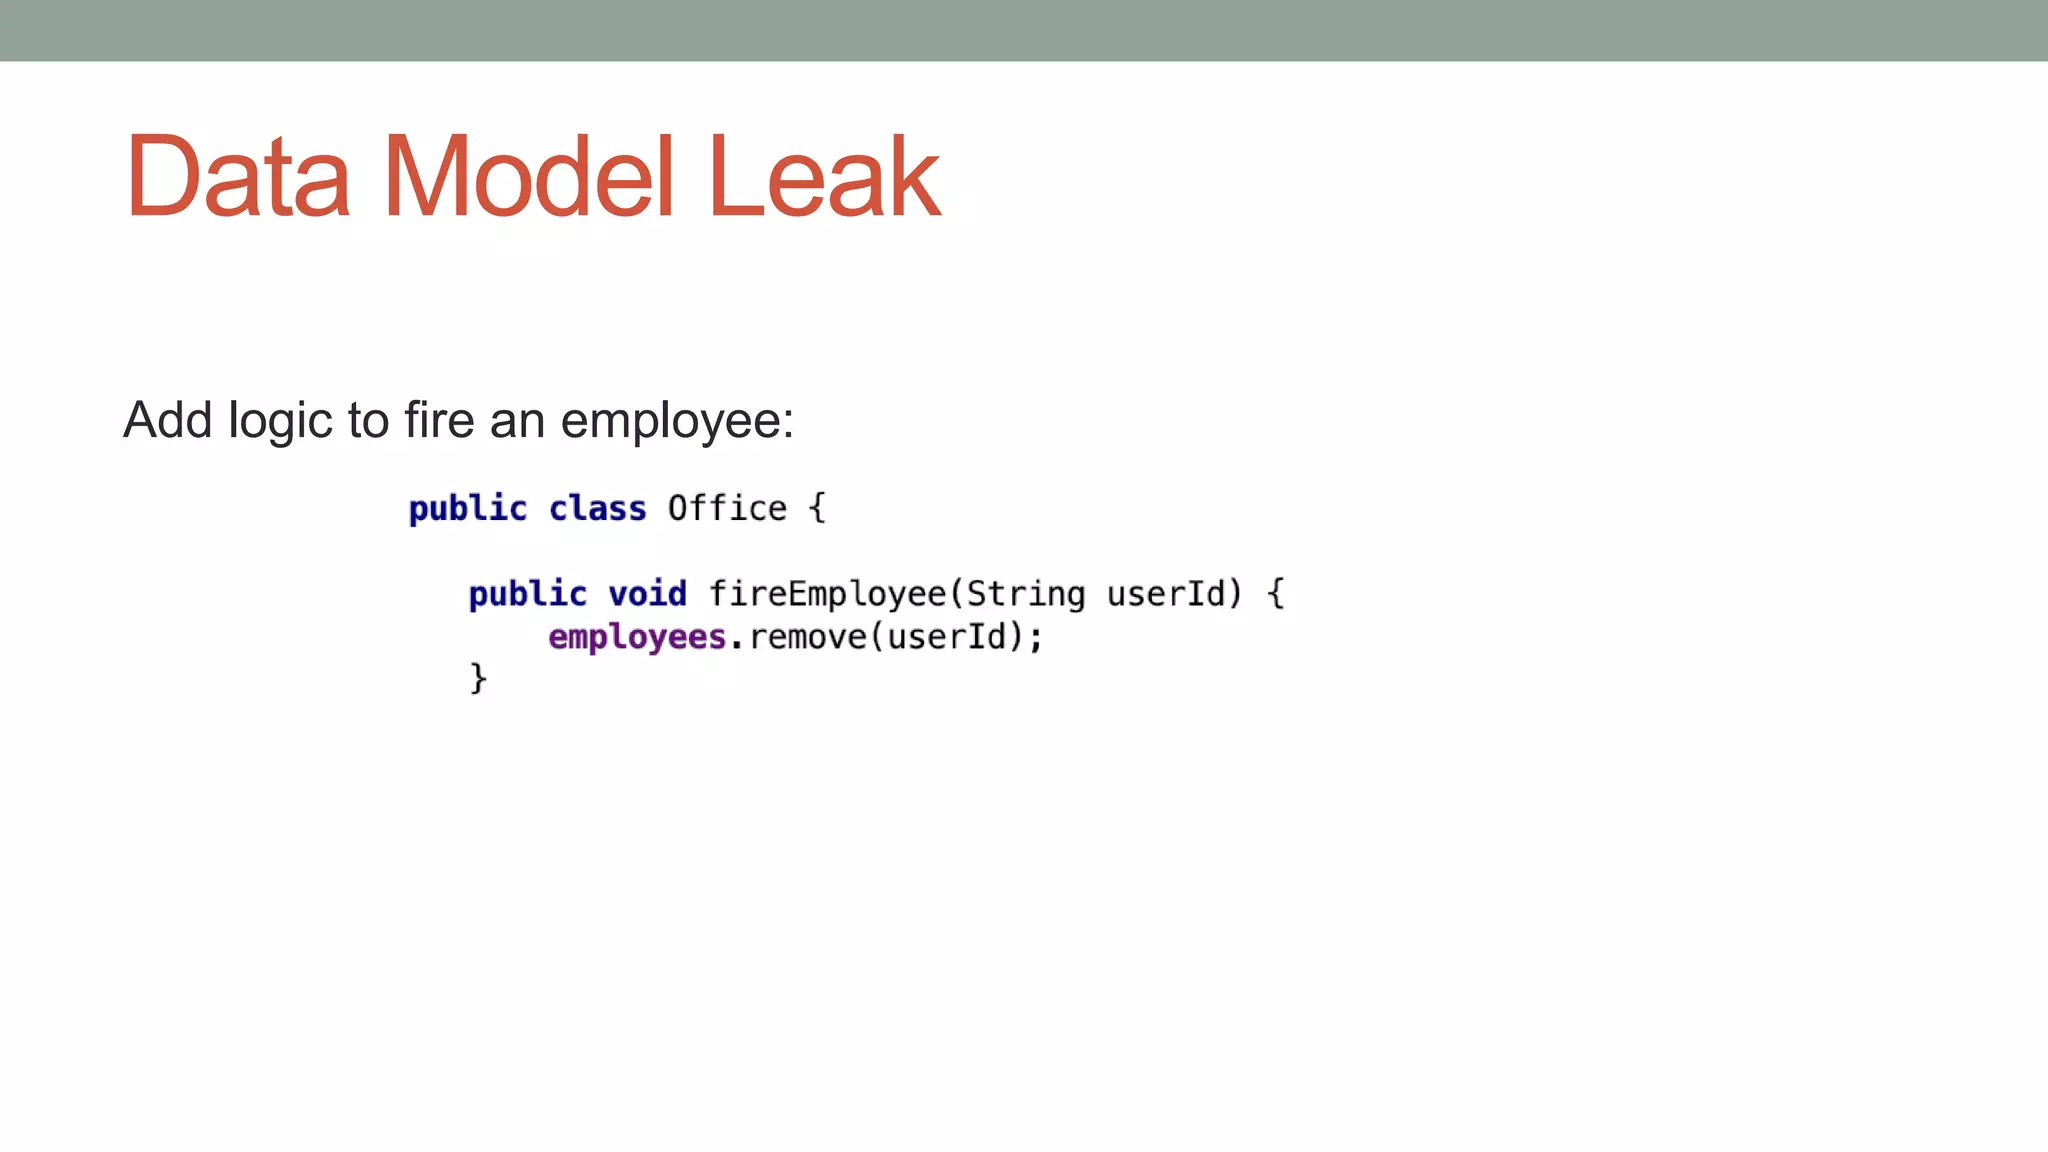
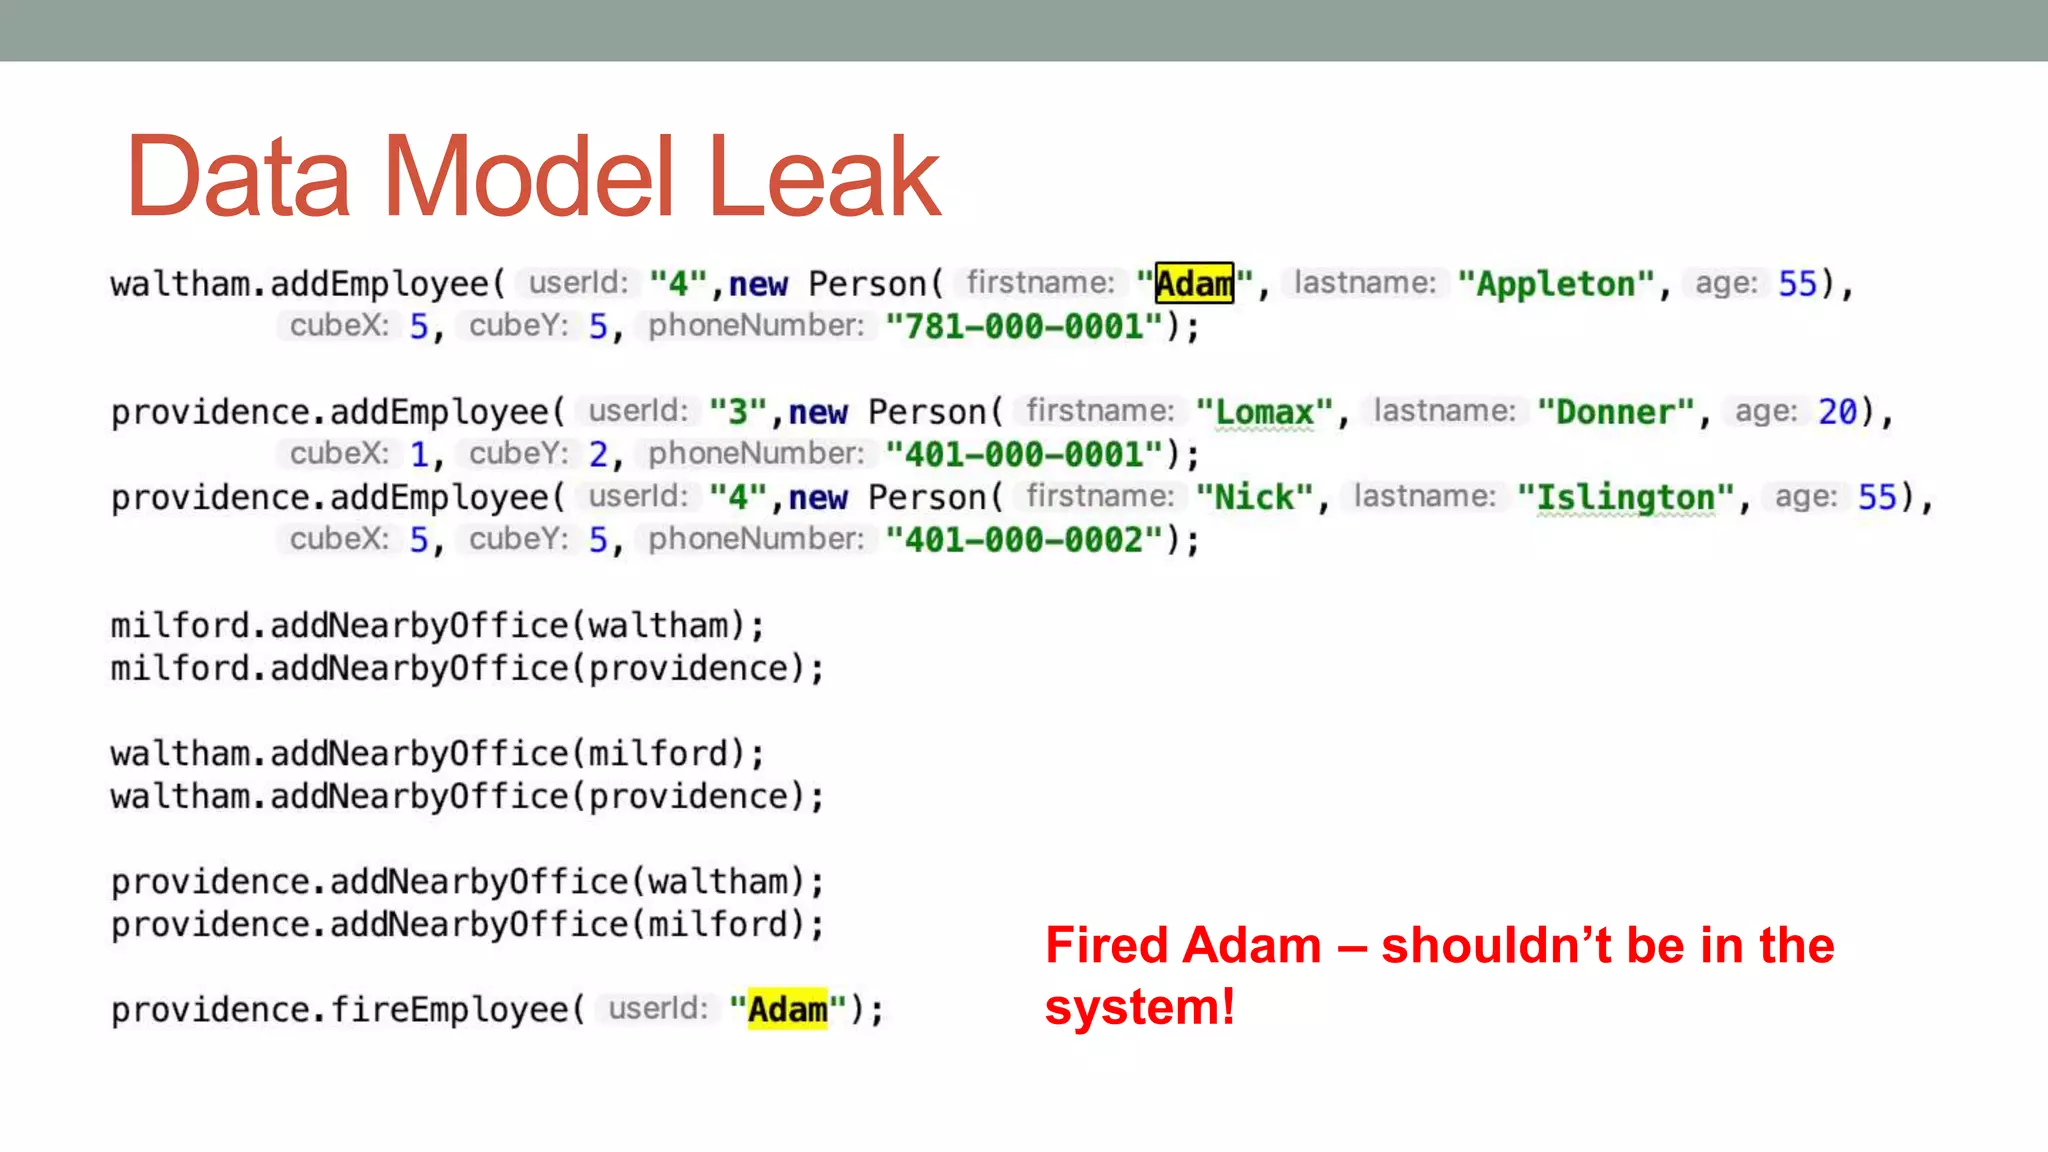
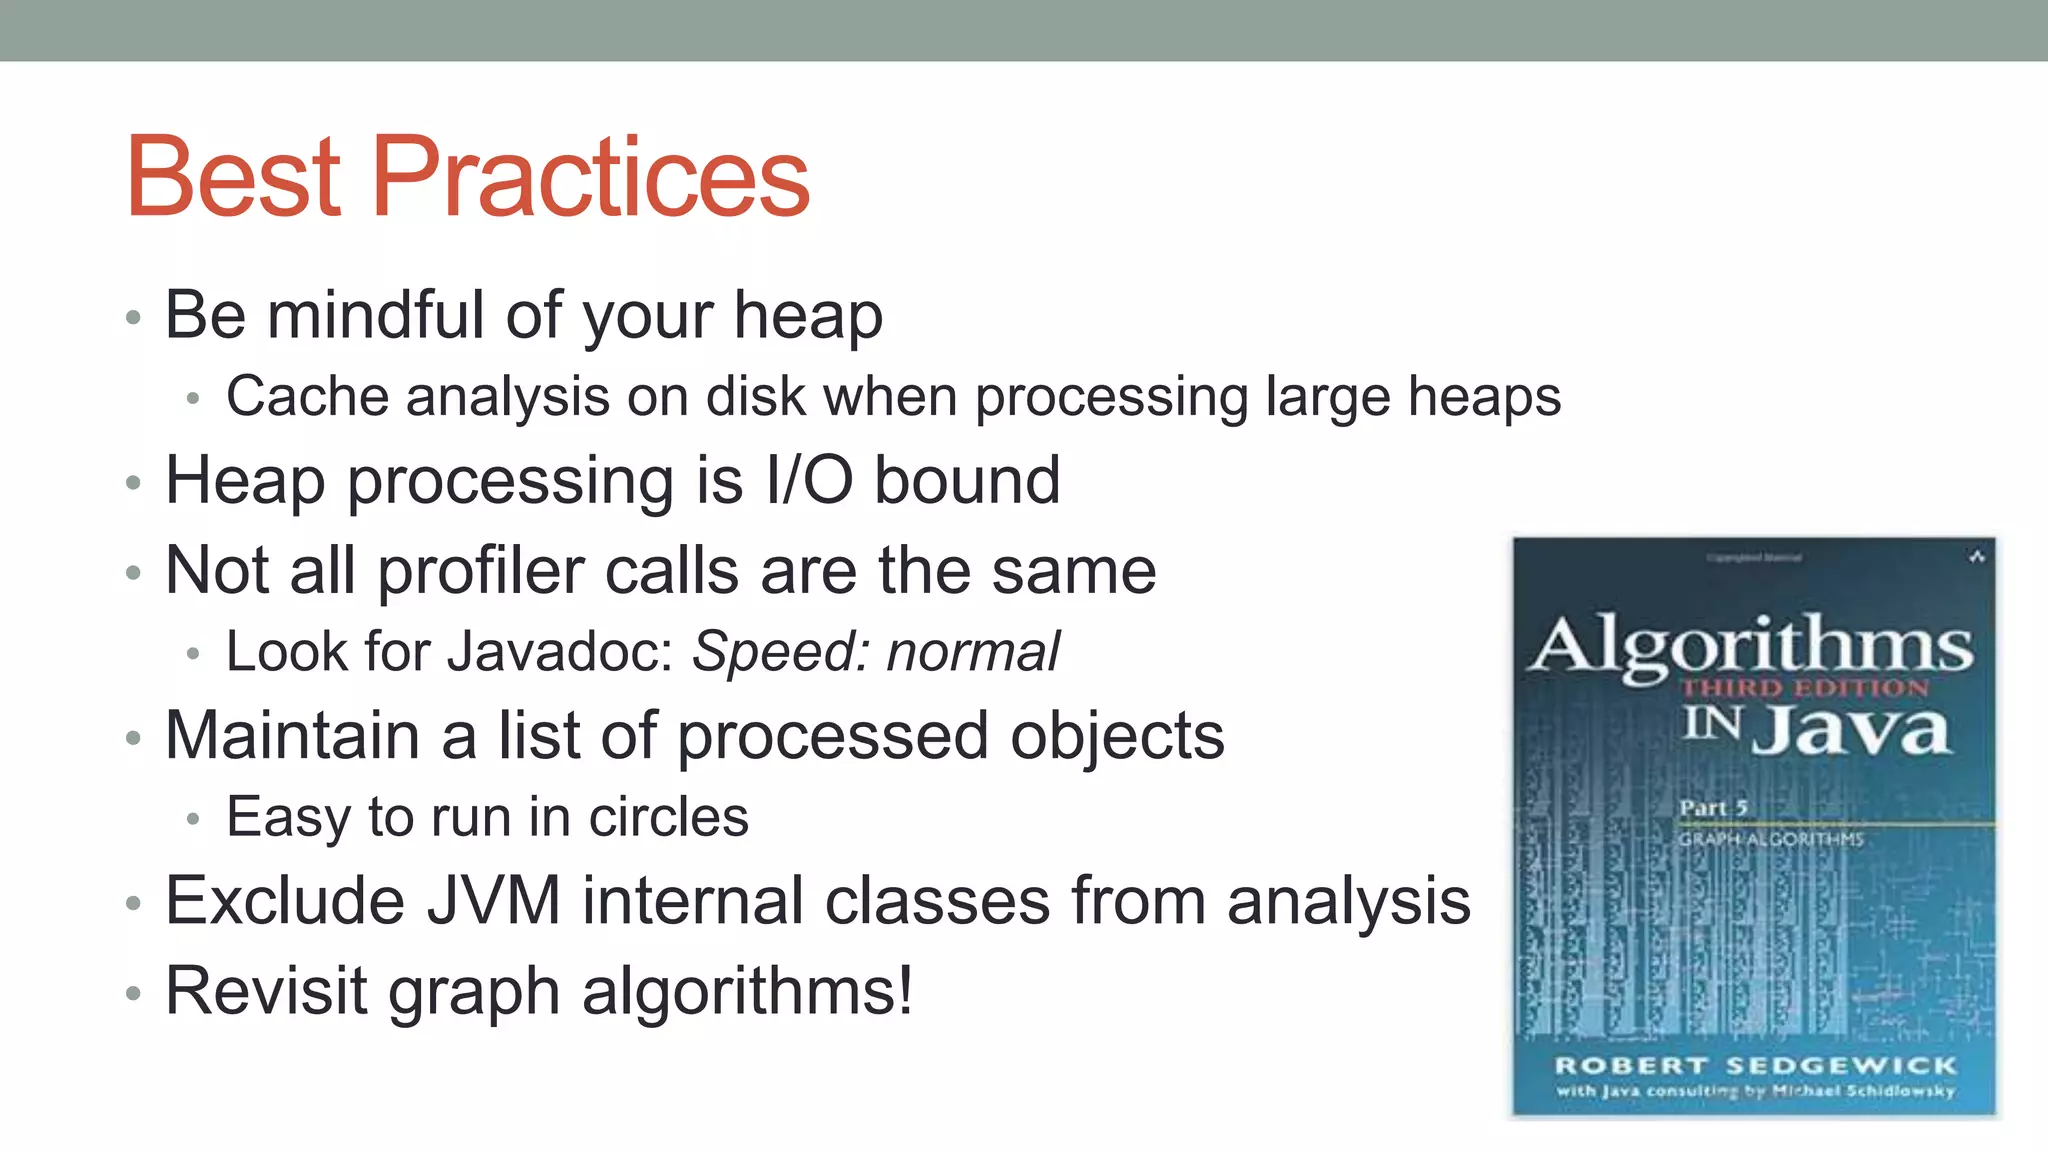

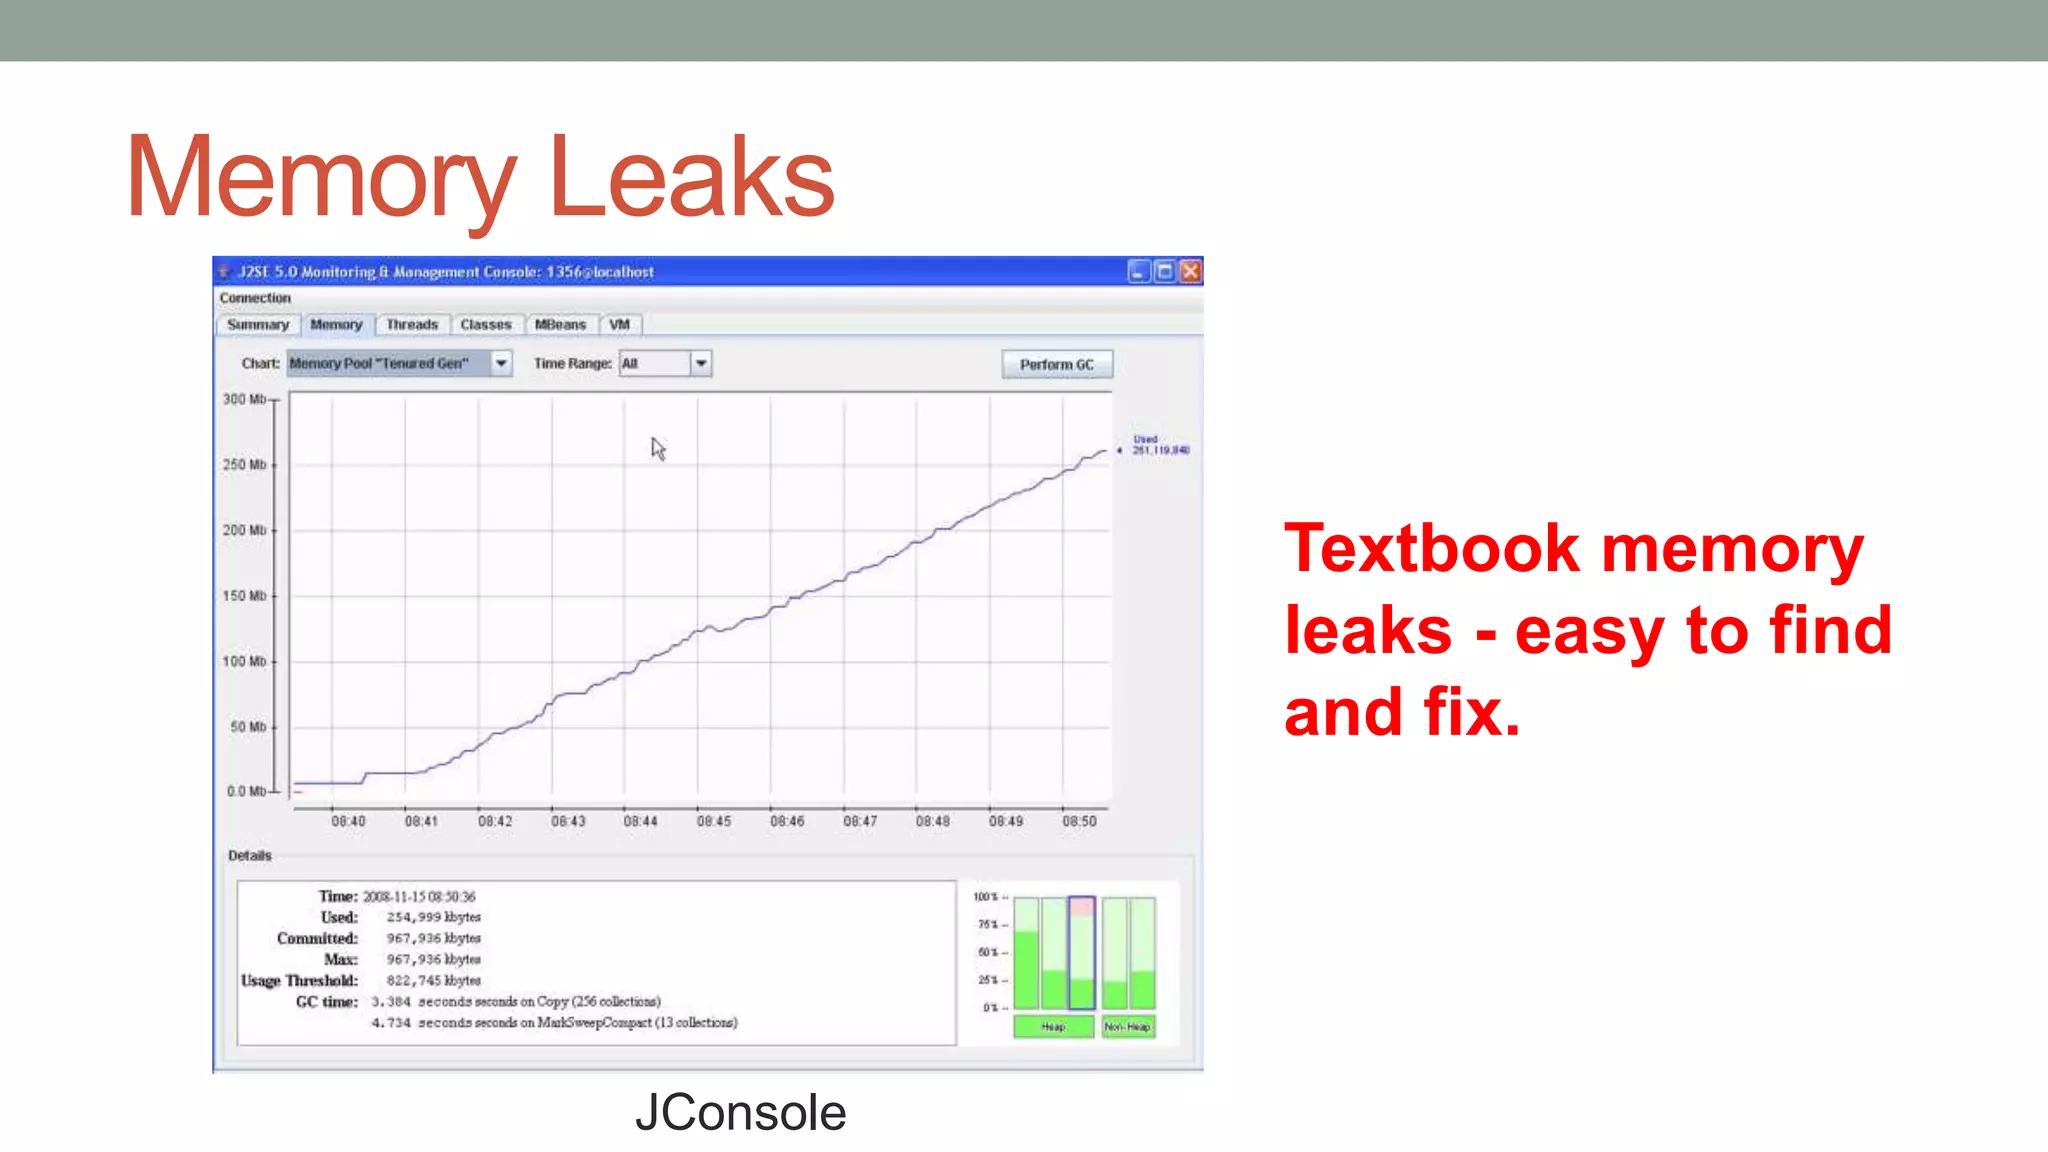
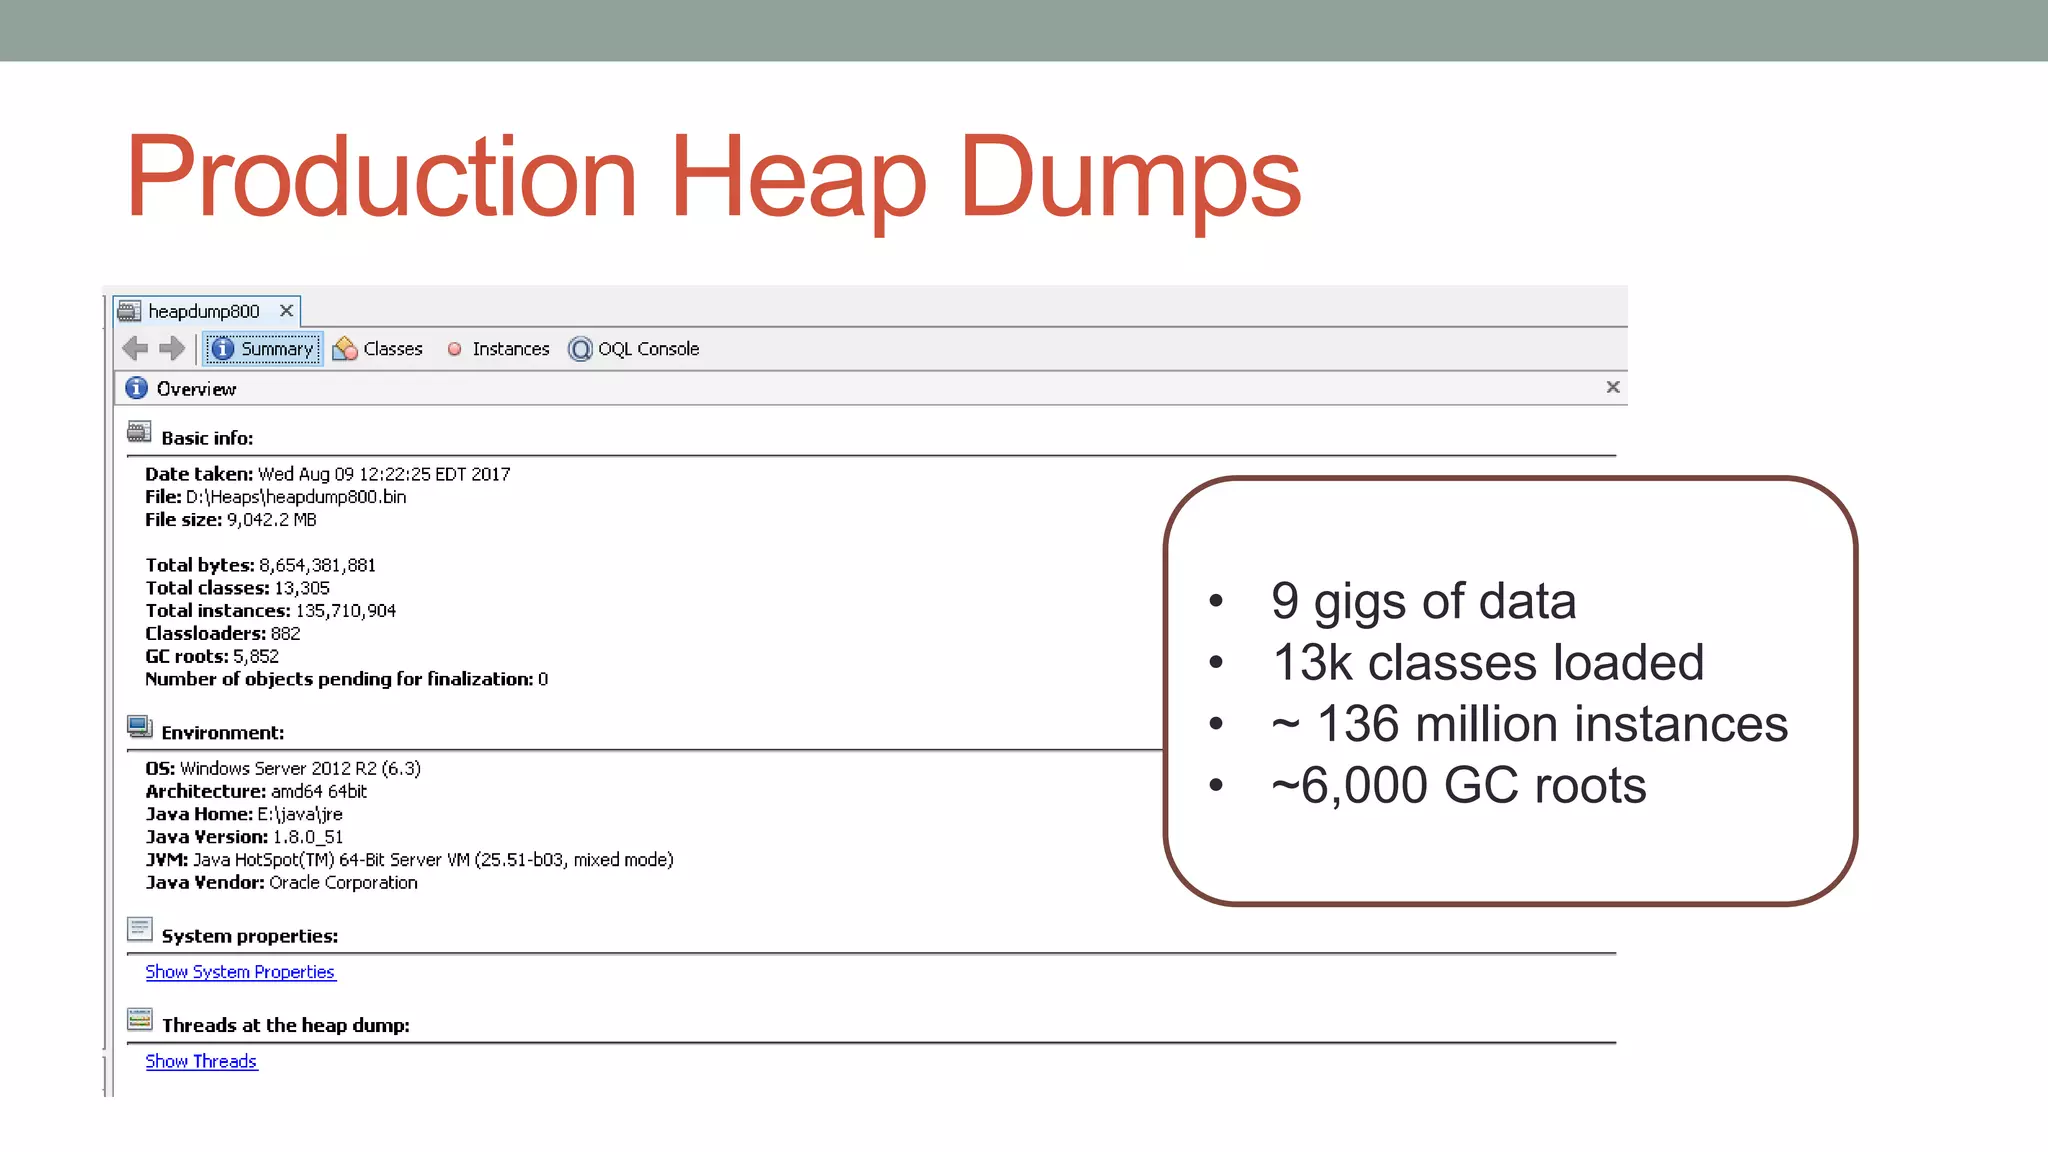
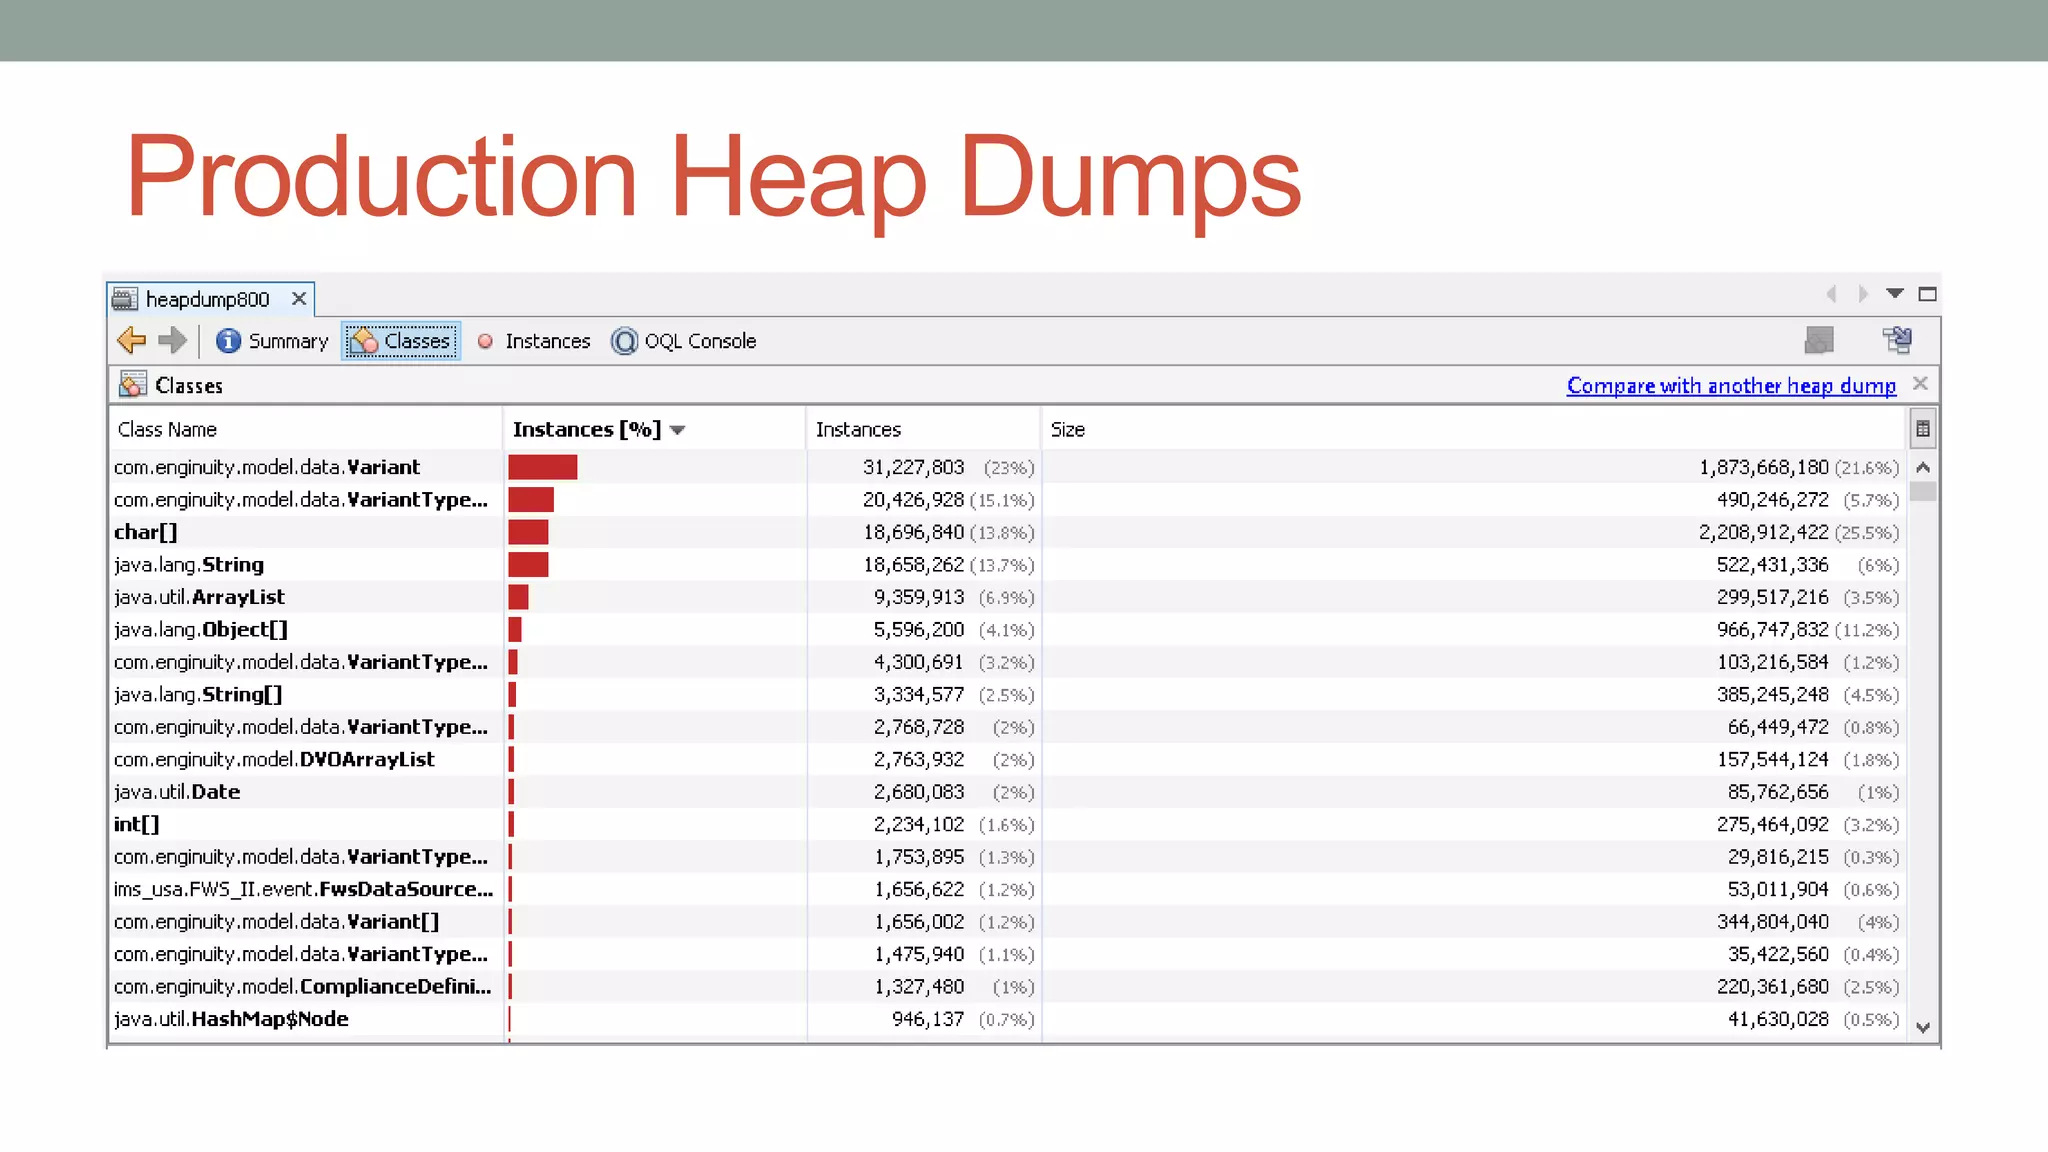
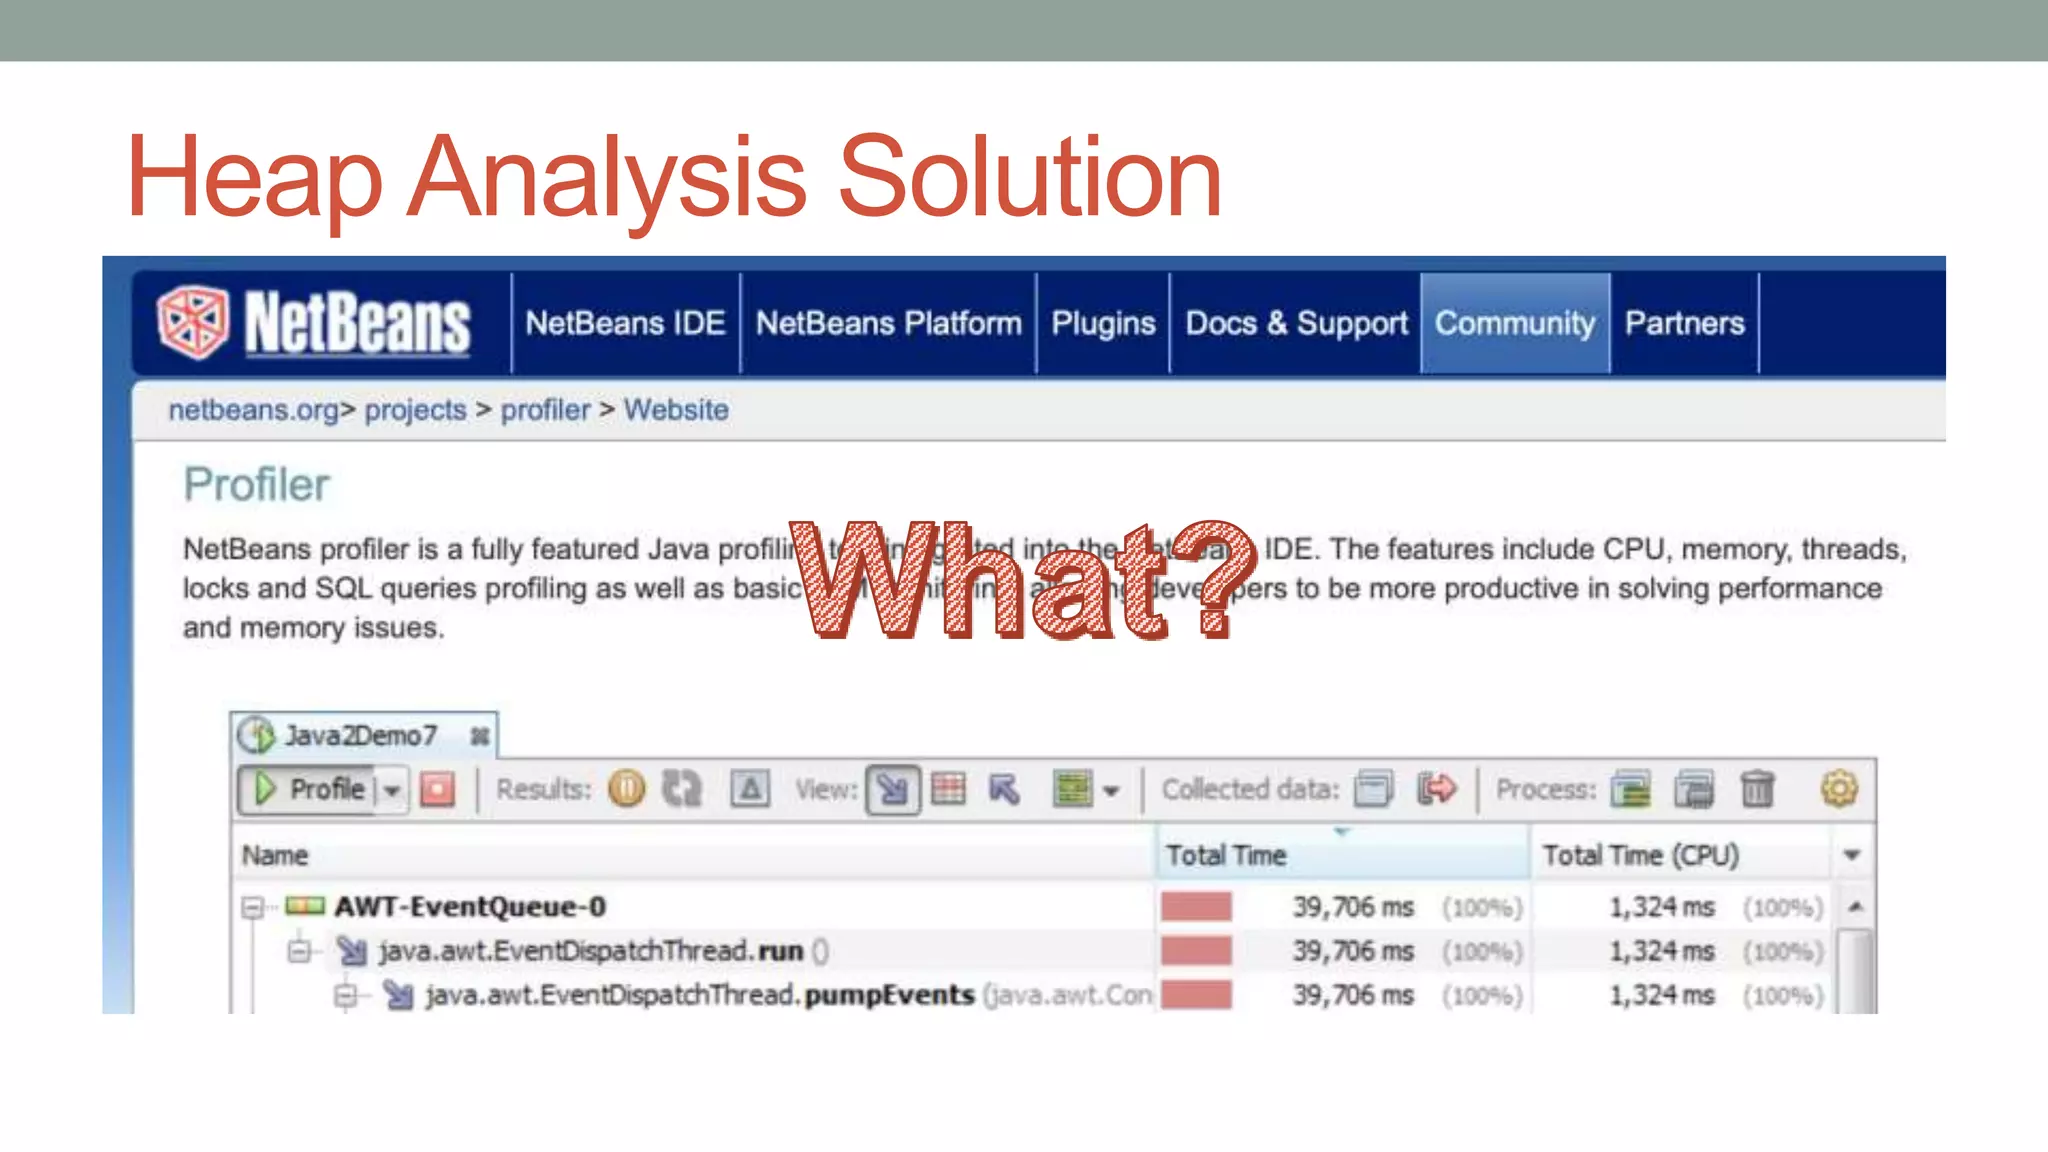
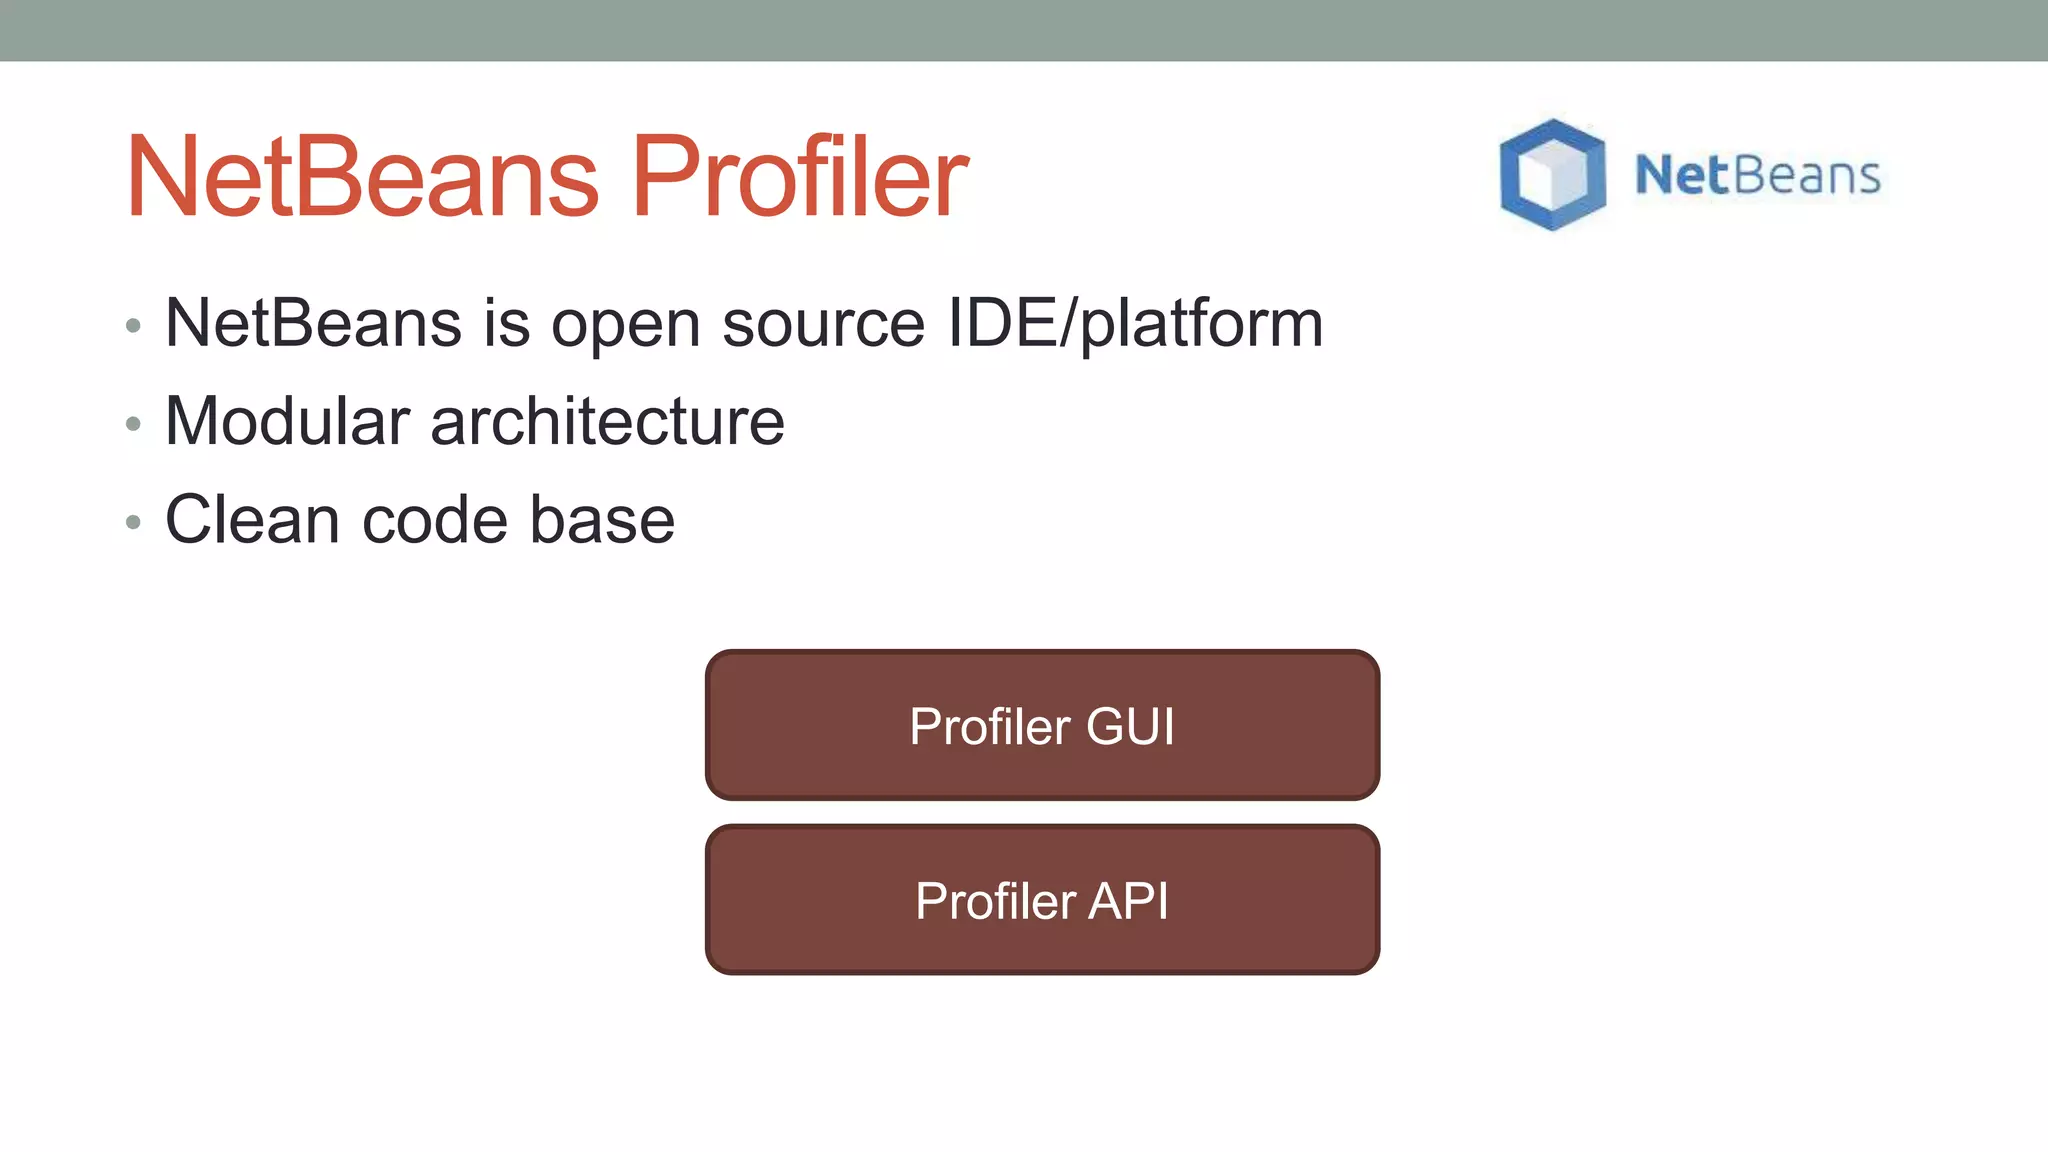
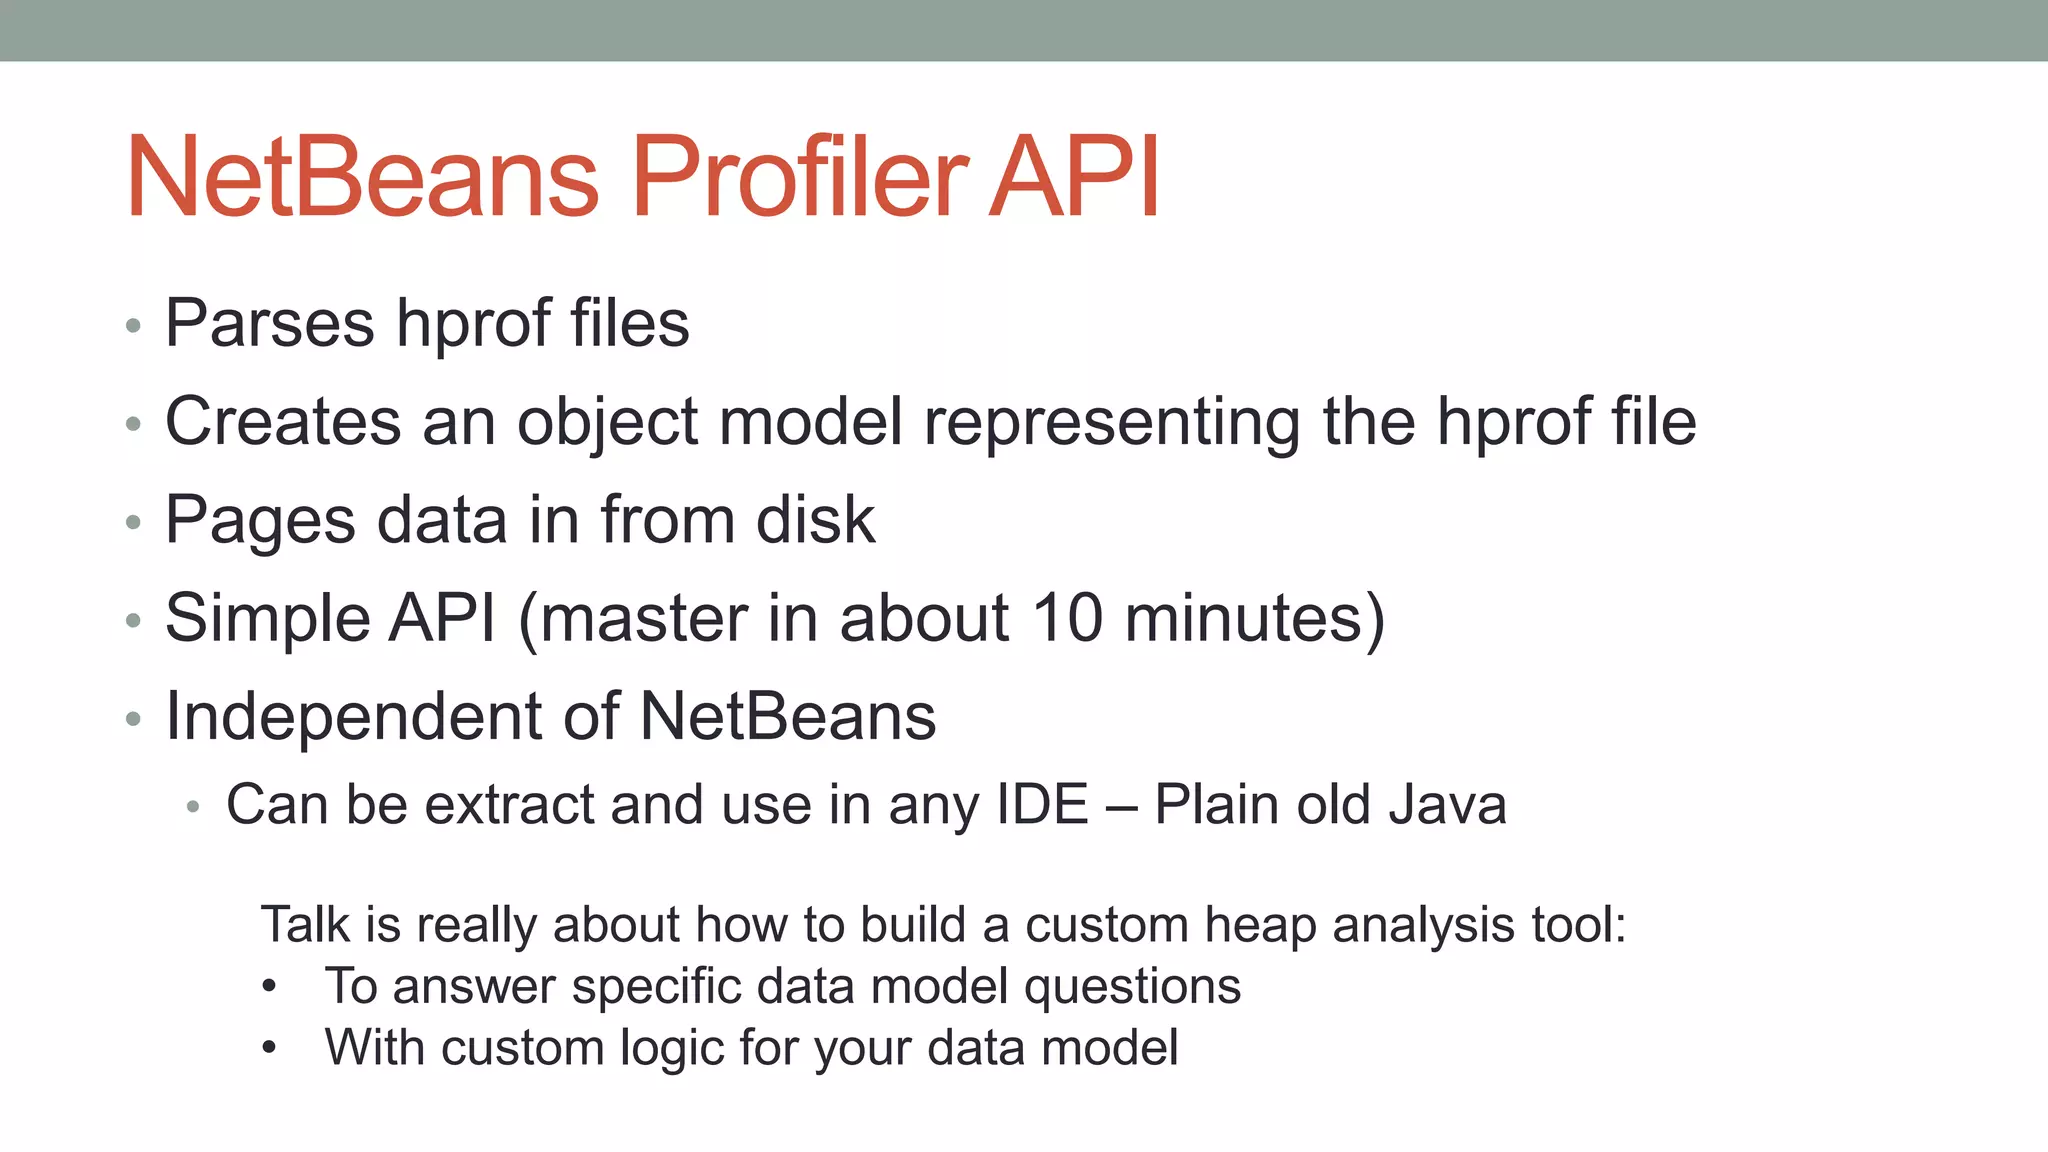
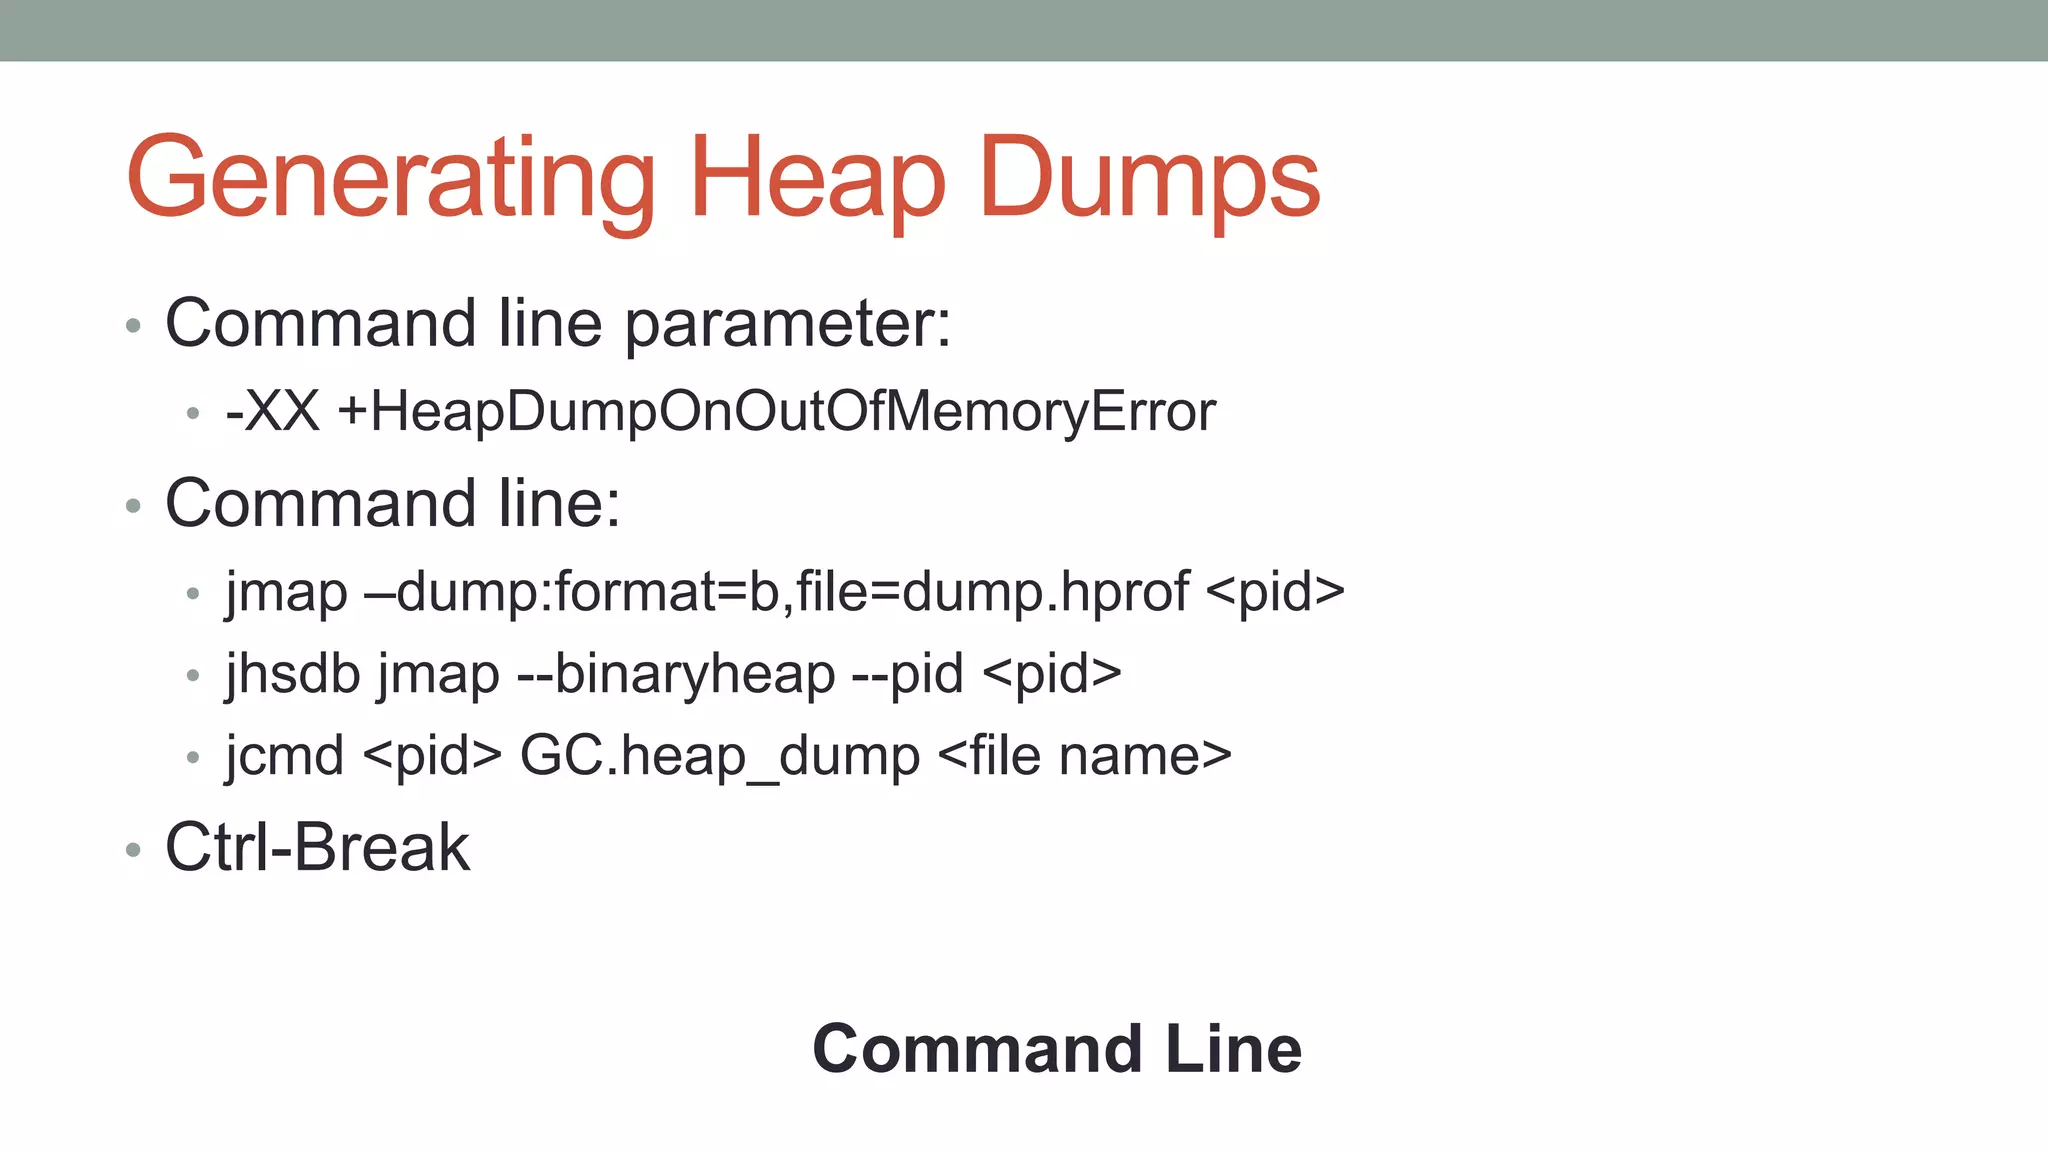
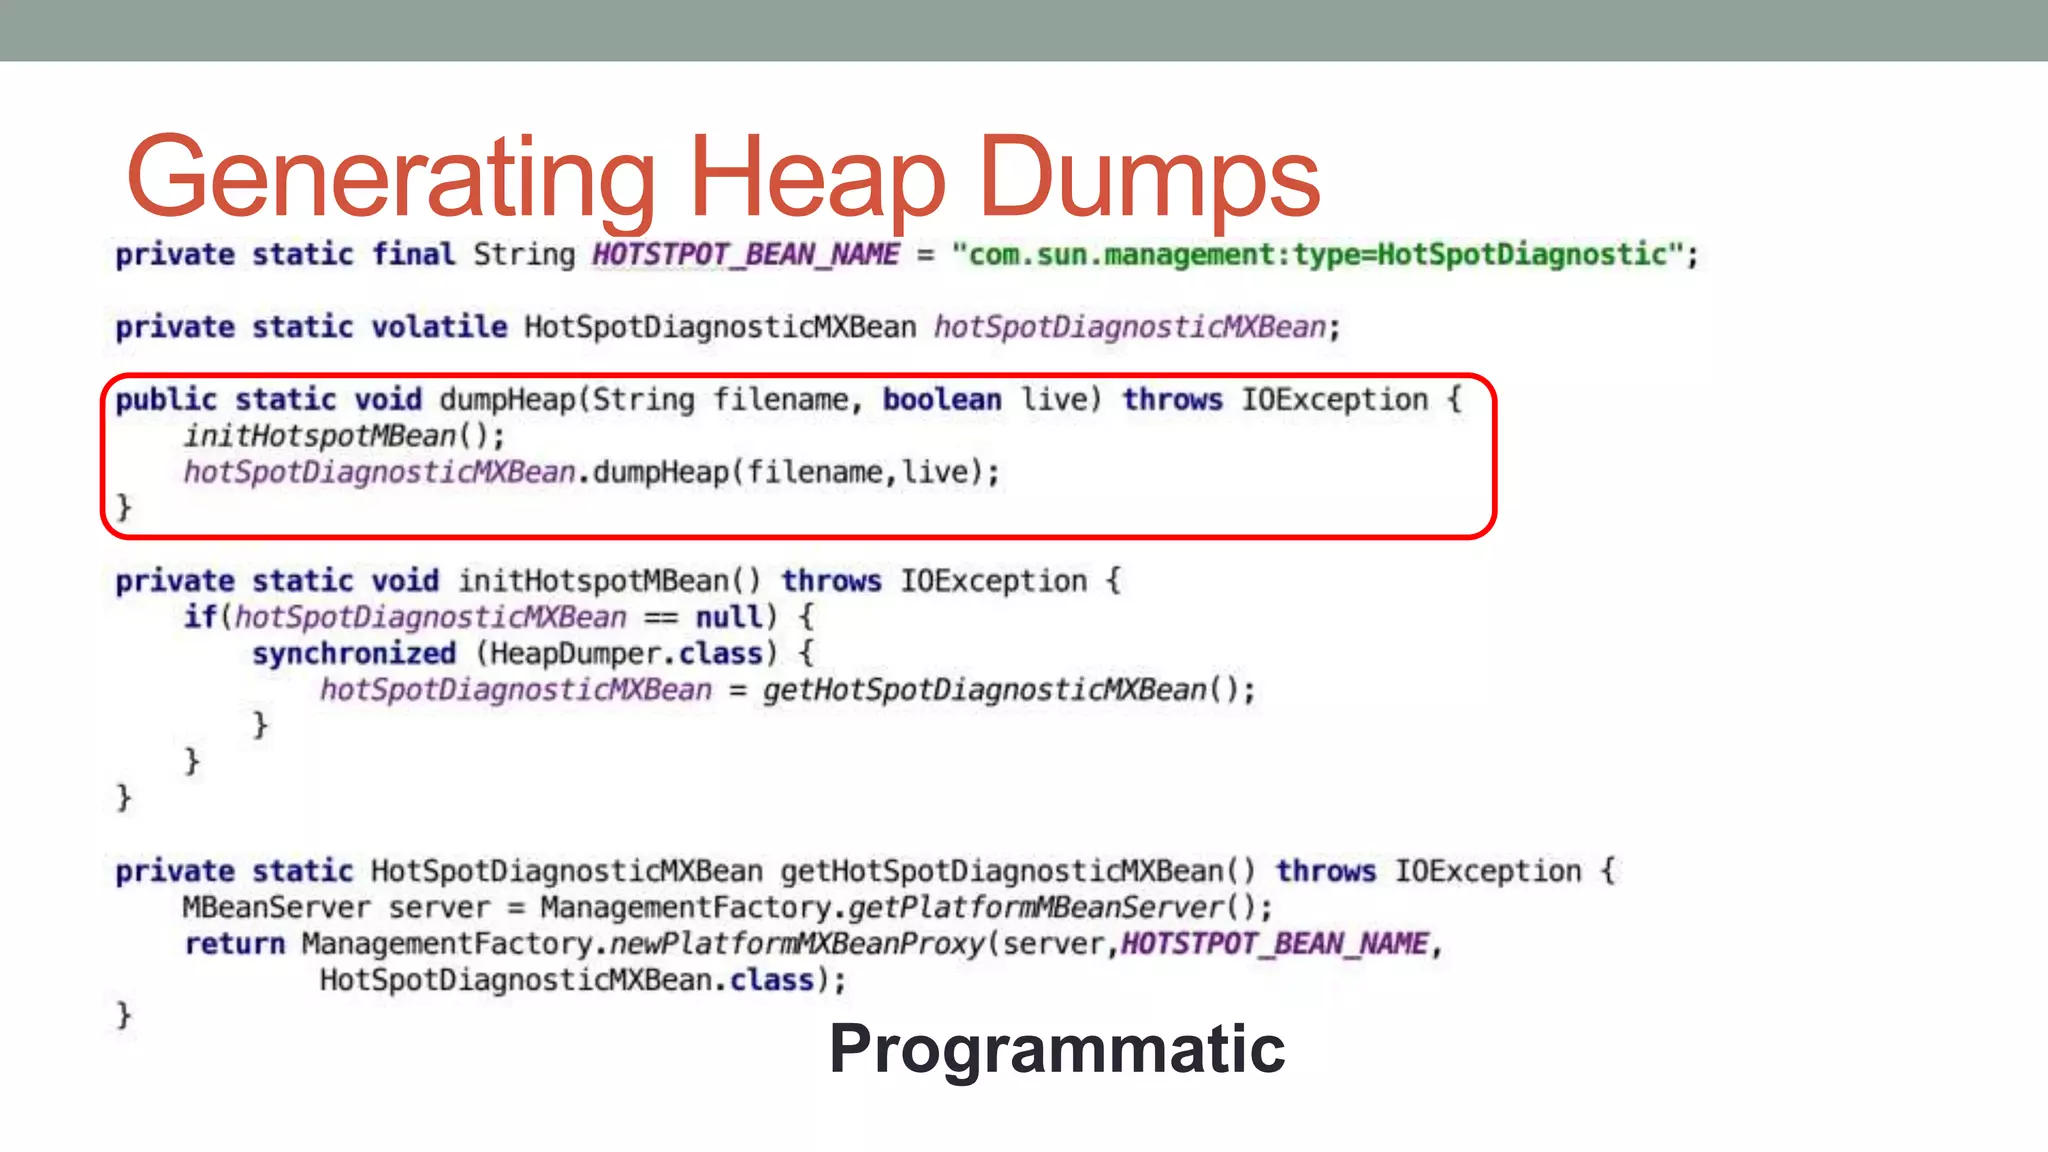
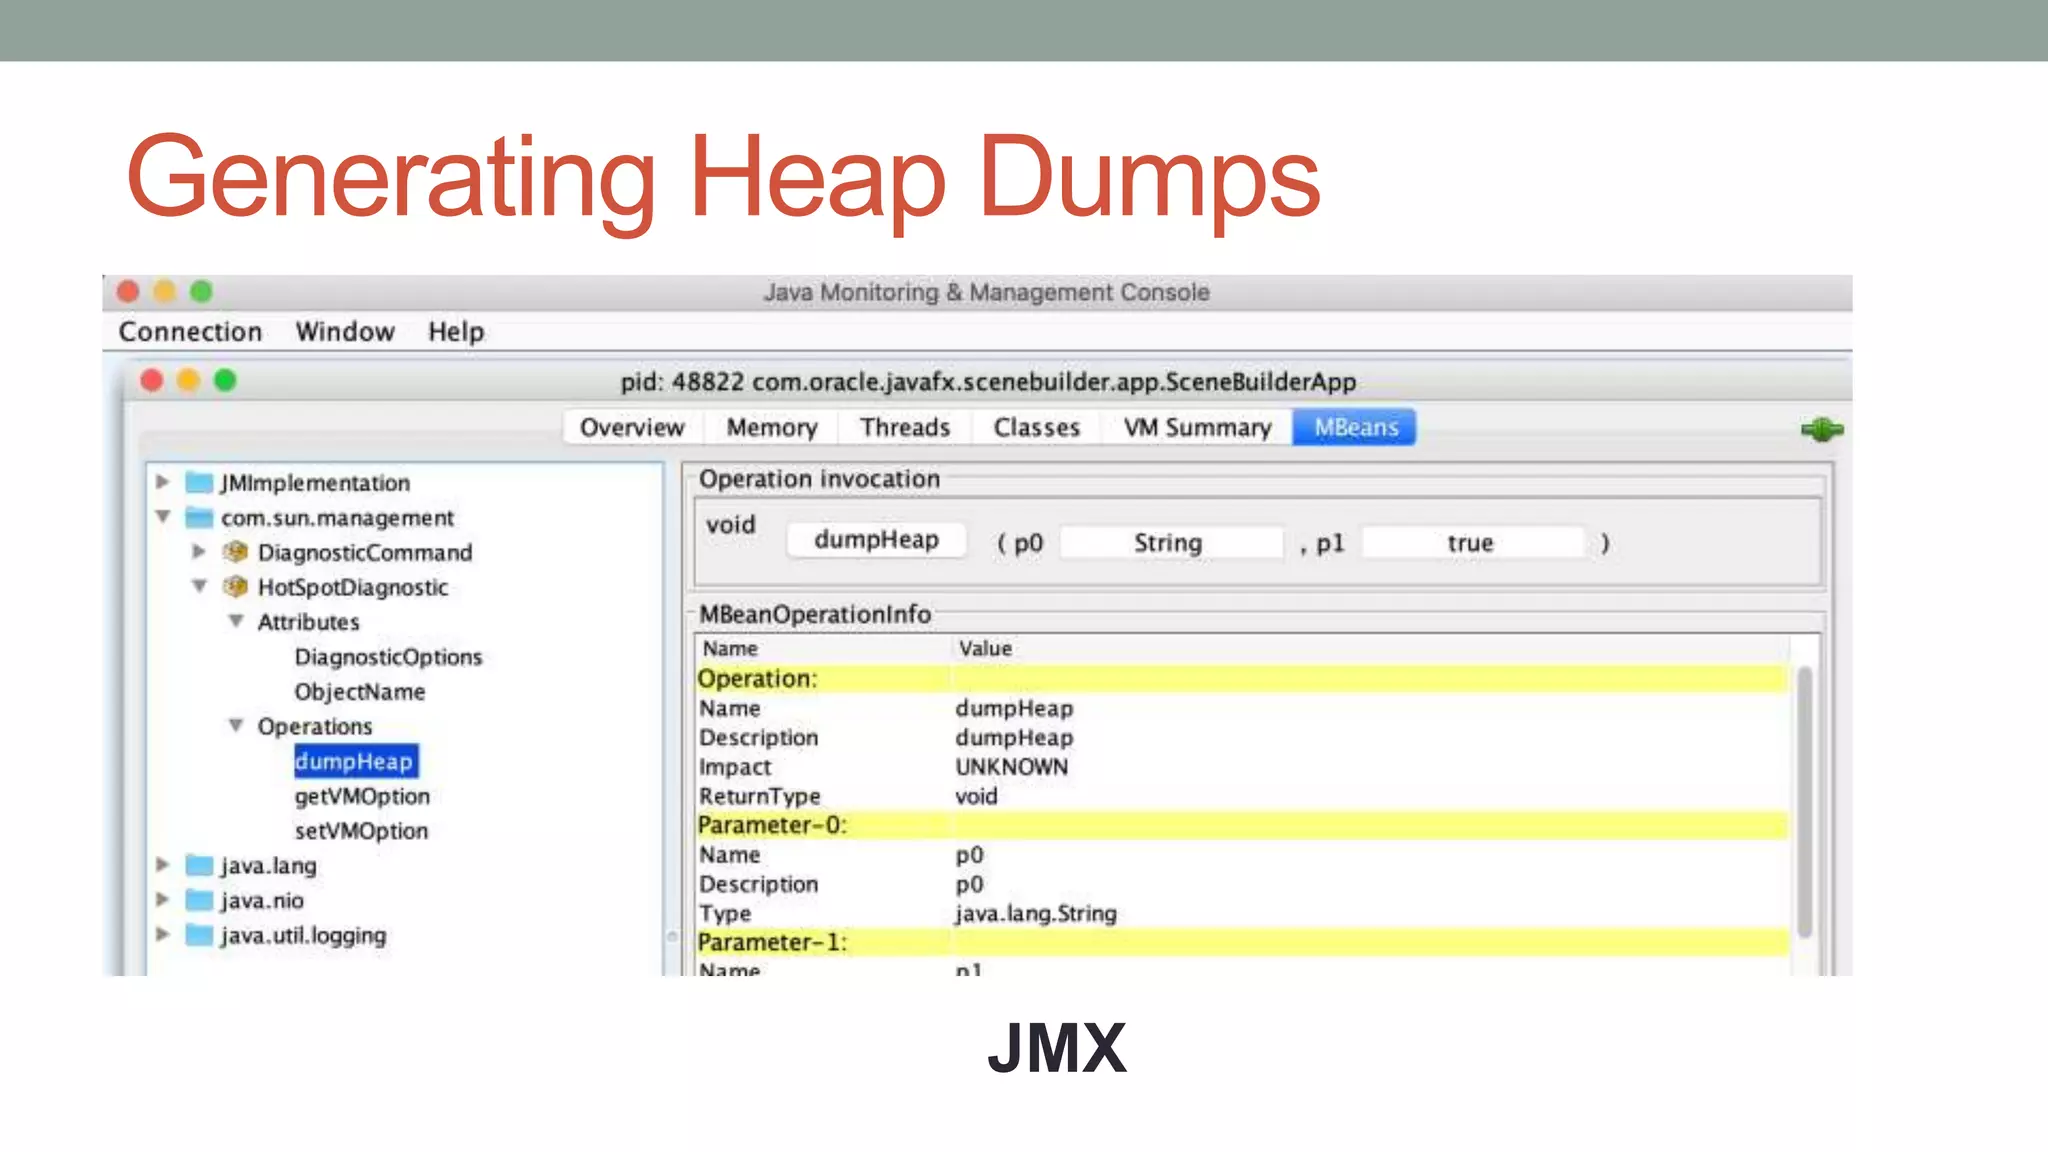
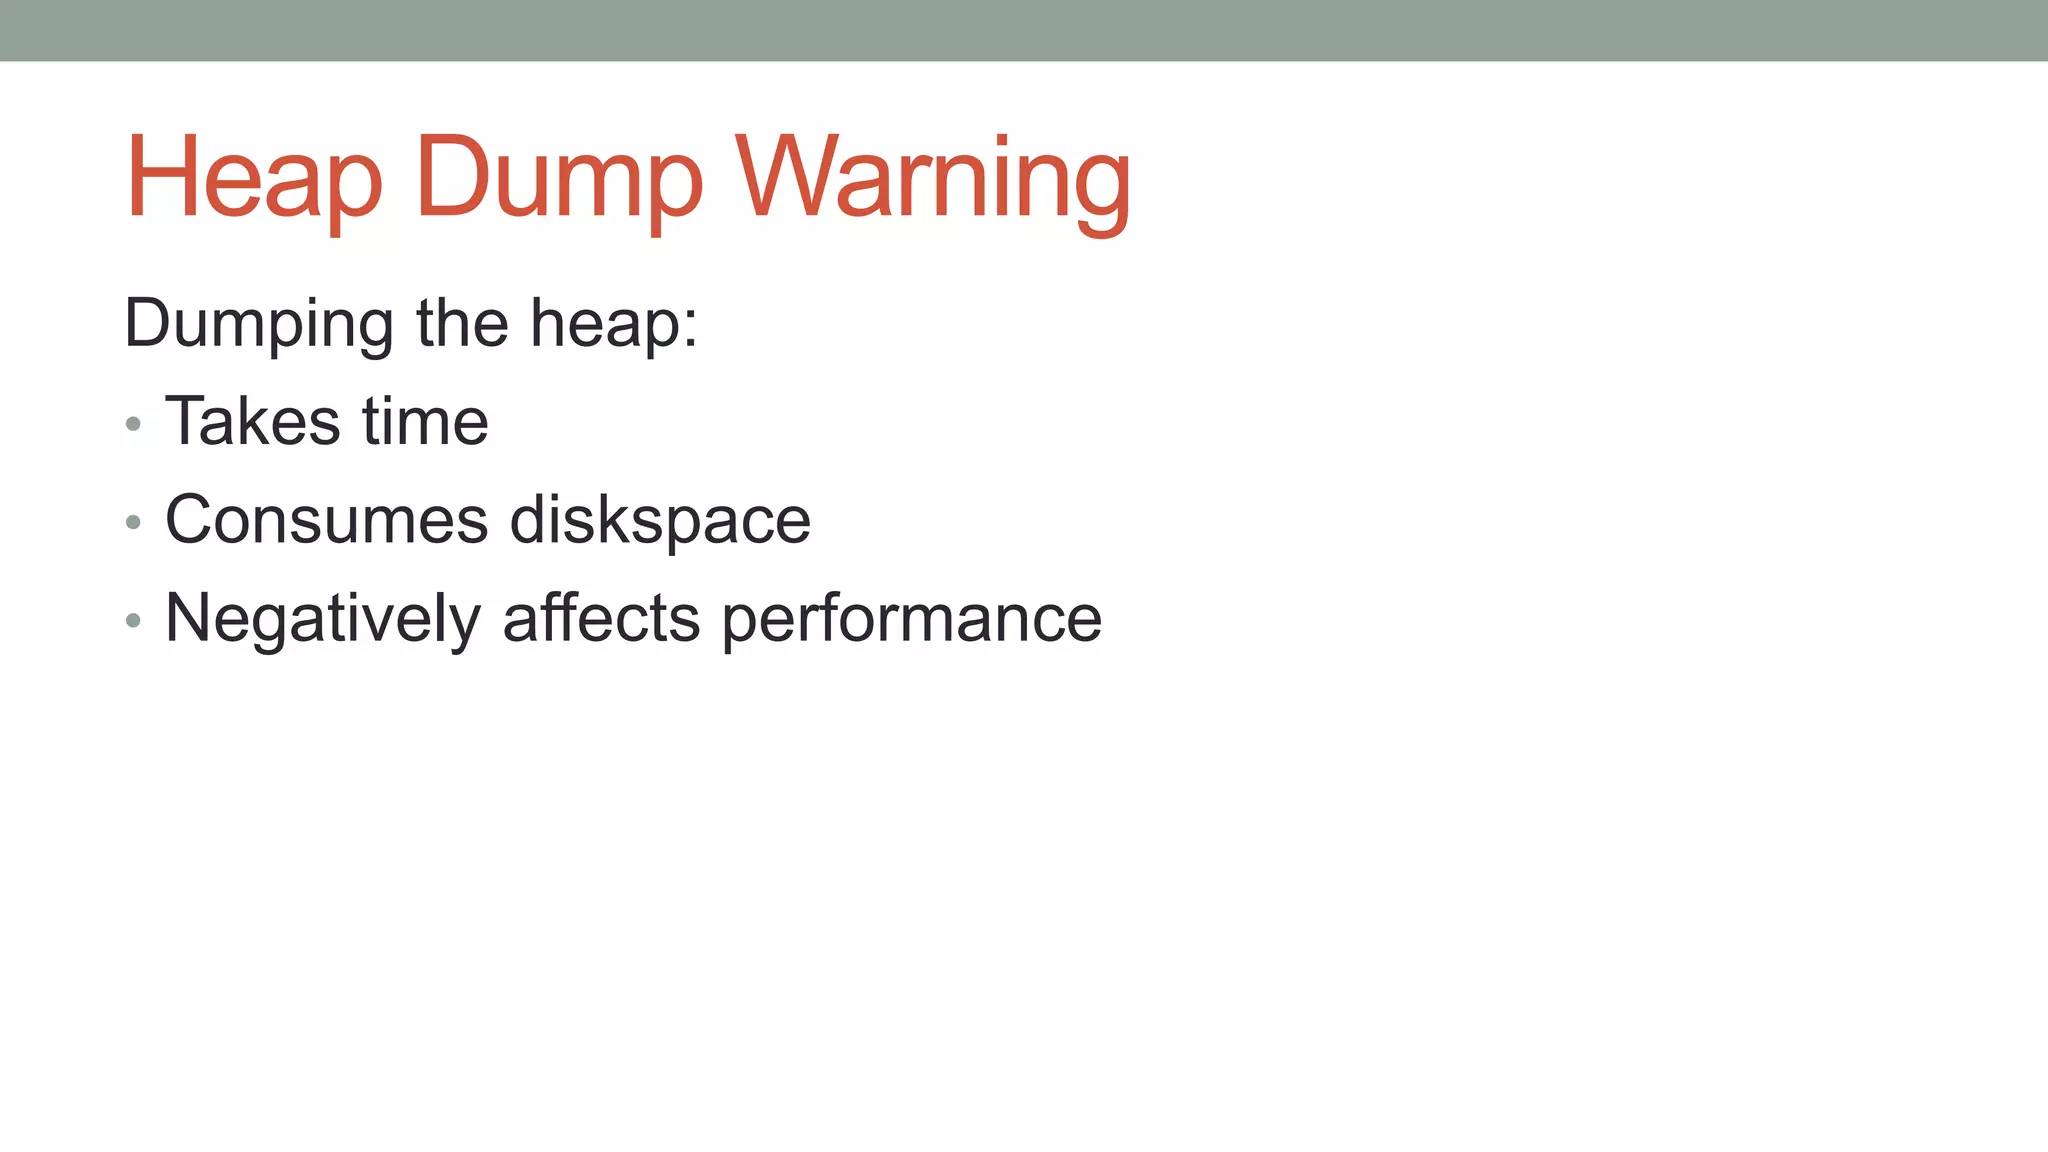
The document discusses Java heap dumps, highlighting their role in memory analysis, specifically addressing issues such as memory leaks and excessive garbage collection in applications. It also explores the tools and techniques for generating, analyzing, and interpreting heap dumps, including the use of the NetBeans profiler and Object Query Language (OQL). Best practices for heap analysis are provided, emphasizing the importance of managing memory and identifying data model errors effectively.