Downloaded 12 times
![International Journal on Cybernetics & Informatics (IJCI) Vol. 3, No. 2, April 2014 DOI: 10.5121/ijci.2014.3202 11 EVALUATION OF NETWORK INTRUSION DETECTION USING MARKOV CHAIN S.Brindasri 1 and K.Saravanan 2 1 M.E(CSE), Department of Computer Engineering, Erode Sengunthar Engineering college, Anna University(Chennai) 2 Assistant Professor, Department of Computer Engineering, Erode Sengunthar Engineering college, Anna University(Chennai) ABSTRACT Day today life internet threat has been increased significantly. There is a need to develop model in order to maintain security of system. The most effective techniques are Intrusion Detection System (IDS).The purpose of intrusion system through the security devices detect and deal with it. In this paper, a mathematical approach is used effectively to predict and detect intrusion in the network. Here we discuss about two algorithms ‘K-Means + Apriori’, a method which classify normal and abnormal activities in computer network. In K-Means process, it partitions the training set into K-clusters using Euclidean distance and introduce an outlier factor, then it build Apriori Algorithm to prune the data by removing infrequent data in the database. Based on defined state the degree of incoming data is evaluated through the experiment using sample DARPA2000 dataset, and achieves high detection performance in level of attack in stages. KEYWORDS Anomaly detection, K-Mean Algorithm, Apriori Algorithm, Data Prune, Data Clustering, Markovian chain 1. INTRODUCTION Now a day’s potential damage caused by internet attack has increased exponentially, so the need for defending against these issues has increased significantly. [9] Conventional techniques for preventing threats such as firewalls, access control schemes or encryption methods are not much efficient for securing the network system from new born attacks. [1] The intelligent intrusion detection system is a good solution for this issue and has become a critical component for all computer security. Intrusion detection is to analyses the data gained by network action, security log, audit data or other networks in order to detect and identify any invading action and purpose against security strategy during network and computer systems.[15] Intrusion was first introduced by James P. Anderson. It violates the security policy of system. The security policy is confidentiality, integrity, availability and Utility [11]. IDS are used to identify, access, report unauthorized, unapproved network activities, so that it can take precaution to prevent any future damage to the system. As a safety protection work, intrusion detection can sound a warning before a system is endangered and real time respond to the attack, which greatly improves the security of networks. Intrusion detection method is divided into two types, misuse detection and anomaly detection. For misuse detection, the attack is present in signature form according to that it matches the attack in](https://image.slidesharecdn.com/evaluationofnetworkintrusiondetectionusingmarkovchain-140508022009-phpapp02/75/Evaluation-of-network-intrusion-detection-using-markov-chain-1-2048.jpg)
![International Journal on Cybernetics & Informatics (IJCI) Vol. 3, No. 2, April 2014 12 the database. It is accurate and fast for the known intrusion behaviour but hard to identify the intrusion behaviour except signature database. [4][11] While for anomaly detection, the normal model of network behaviours will be firstly created, then the occurrence can be judge by comparing the actual behaviour with it, which can detect the unknown intrusion behaviour [3]. Intrusions Detection is broadly classified into two categories. They are Host Based Intrusion detection system and Network Based Intrusion Detection system. In Host Based Intrusion Detection system (HIDS) evaluates information found on a single or multiple systems. Network Based Intrusion Detection system (NIDS) evaluates data captured from network states, analyzing packets which travel across the network [9]. Data set used is DARPA2000 dataset, which contains both normal and attack data. There are contains 41 features for detecting intrusion.[10] Types of attack are, Denial of Service (DoS) attacks, the attacker makes memory resource too busy, thus denying legitimate users access to a machine. A probe attack, an attacker scans a network to gather data to find known vulnerabilities in the system. Remote-to-Local (R2L) attacks, where an attacker sends packets to a machine via network, then exploits machines vulnerability to illegally gain local access as a user. [5] A user- to-Root (U2R) attack, attacker used to access like a normal user on the system and thus exploits vulnerability to the system. [14] For example, In July 2010, more number of internet services was shutdown so that it can’t able to access any of the services in Korea due to the denial of service attack. They came to know after the attack encountered and after identifying the take they taken a step to avoid that attack. So, a new mechanism is used to forecast states of the network and detects the possibility of an attack in the system. The experimental results show that the proposed approach achieves high detection performance in the level of threats in stages. This paper is organized as follows: In section 2 it discussed with the related work of my paper. In section 3 and 4 it explain about the two algorithm k-Means and Apriori. Section 5 explains about the proposed work and its performance metrics. In section 6 gives a conclusion. 2. RELATED WORK In Intrusion detection various probabilistic techniques is used, decision tree, Hotel ling’s T2 test, chi-square multivariate test, and Markov chain are applied to the same training set and the same testing set of computer audit data for investigating the frequency property and the ordering property of computer audit data. The study [2] provides response to several questions concerning which properties are critical to intrusion detection. Here the frequency property of multiple audit event types in a sequence of events is necessary for intrusion detection. A single audit event at a given time is not sufficient for intrusion detection. The ordering property of multiple audit events provides profit to the frequency property for intrusion detection. However, the scalability problem of complex data models taking into account the ordering property of activity data is solved; intrusion detection techniques based on the frequency property provide a viable solution that produces good intrusion detection performance with low computational overhead. Rahul Rastogi et.al proposed about the intrusion detection system, which discussed about the data mining techniques. [13] Data mining techniques is applied to the network data to detect intrusions. The foremost step in application of data mining techniques is the selection of appropriate features from the data. Intrusion Detection System that can detect known and unknown intrusion automatically. Under a data mining framework, the IDS are trained with statistical algorithm, named Chi-Square statistics [5][8]. This study shows, implementation and analyze of these threats by using a Chi-Square statistic technique, in order to prevent attacks. This proposed model is used to detect anomaly-based detections by using data mining technique.](https://image.slidesharecdn.com/evaluationofnetworkintrusiondetectionusingmarkovchain-140508022009-phpapp02/75/Evaluation-of-network-intrusion-detection-using-markov-chain-2-2048.jpg)
![International Journal on Cybernetics & Informatics (IJCI) Vol. 3, No. 2, April 2014 13 First order Markov chain approach is used effectively to predict the attacks through experiments using the well-known DARPA 2000 dataset [2][6]. This approach achieves high detection performance and also represents the degree of risk on a probability scale. This method is shown to be insensitive to variations of training data sets and the number of states in the Markov model. The proposed approach is expected to be effectively integrated with the existing network based intrusion detection systems for earlier detection for attacks. Markov chain was implemented and tested on the Sun Solaris system [1]. By using this method it clearly distinguished intrusive activities from normal activities in the testing data. This study shows the performance of the intrusion detection technique based on the Markov method. The application of the intrusion detection technique using a Markov model is not limited to the temporal behaviour of a host machine it also used in network domain. Compared to supervised approaches, unsupervised approach breaks the dependency on attack-free training datasets [4]. The unsupervised anomaly detection achieve higher detection rate compared to supervised process. It contain high false positive rate. In unsupervised anomaly detection techniques, it is processed with unlabeled data and it is capable of detecting previous unknown attacks. 3. IDS USING K-MEANS ALGORITHM K-Means is an unsupervised algorithm it define the unlabelled class to which the cluster is performed. [7][12] The main objective is to define k centres, for each centre group of cluster is formed. These centres should be placed in a cunning way because of different location causes different result. Normal data is taken as input for K-means Clustering. The number of cluster is initially set as 10. The distances between each data and the cluster centres are calculated using distance metrics. The data belongs to the cluster whose distance between them is minimum, compared to the remaining cluster centre. Updated the cluster centre values then and there new data enters the cluster. The number clusters are varied for different number of iterations; finally we achieved the best values with eight clusters with nine iterations. Fig 1 shows set of objects is been clustered to given centroid points. [15] According to the similarity it groups the data different data it marks as outlying state. Table 1 shows the working principle of K-Means, [9] initially from k objects is taken from the given data then according to the cluster it cluster the data by using the mean value. It repeat the process until no change occur then stop the process. Procedure K-Means Step 1: Choose k objects from D as the initial cluster centres Step 2: Assign each object to the cluster according to the mean value of the objects in the cluster. Step 3: Update the cluster means, i.e., calculate the mean value of the objects for each cluster. Step 4: Until no change Table 1: K-Mean algorithm](https://image.slidesharecdn.com/evaluationofnetworkintrusiondetectionusingmarkovchain-140508022009-phpapp02/75/Evaluation-of-network-intrusion-detection-using-markov-chain-3-2048.jpg)
![International Journal on Cybernetics & Informatics (IJCI) Vol. 3, No. 2, April 2014 14 Fig 1 set of objects is cluster by using k-means method 4. IDS USING ARIORI ALGORITHM Apriori is an iterative approach known as a level-wise search [3][4], it consists of two steps join step and prune step it used to join the data from transactional database and from that it prune the data when it does not satisfy the minimum threshold value it defines the infrequent data so it removes from the database reduce the size of the data. In Table 2 defines where k-item sets are used to explore (k+1) item sets. The 1- frequent item sets is created by scanning the transactional database to count for each item, and then it process to the minimum support count value. When it does not satisfy the minimum support count it will remove from the database so that it can able to reduce the space and it can be easily find the most frequent item. Procedure Apriori 1 L1= large 1 item set 2 K= 2 3 While Lk-1 ≠ⱷ do 4 Begin 5 Ck= Apriori gen(Lk-1) 6 For all transaction t in D do 7 Begin 8 Ct= subset (Ck,t) 9 For all candidates C £ Ct do 10 C.count= C.count +1 11 End 2nd pruning step 12 Lk={C £ Ck ļ C.count ≥ minsup} 13 K = k+1 14 End Apriori gen(LK-1) 15 Ck=ⱷ 16 For all item sets x £ Lk-1 and y £ Lk-1 do 17 If x1= y1 ᴧ..ᴧ* k-2= yk-2ᴧ xk-1<yk-1 then begin 18 C=x1x2..xk-1 yk-1 19 Add C to Ck 20 End 1st pruning step 21 delete candidate item set Ck whose any subset not in Lk-1 Table 2: Procedure of Apriori Algorithm](https://image.slidesharecdn.com/evaluationofnetworkintrusiondetectionusingmarkovchain-140508022009-phpapp02/75/Evaluation-of-network-intrusion-detection-using-markov-chain-4-2048.jpg)
![International Journal on Cybernetics & Informatics (IJCI) Vol. 3, No. 2, April 2014 15 The purpose of Apriori is used to search the data in the large database analyze and prune the data effectively then remove the irrelevant data. In Fig 2 shows the sample example of how Apriori works for a given data. It explains the generations of candidate item sets and frequent item sets, where the minimum support count is 2. TID Items c1 Item set Sup L1 Item set Sup 100 1 3 4 1) 2 1) 2 200 2 3 5 scan D 2) 3 2) 3 300 1 2 3 5 3) 3 3) 3 400 2 5 4) 1 5) 3 5) 3 L2 Item set Sup c2 Item set Sup c2 Item set {1 3} 2 {1 2} 1 {1 2} {2 3} 2 {1 3} 2 scan D {1 3} {2 5} 3 {1 5} 1 {1 5} {3 5} 2 {2 3} 2 {2 3} {2 5} 3 {2 5} {3 5} 2 {3 5} c3 Item set L3 Item set sup {2 3 5} scan D {2 3 5} 2 Fig 2 Example using Apriori Algorithm 5. PROPOSED WORK In this section, a novel Work is developed which uses a Markov chain for the probabilistic modelling of network events. The main objective of the work is used to reduce the attack detection time and detect the presence of attack. It composed of three main phases: in the first phase, define the network states and then prune the data. Based on the prune state the Markov chain is applied[1]. In the third phase, the degree of attack is measured in three states and then compared with existing K-Means and proposed Apriori Algorithm in given sample data. Fig 3 is a flow chart of the proposed framework. It explain already trained data is taken, then Apriori Algorithm works by using its operation, prune by using minimum count then build Markov chain to find the detection of attacks in given sample 5.1. PHASE 1- DATA PRE-PROCESS AND PRUNE THE DATA In this phase, it collects the input request and finds the no of transaction in the input file. Then it separates the input request based on the states. It takes the three kinds of such as sender, receiver, progress state. Then it applies the apriori algorithm each states to identify the frequent occurrences. Fig 4.a shows the dataset preprocessing operations In Fig 4.b shows the Apriori Algorithm preparation. It creates next generation of candidate item set by using prior knowledge from the database where the candidate (k+1)-item sets from k-item sets. It generates candidate item sets by passing into two steps. The first pruning step depends on](https://image.slidesharecdn.com/evaluationofnetworkintrusiondetectionusingmarkovchain-140508022009-phpapp02/75/Evaluation-of-network-intrusion-detection-using-markov-chain-5-2048.jpg)
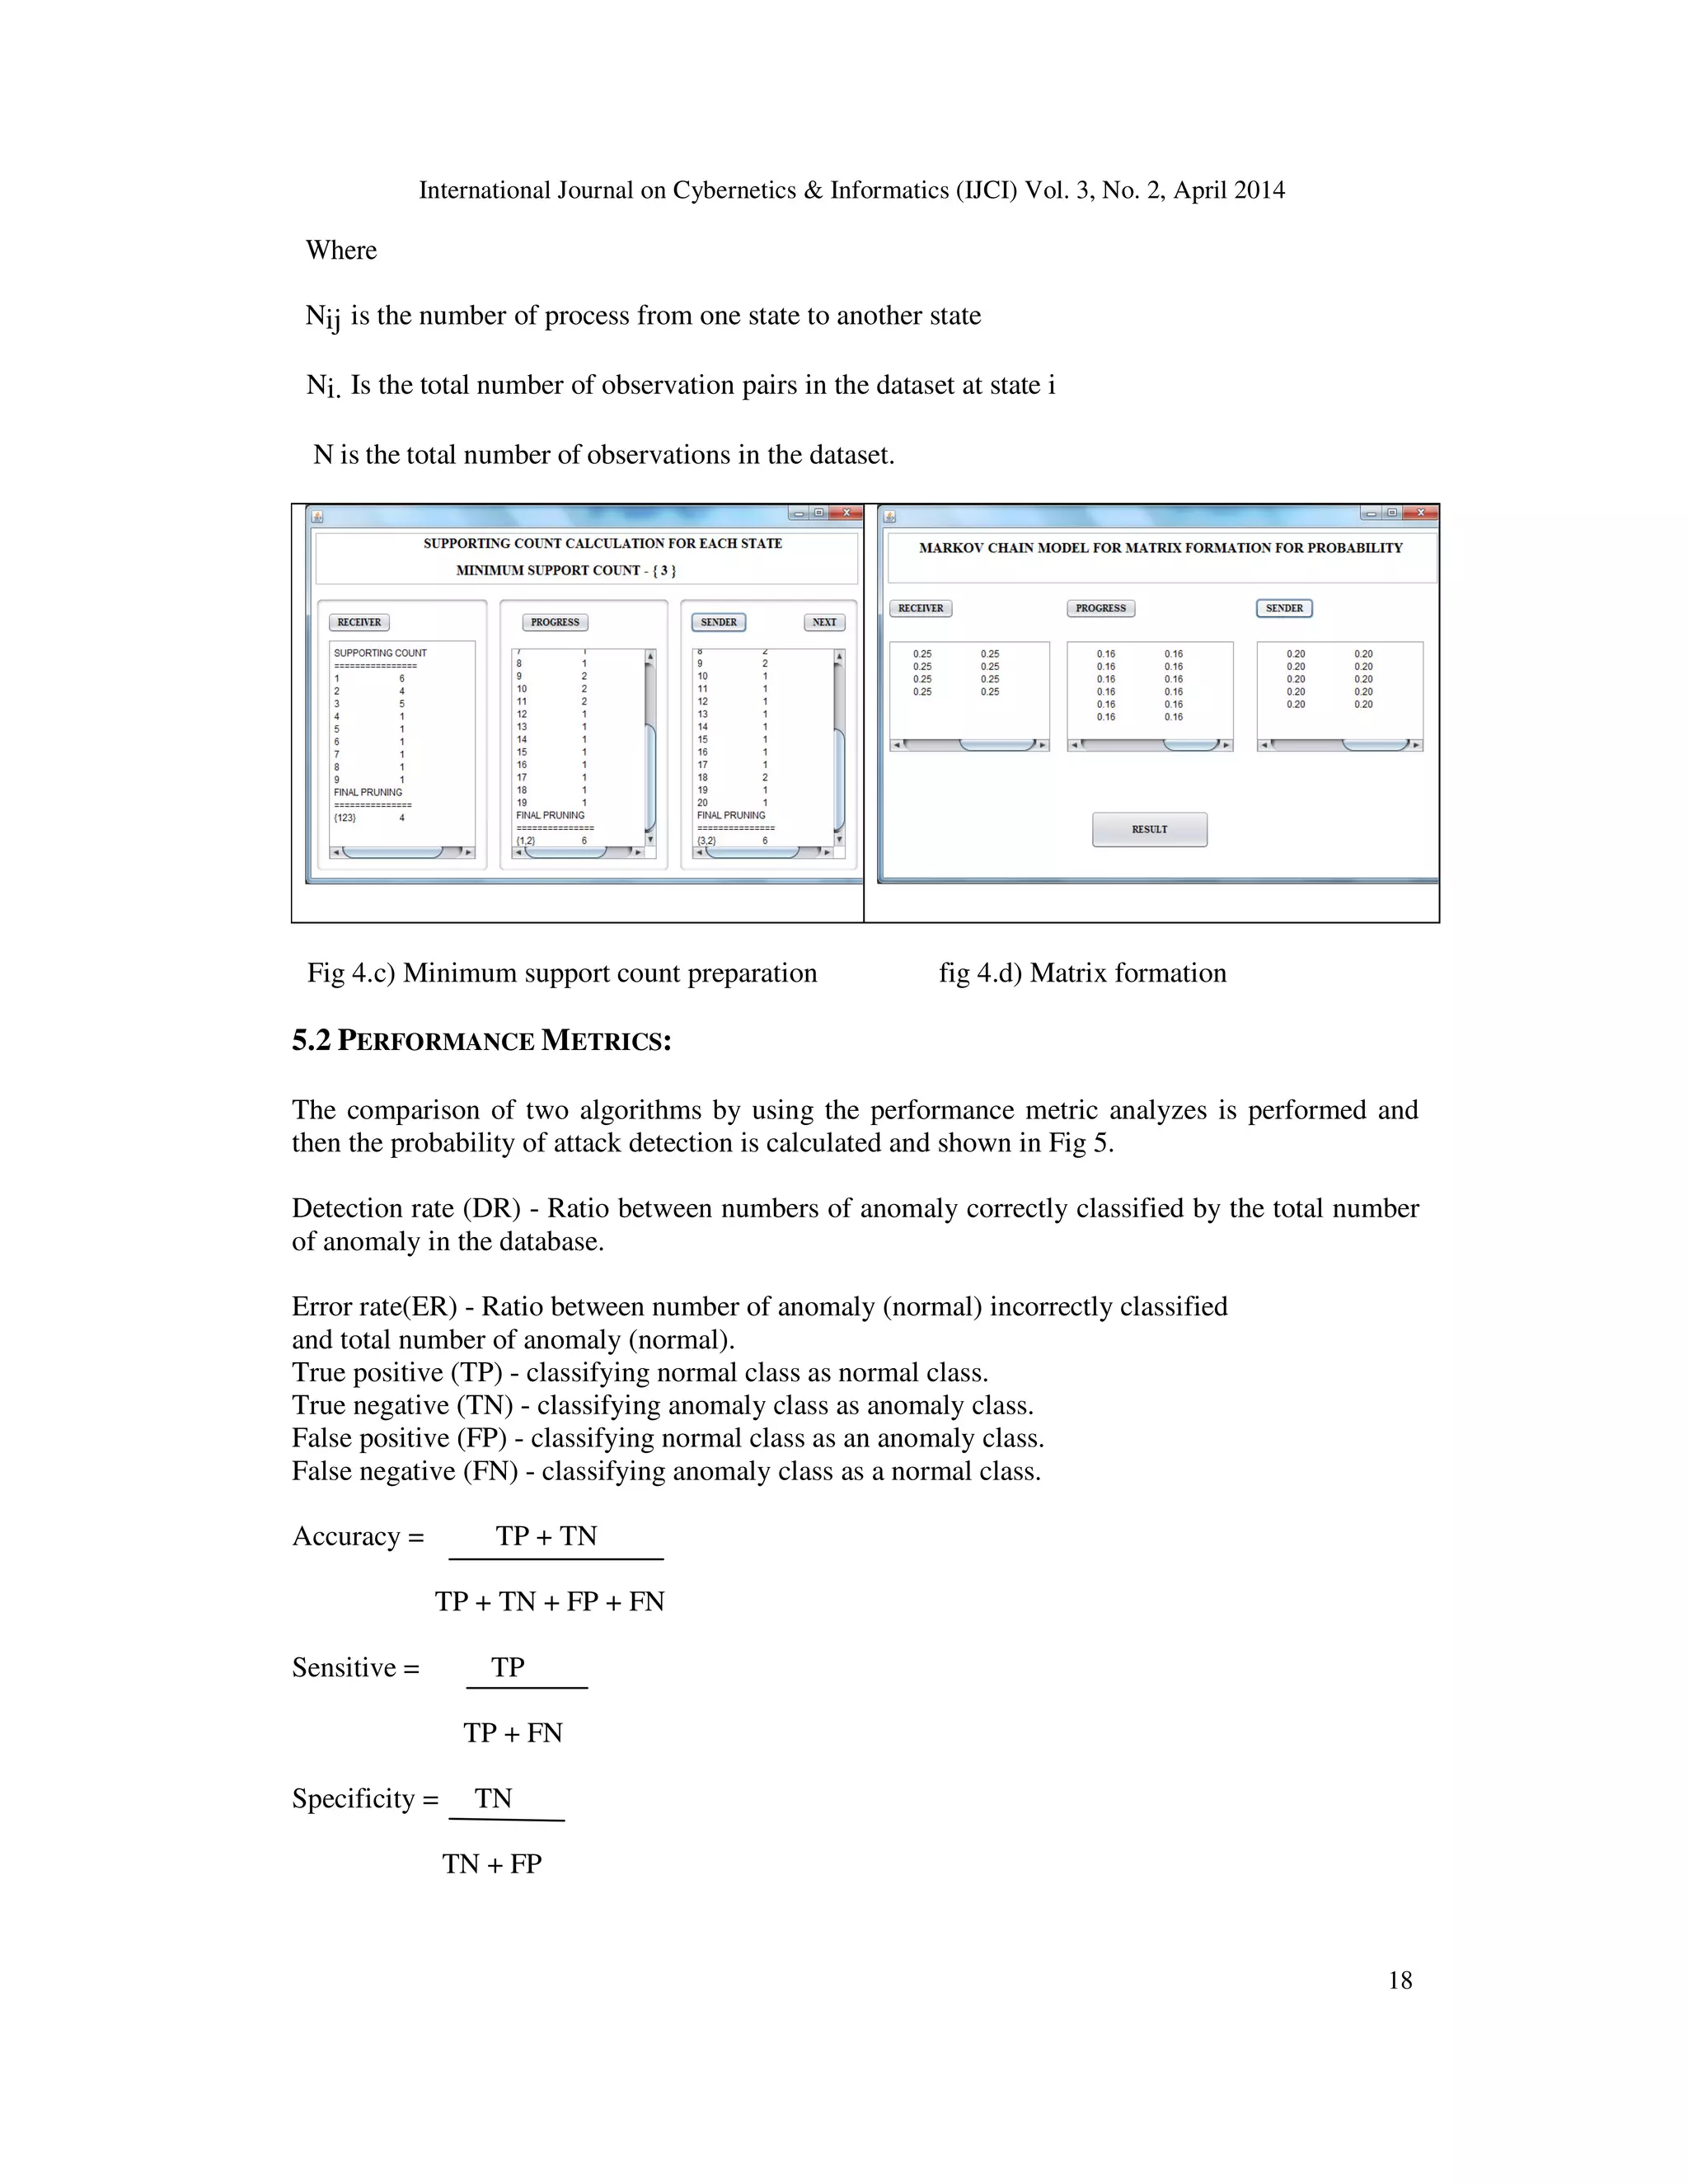
![International Journal on Cybernetics & Informatics (IJCI) Vol. 3, No. 2, April 2014 16 the apriori fact. After generating a candidate (k+1)-item set, it will be degenerated to its k-item sets subsets. If any one of these subsets is not large it is not member in Lk, so it will remove from the database as the infrequent data then it move to the second step. After the first pruning stage it move next to the second pruning step. This algorithm is fixed with minimum support count if it exceeds the minimum support then it declare as the frequent item set. Fig 4.c shows according to the support count given it process prune the data and remove the unwanted data which is below threshold. Fig 3 Flow chart of proposed work 5.1.1 GENERATION OF STRONG ASSOCIATION RULES FROM FREQUENT DATA Once the frequent data generates from transaction database, then it make a strong association rules that satisfy both minimum support and confidence. Confidence=P(B/A)= 5.1.2. BUILDING A STATE TRANSITION PROBABILITY MATRIX A Markov model is represented by a state transition matrix and initial probability distribution. Based on the assumptions, a state transition probability of t+1 depends on the state at time t [14]. Let M and N denotes the two states at time t and t + 1, where K denotes the number of states in the system. The time t+1 depend on time t, and do not depend on the previous states of time t.](https://image.slidesharecdn.com/evaluationofnetworkintrusiondetectionusingmarkovchain-140508022009-phpapp02/75/Evaluation-of-network-intrusion-detection-using-markov-chain-6-2048.jpg)
![International Journal on Cybernetics & Informatics (IJCI) Vol. 3, No. 2, April 2014 17 Fig 4.a) Dateset alignment process Fig 4.b) perform Apriori algorithm preparation Markov chain is represented by state transition probability [11]: (1) An initial probability distribution [10]: (2) where qi is the probability of the state i (3) The probability that a sequence from X1, XT at time 1to t occurs in the Markov chain is computed as follows: (4) In fig 4.d shows the result of transition probability matrix and the initial probability distribution the matrix is performed which is used to detect the attack detection in three states. (5) (6)](https://image.slidesharecdn.com/evaluationofnetworkintrusiondetectionusingmarkovchain-140508022009-phpapp02/75/Evaluation-of-network-intrusion-detection-using-markov-chain-7-2048.jpg)
![International Journal on Cybernetics & Informatics (IJCI) Vol. 3, No. 2, April 2014 19 Fig 5 Comparison of k-Means and Apriori 6. CONCLUSION The implementation of K-Means Algorithm and Apriori Algorithm test is done and concluded that the performance of K-Means clustering Algorithm for anomaly detection is not as good as the performance of the Apriori Algorithm, for DARPA2000 sample dataset. And also, this project has done with building k states of frequent data using Apriori algorithm and will subsequently build model for probability calculation, for detecting anomaly using first-order Markov chain. Future work is to implement the higher order Markov model, where the state of system depends not only on the previous events but also the historic events. Compare the performance with other probabilistic techniques. REFERENCES [1] Nong Ye(2000), ”A Markov Chain Model of Temporal Behavior for Anomaly Detection”, Proceedings of the 2000 IEEE Workshop on Information Assurance and Security United States Military Academy, West Point,pp. 171-174. [2] Ye, Nong, et al(2001), "Probabilistic techniques for intrusion detection based on computer audit data." ,Systems, Man and Cybernetics, Part A: Systems and Humans, IEEE Transactions, Vol.31, No.4, pp.266-274.. [3] Peddabachigari.S, Abraham.A & Thomas(2004), ”Intrusion detection systems using decision trees and support vector machines”, International Journal of Applied Science and Computations, pp. 118- 134. [4] Jiang, S., Song, X., Wang, H., Han, J., & Li, Q. (2006), ” A clustering-based method for unsupervised intrusion detections”, Pattern Recognitions Letter, 27(7), pp.802–810. [5] Nong Ye, Senior Member, IEEE, Syed Masum Emran, Qiang Chen, and Sean Vilbert (2007), “Multivariate Statistical Analysis of Audit Trails for Host-Based Intrusion Detection.”, IEEE transaction on computers, Vol. 51, No. 7, pp.810-820 ,. [6] Poulose Jacob, K., and Varghese Surekha Miriam (2007), "Anomaly Detection Using System Call Sequence Sets." , Vol.2, pp.14-21. [7] Gogoi, Prasanta, Bhogeswar Borah, and Dhruba K. Bhattacharyya (2010), "Anomaly detection analysis of intrusion data using supervised & unsupervised approach.",Journal of Convergence Information Technology ,Vol.5, No.1, pp.101-105. [8] Nasser S. Abouzakhar and Abu Bakar (2010), “A Chi-square testing-based intrusion detection Model.”, School of Computer Science, The University of Hertfordshire, College Lane, Hatfield AL10 9AB, Hertfordshire, UK,Vol 36, No.4, pp.280-292. [9] Jyothsna.V, Rama Prasad.V.V, Munivara Prasad.K(2011), ”A Review of Anomaly based Intrusion Detection Systems”, International Journal of Computer Applications (0975 – 8887)Volume:28 No:7, pp: 283–304.](https://image.slidesharecdn.com/evaluationofnetworkintrusiondetectionusingmarkovchain-140508022009-phpapp02/75/Evaluation-of-network-intrusion-detection-using-markov-chain-9-2048.jpg)
![International Journal on Cybernetics & Informatics (IJCI) Vol. 3, No. 2, April 2014 20 [10] Yogendra Kumar Jain , Upendra(2012), ” An Efficient Intrusions Detection Based On Decision Tree Classifier Using Feature Reductions”, International Journal Of Scientific And Research Publications,Volume 2,Issue 1, ISSN 2250-3153. [11] Gyanchandani, Rana.J.L, Yadav.R.N(2012), ”Taxonomy of Anomaly Based Intrusion Detection System: A Review”, International Journal of Scientific and Research Publications, Volume:2, Issue:12,1 ISSN 2250-3153. [12] Farhad Soleimanian Gharehchopogh, Neda Jabbari, Zeinab Ghaffari Azar(2012), ”Evaluation of Fuzzy K-Mean And K-Means Clustering Algorithms In Intrusion Detection Systems”, International Journal Of Scientific & Technology Research Volume:1, Issue 11, ISSN 2277-8616 66, pp. 283–304. [13] Rahul Rastogi1, Zubair Khan2, M. H and Khan (2012), “Network Anomalies Detection Using Statistical Technique : A Chi- Square approach.”, IJCSI International Journal of Computer Science Issues, Vol. 9, Issue 2, No 3, pp.515-522. [14] Seongjium Shin, Seungmin Lee, Hyunwoo Kim, Sehum Kim (2013), “Advanced Probabilistic Approach For Network Intrusion Forecasting and Detection.“, Expert system with applications, Vol.40, pp. 315 – 322,. [15] Poonam Dabas, Rashmi Chaudhary(2013), ”Survey Of Network Intrusion Detection Using K-Mean Algorithm”, International Journal Of Advanced Research In Computer Science And Software Engineering, Volume:3, Issue: 3,ISSN: 2277,pp. 30-35. Authors I am S. Brindasri pursuing the M.E CSE in Erode Sengunthar Engineering College. I have published my survey in international journal computer science and information technology. My research interests in network security.](https://image.slidesharecdn.com/evaluationofnetworkintrusiondetectionusingmarkovchain-140508022009-phpapp02/75/Evaluation-of-network-intrusion-detection-using-markov-chain-10-2048.jpg)

This document discusses the evaluation of network intrusion detection systems (IDS) using Markov chains and incorporates two algorithms, k-means and apriori, for classifying network activities. The study demonstrates the need for effective intrusion detection methods in light of increasing internet threats and presents experimental results showing high performance in detecting various types of attacks using the DARPA 2000 dataset. It highlights the importance of data pruning and probabilistic modeling to enhance the detection efficiency of network intrusions.