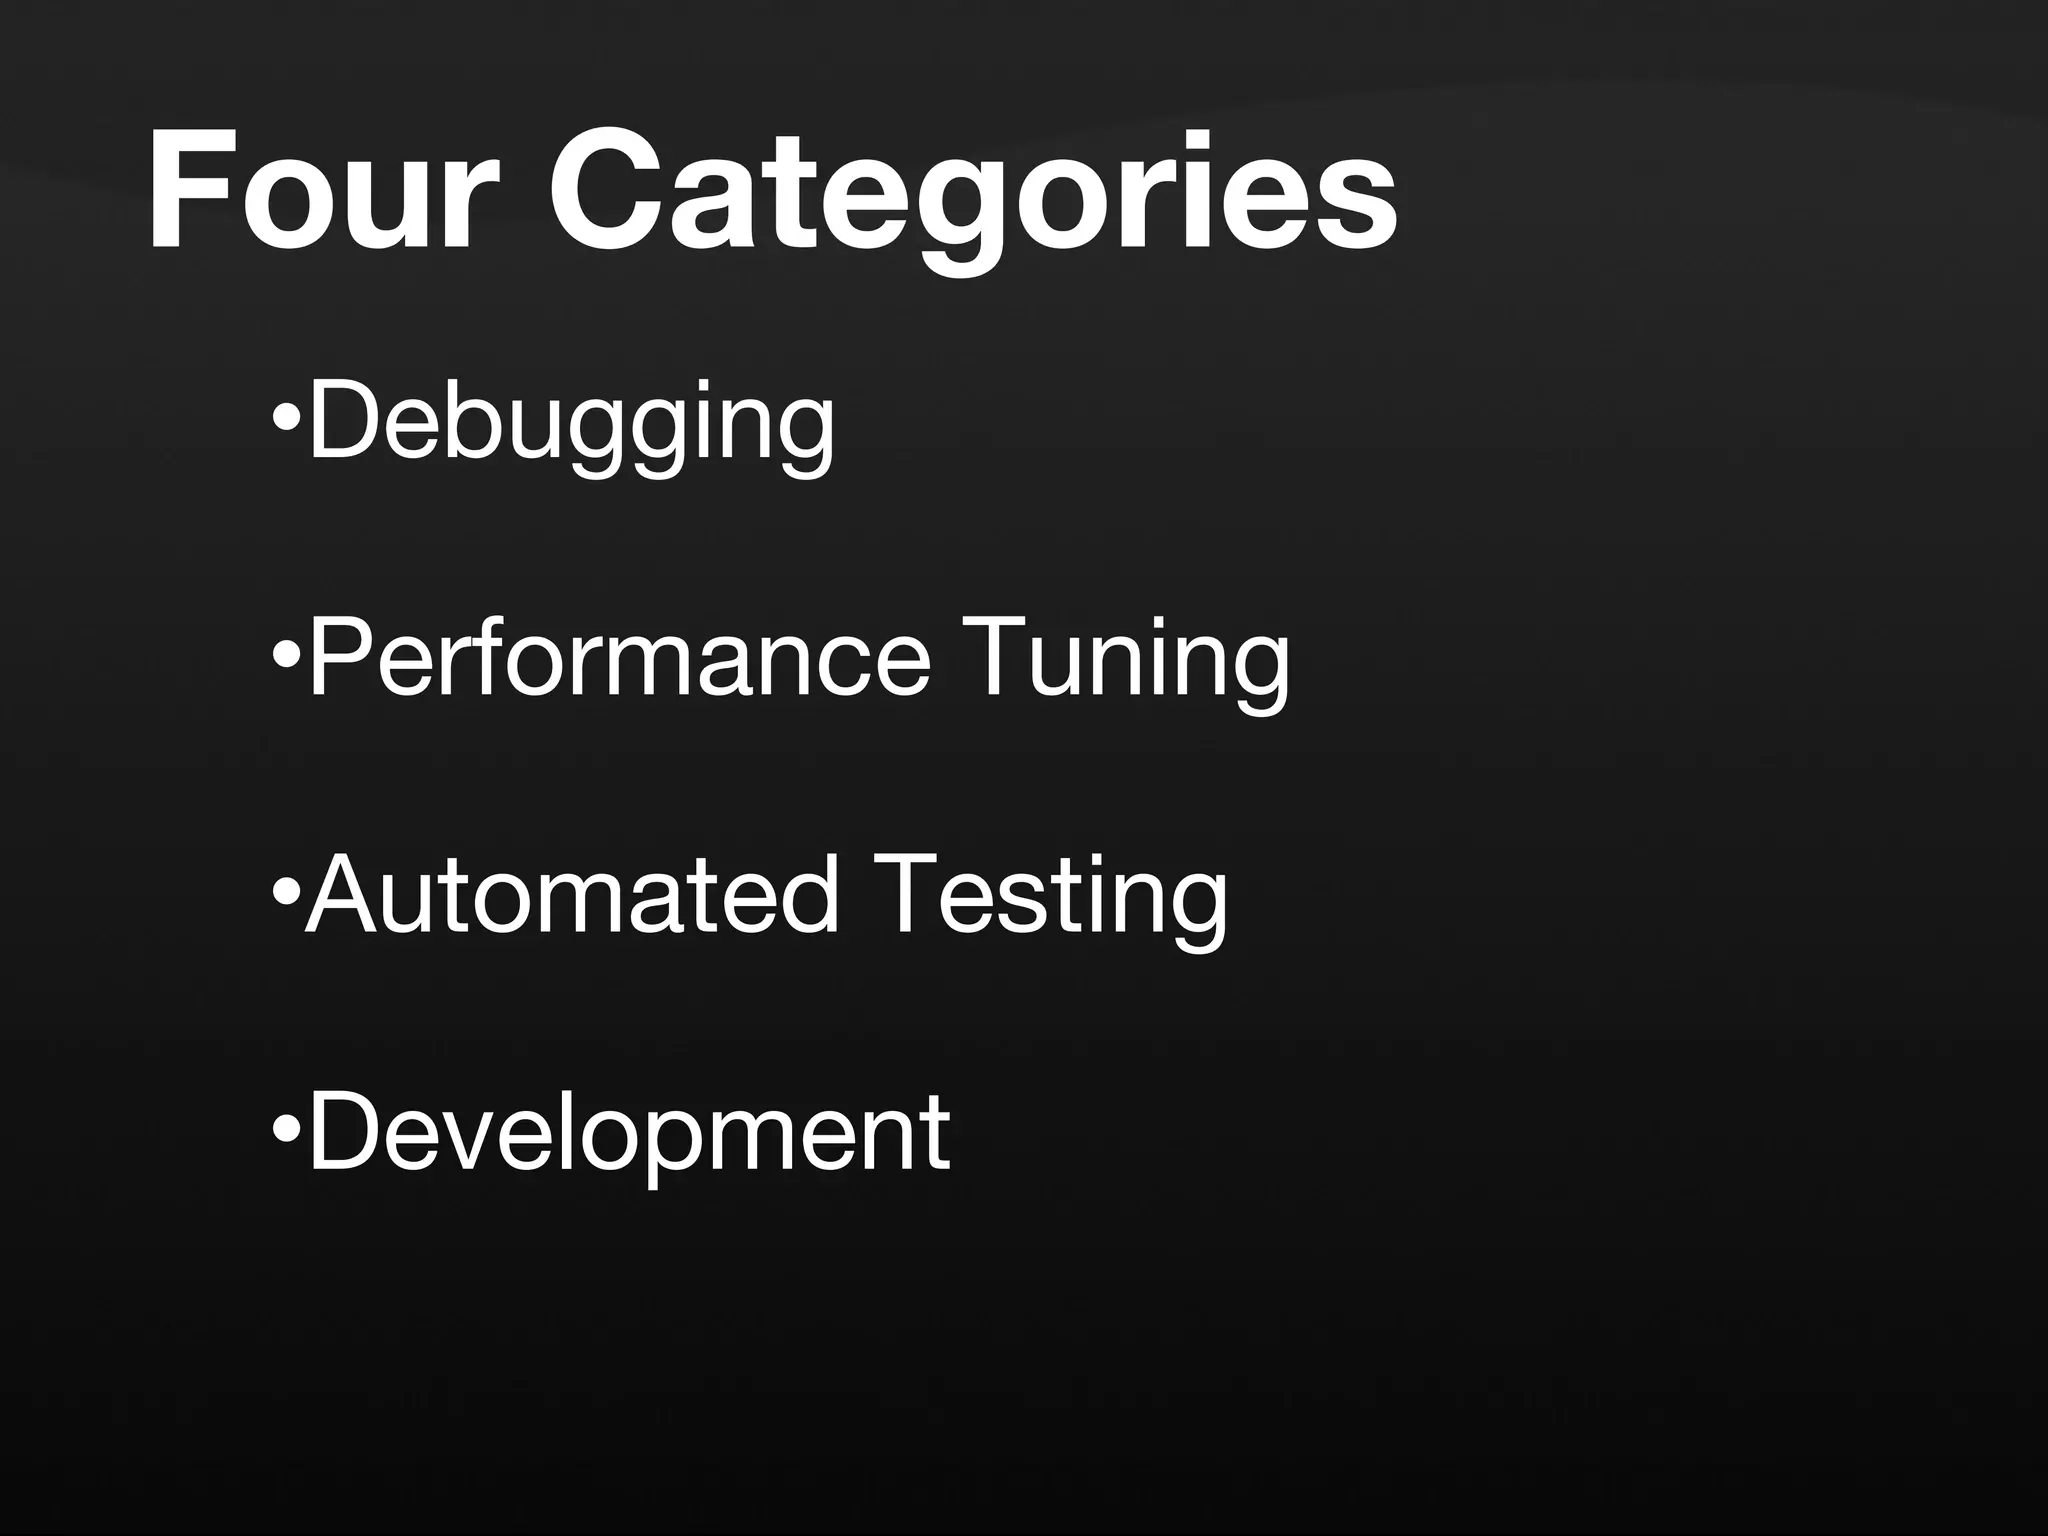
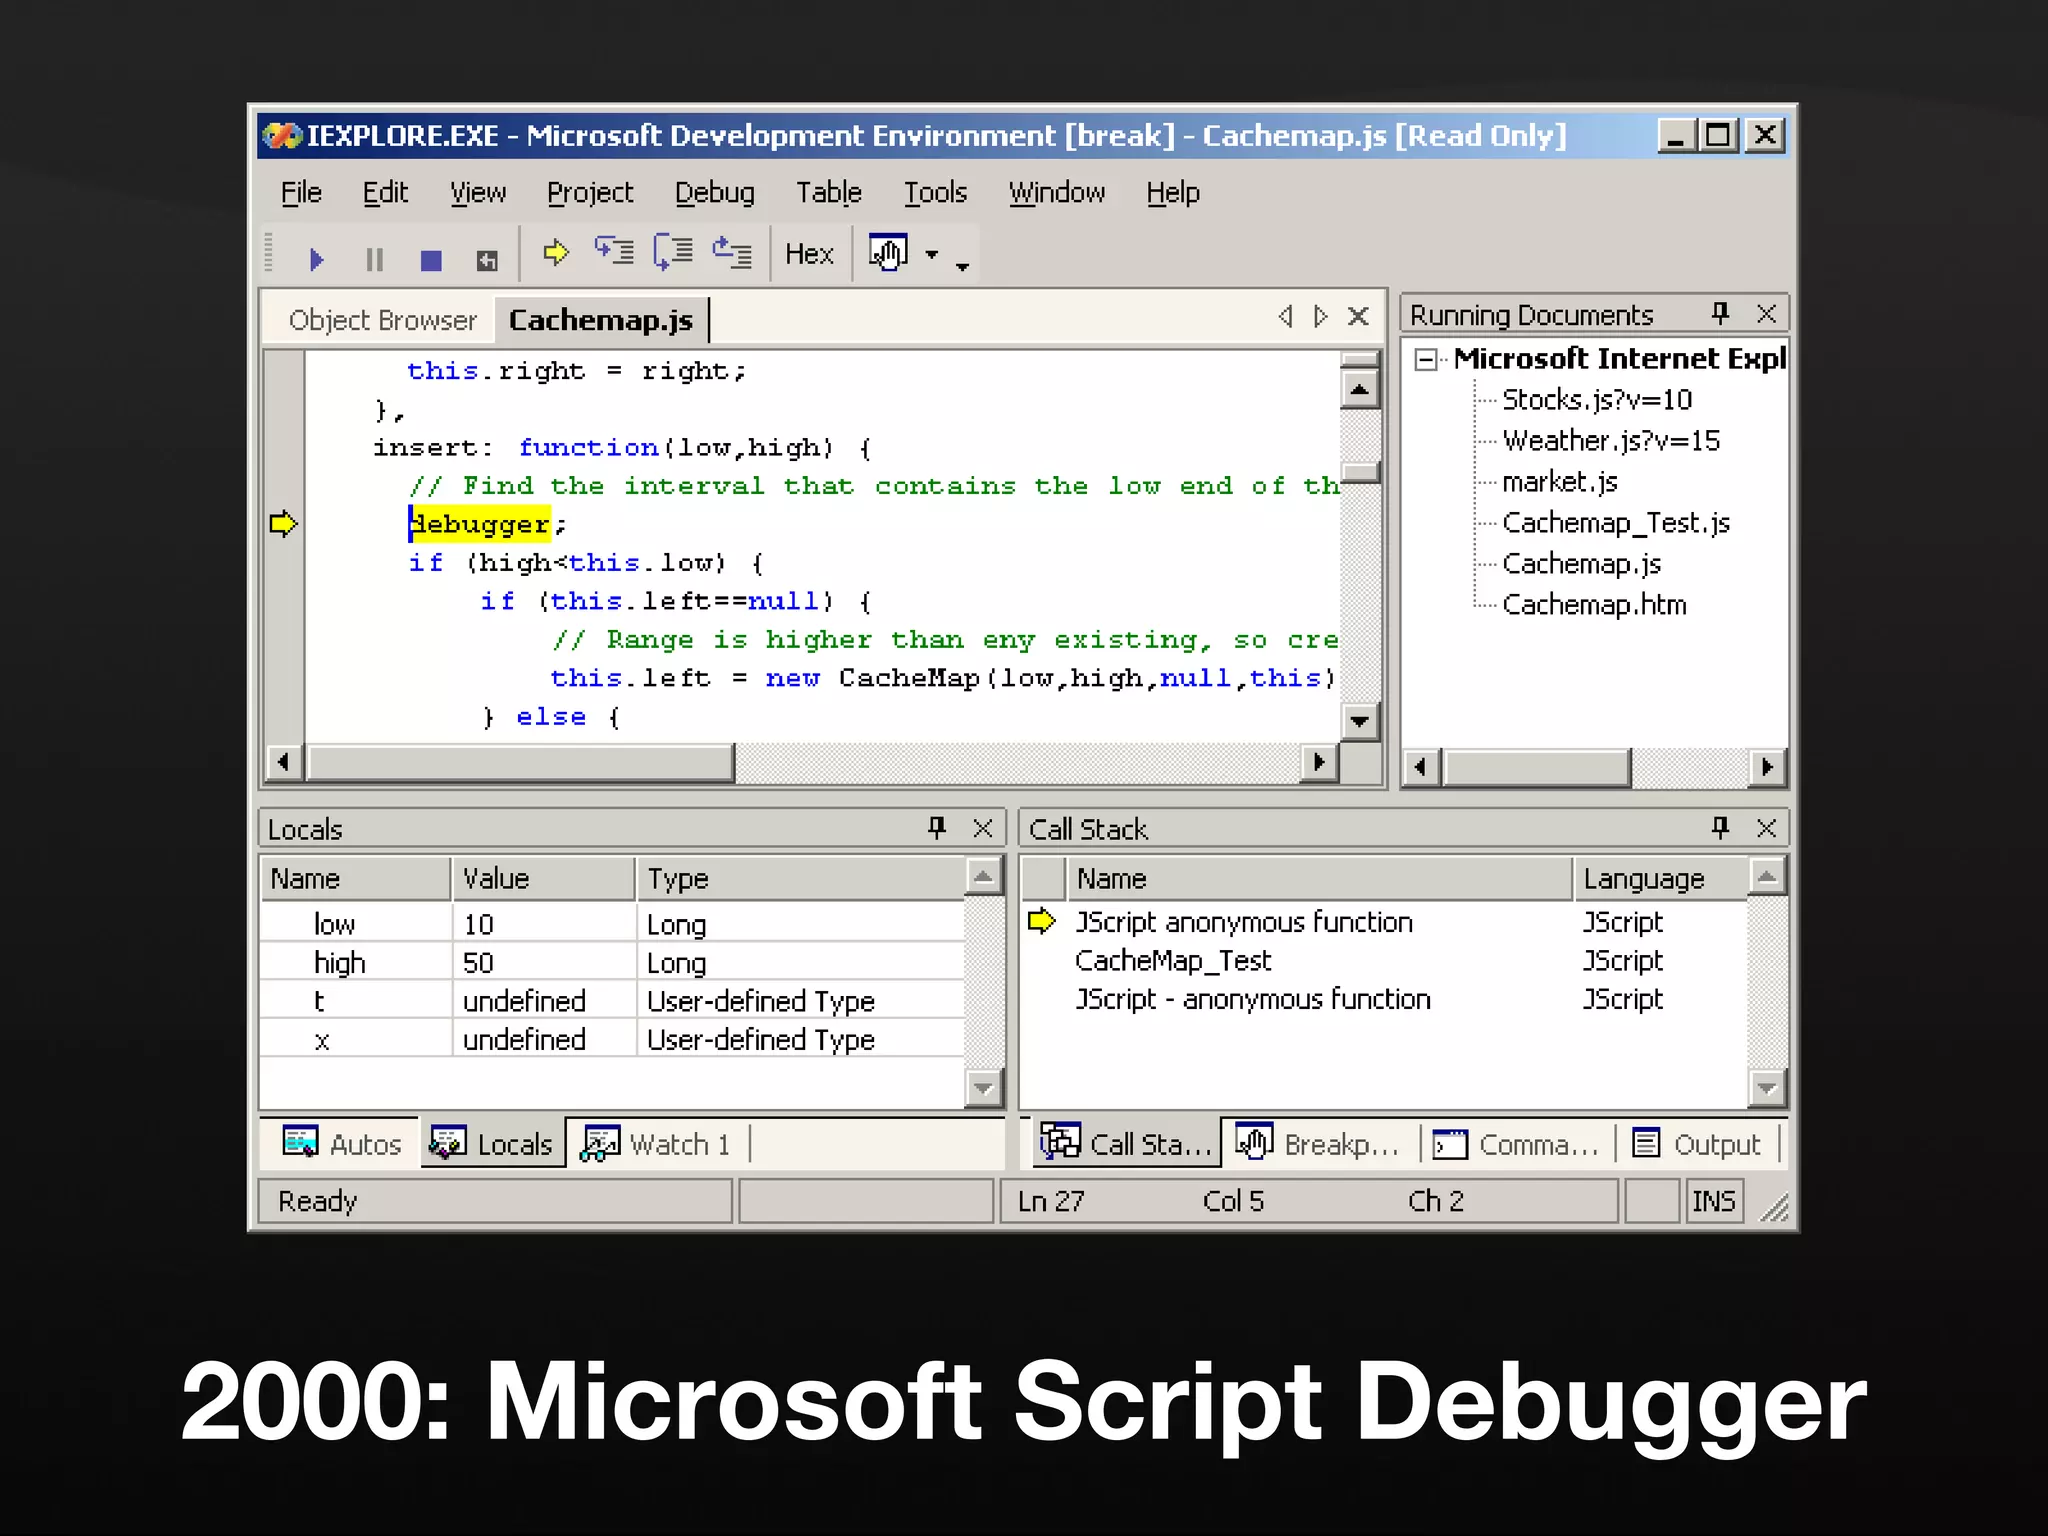
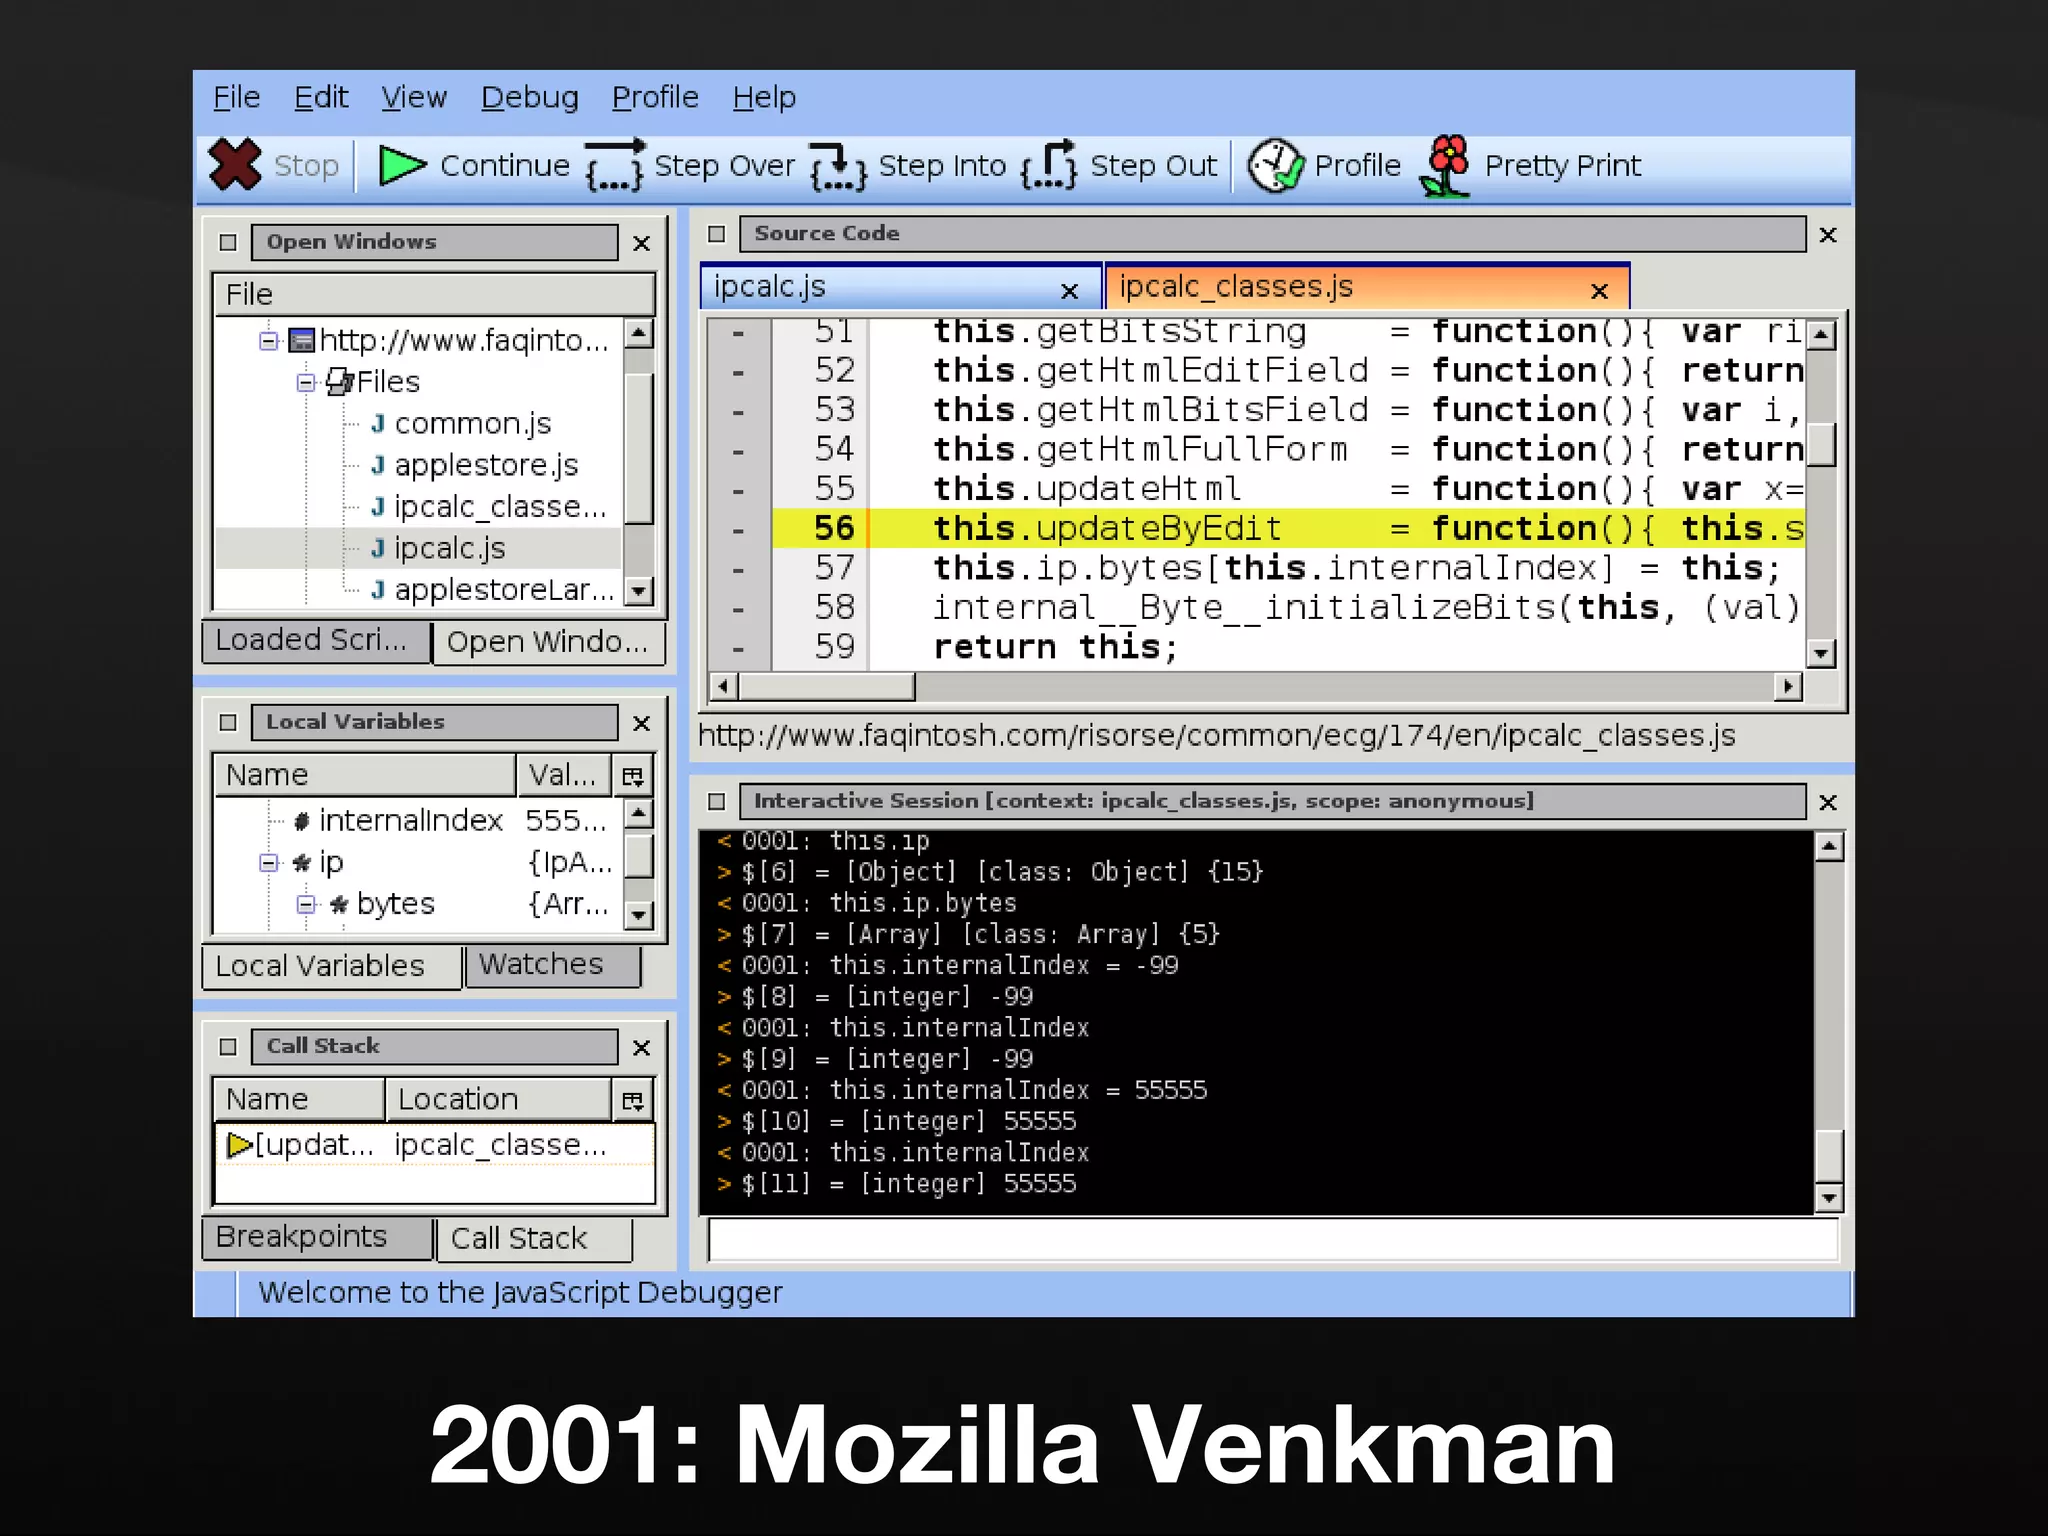
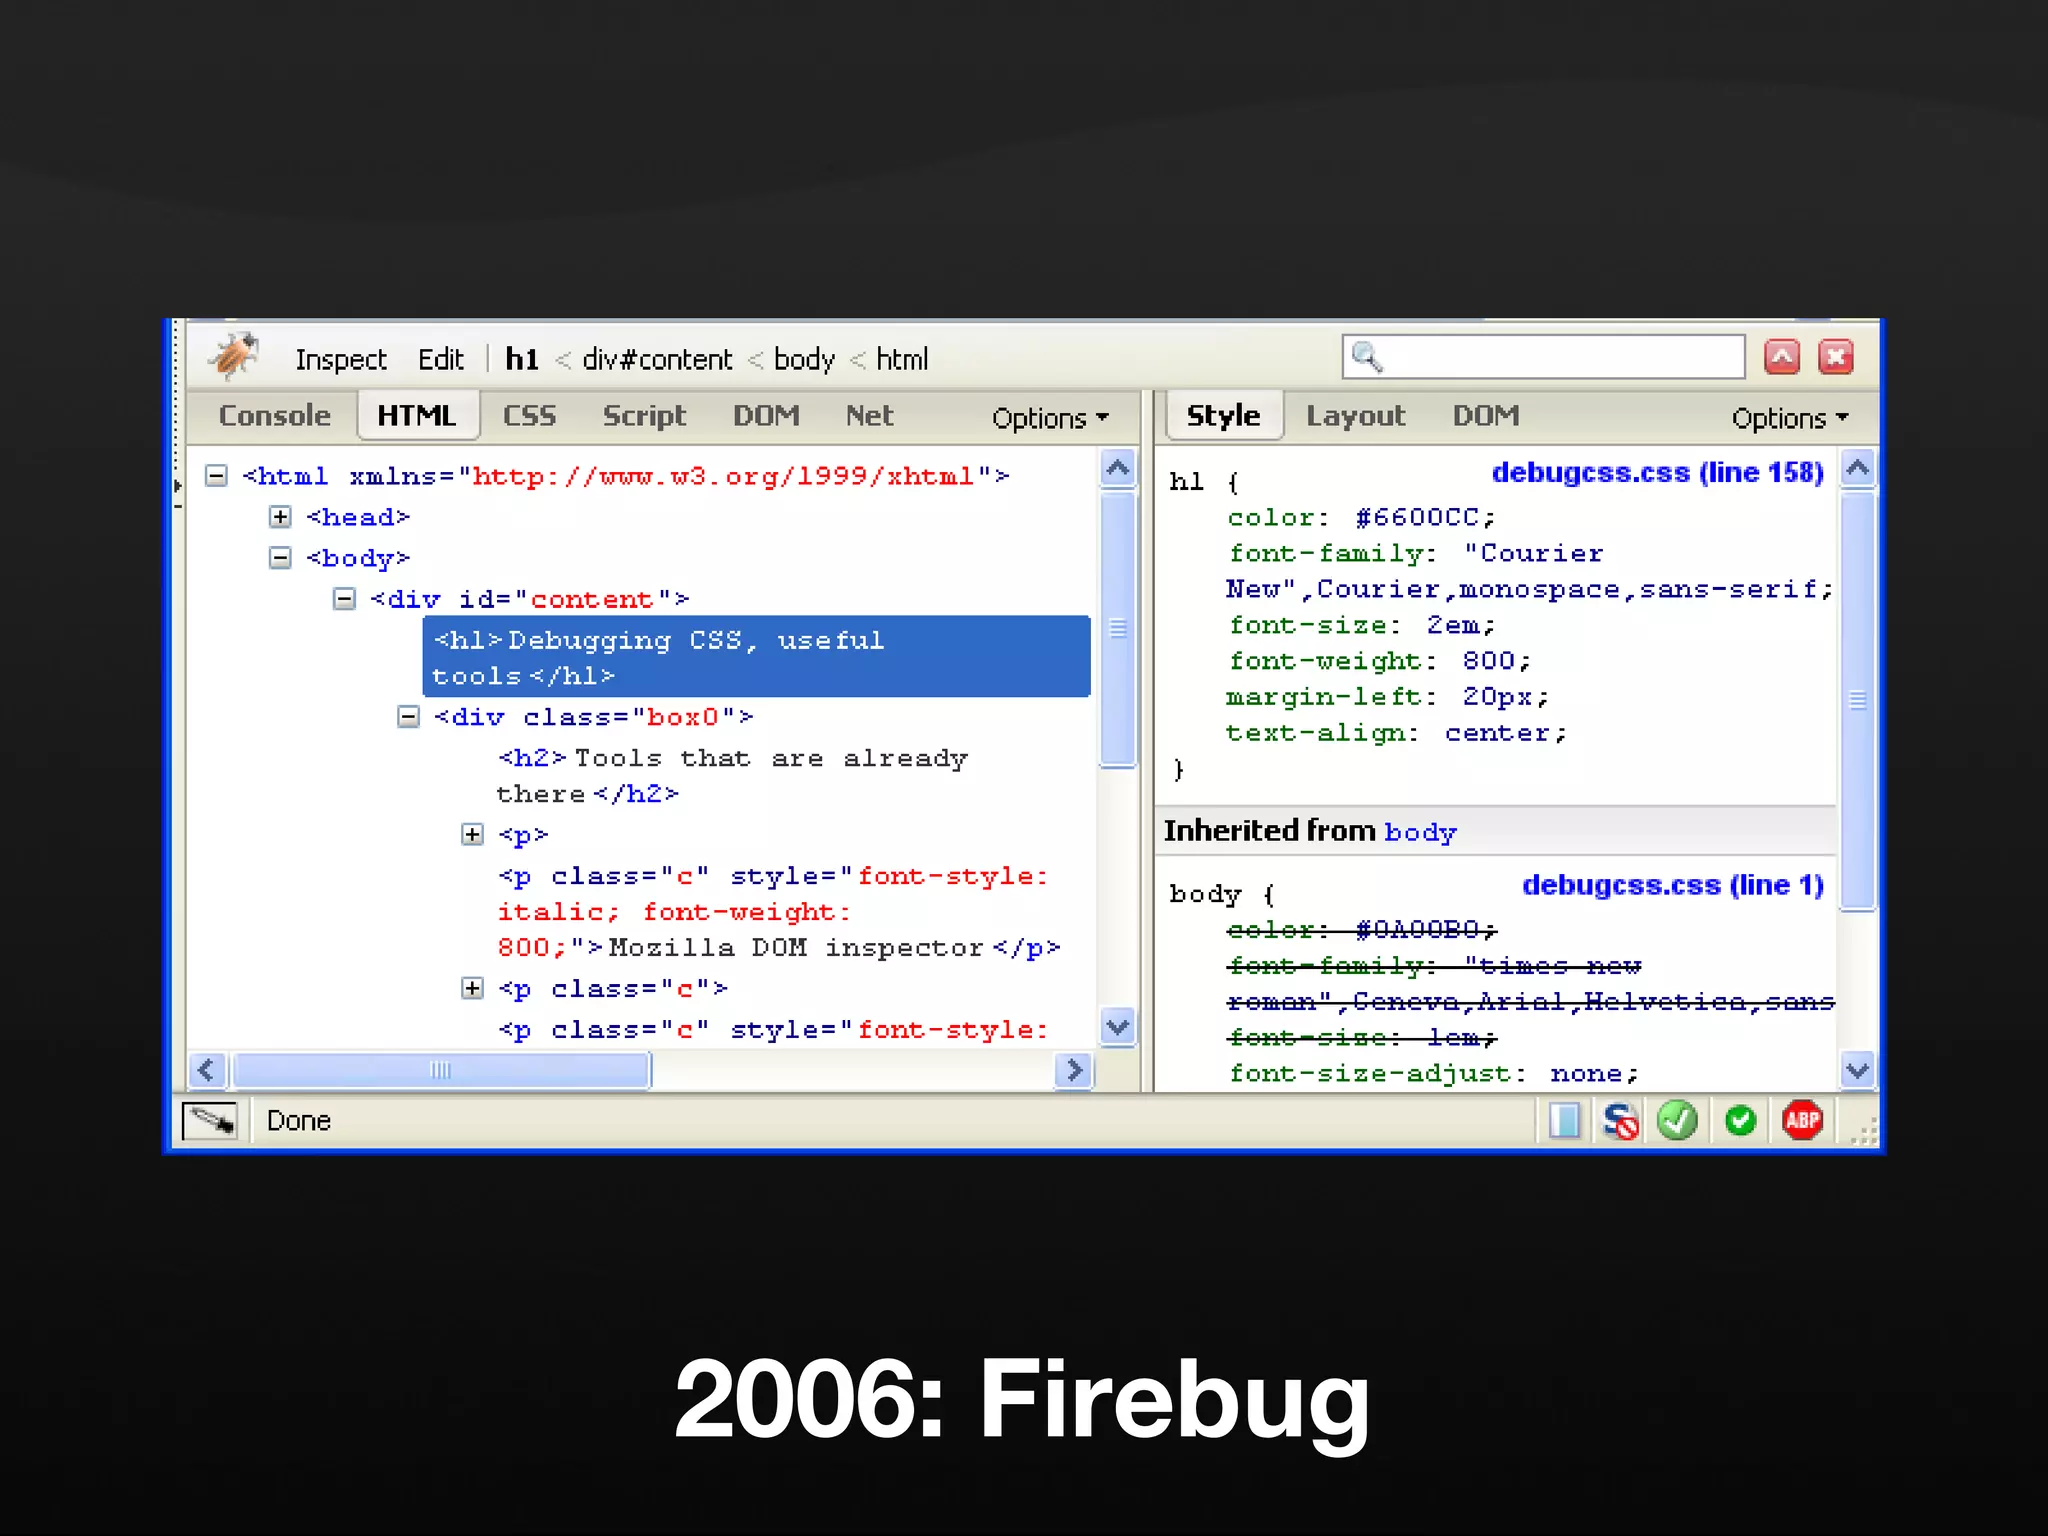
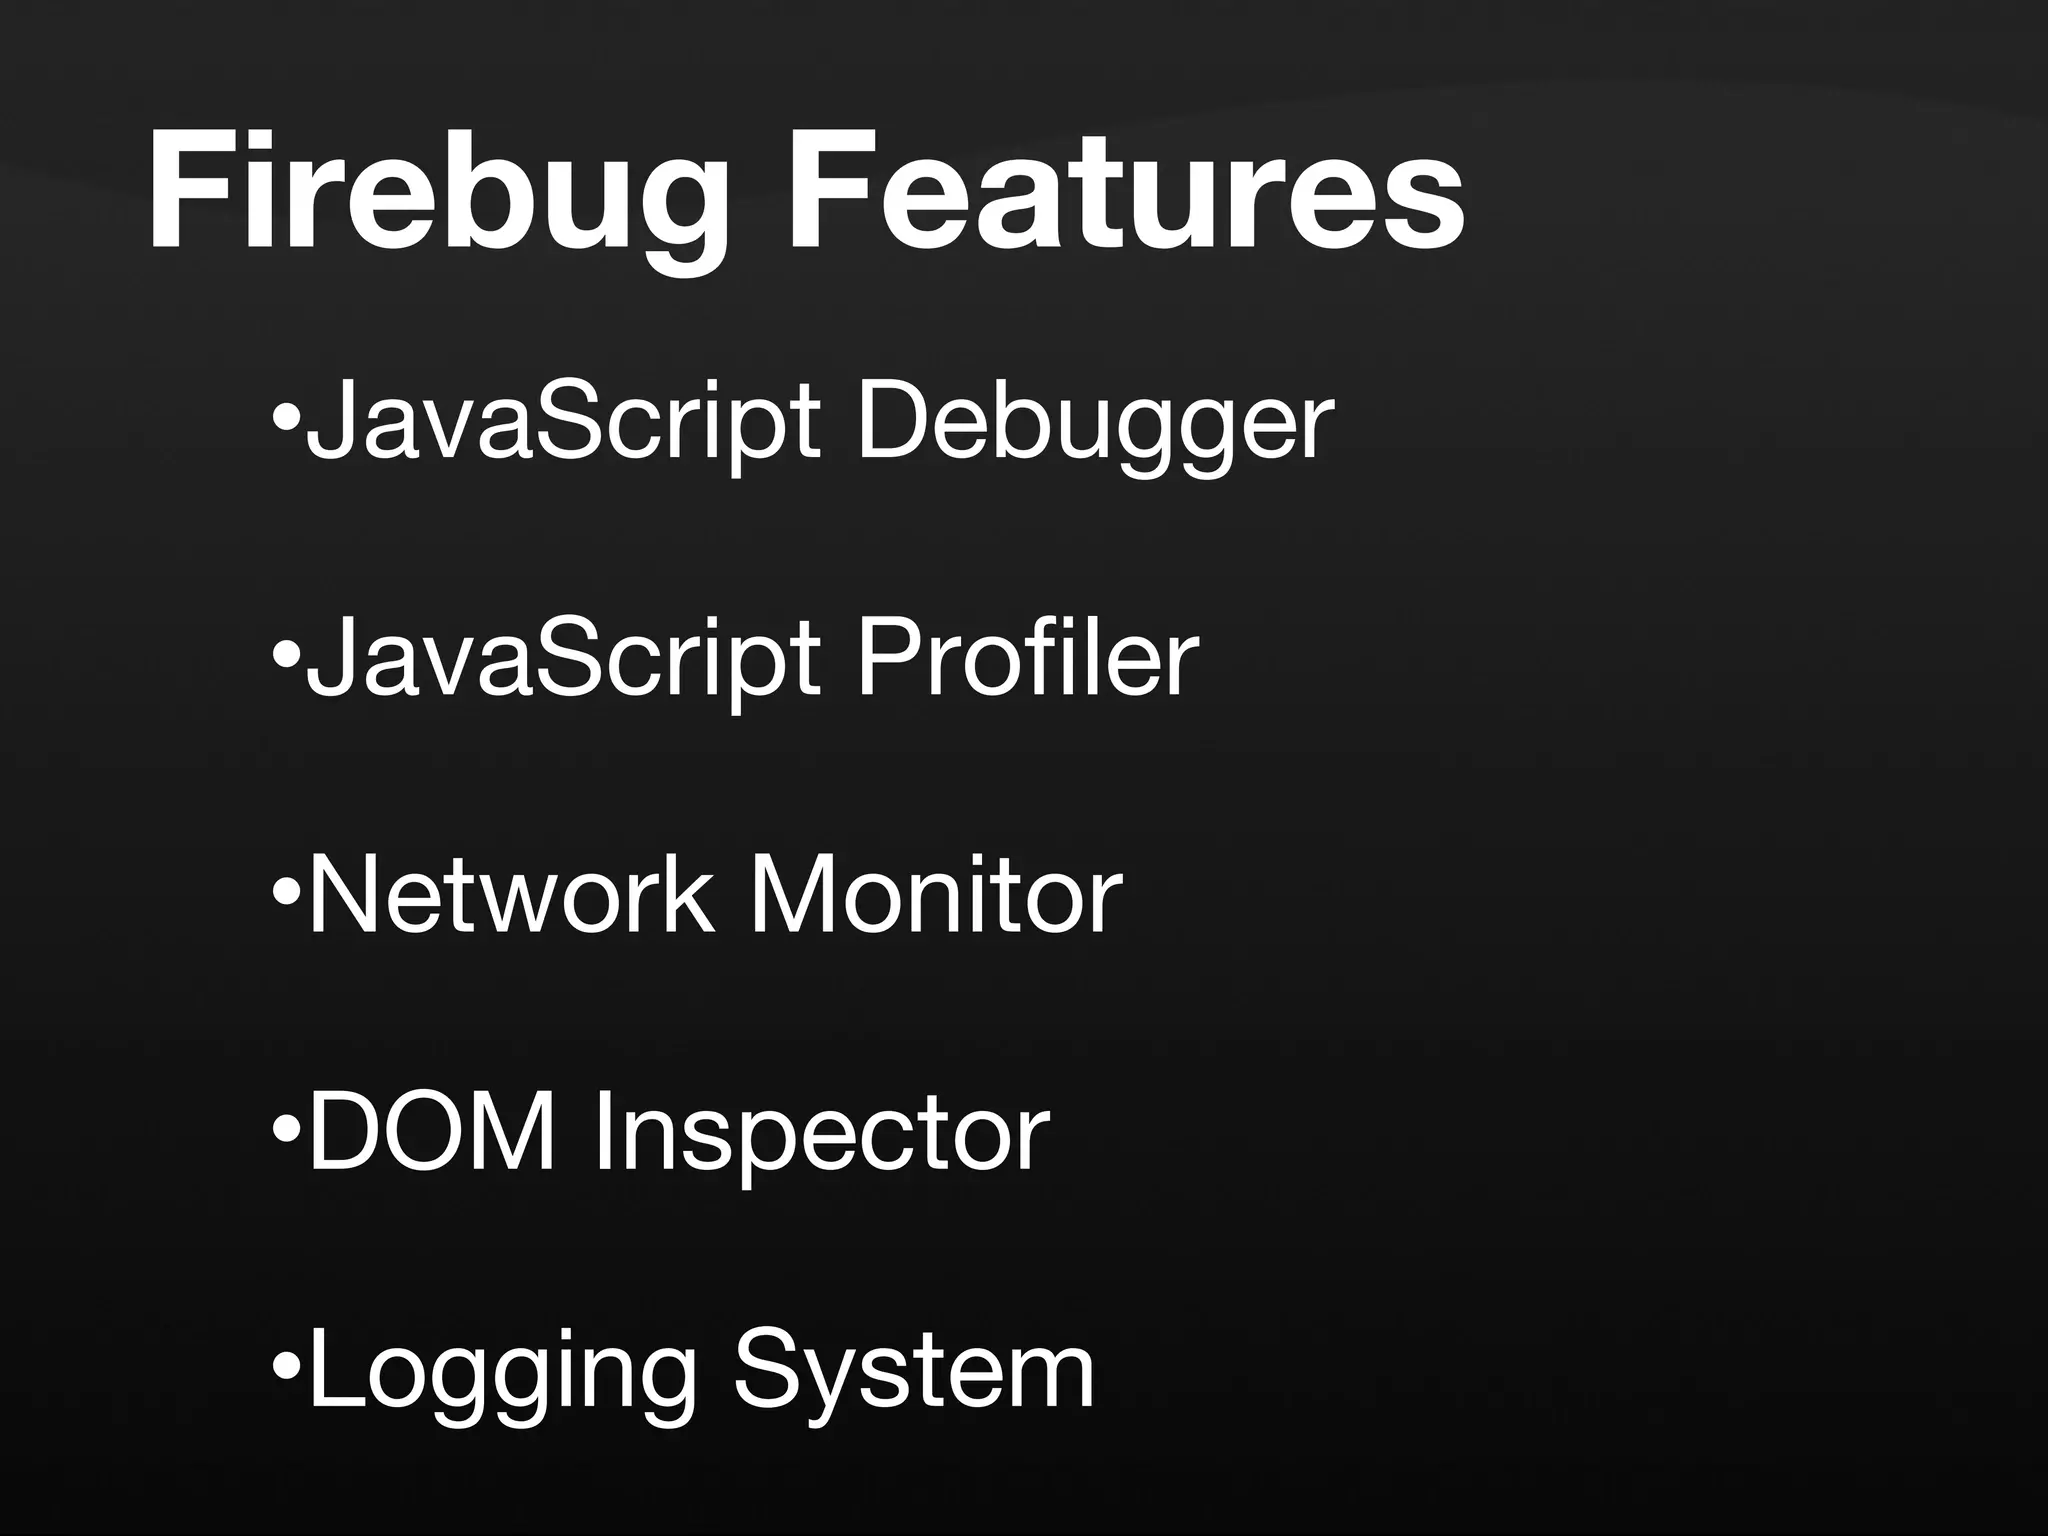
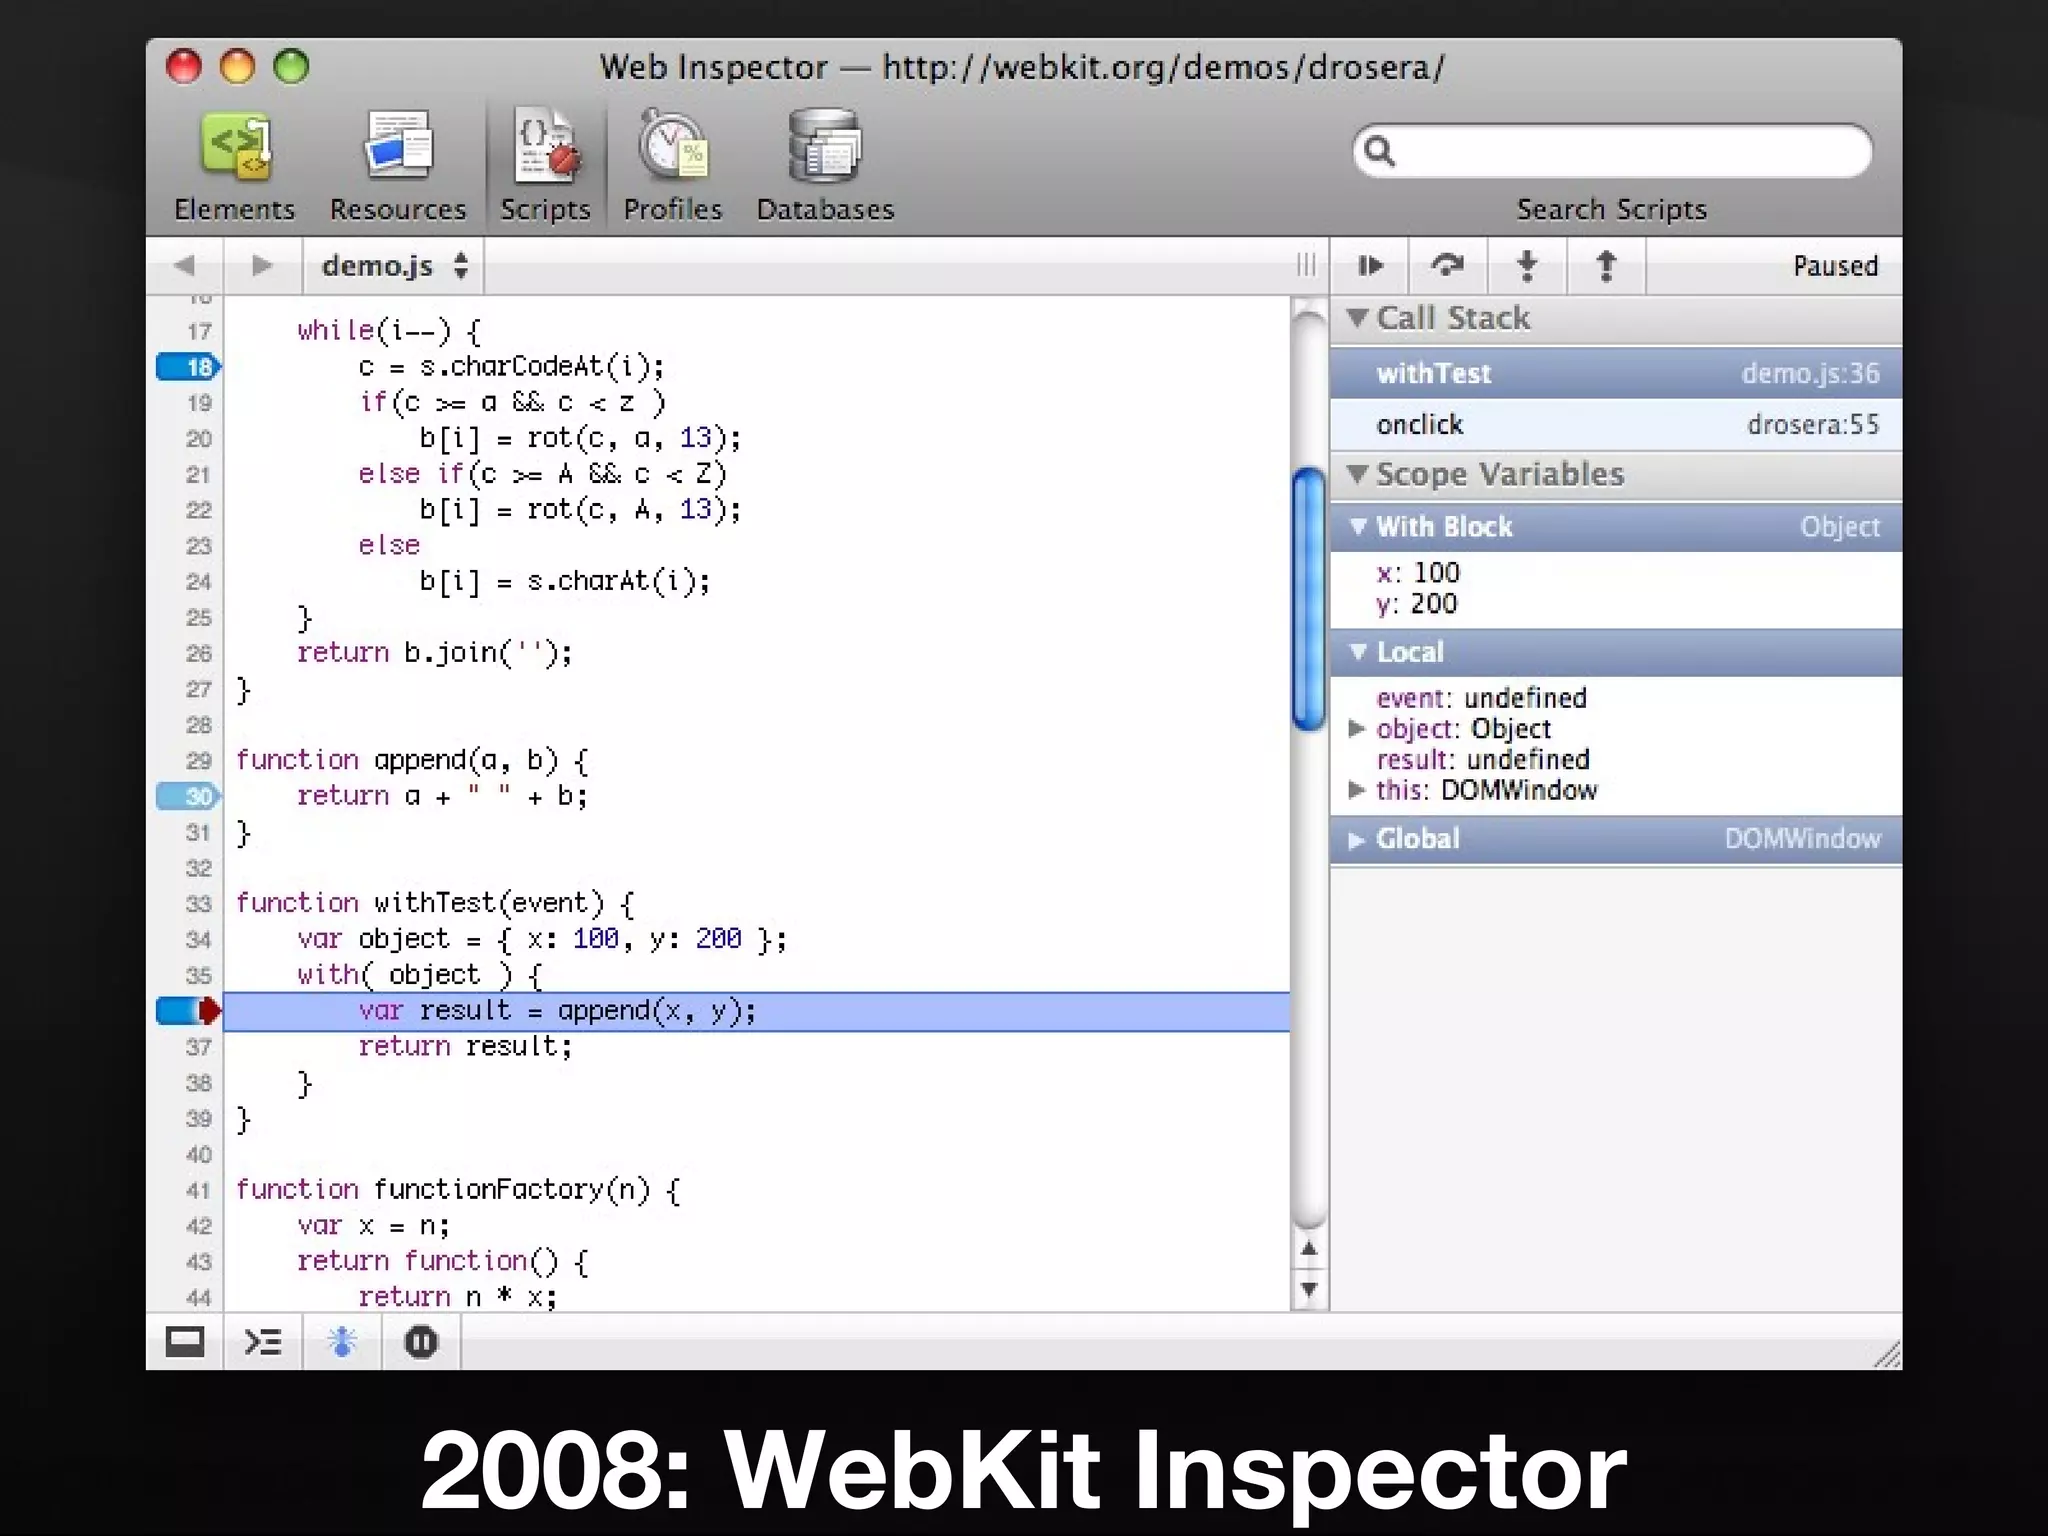
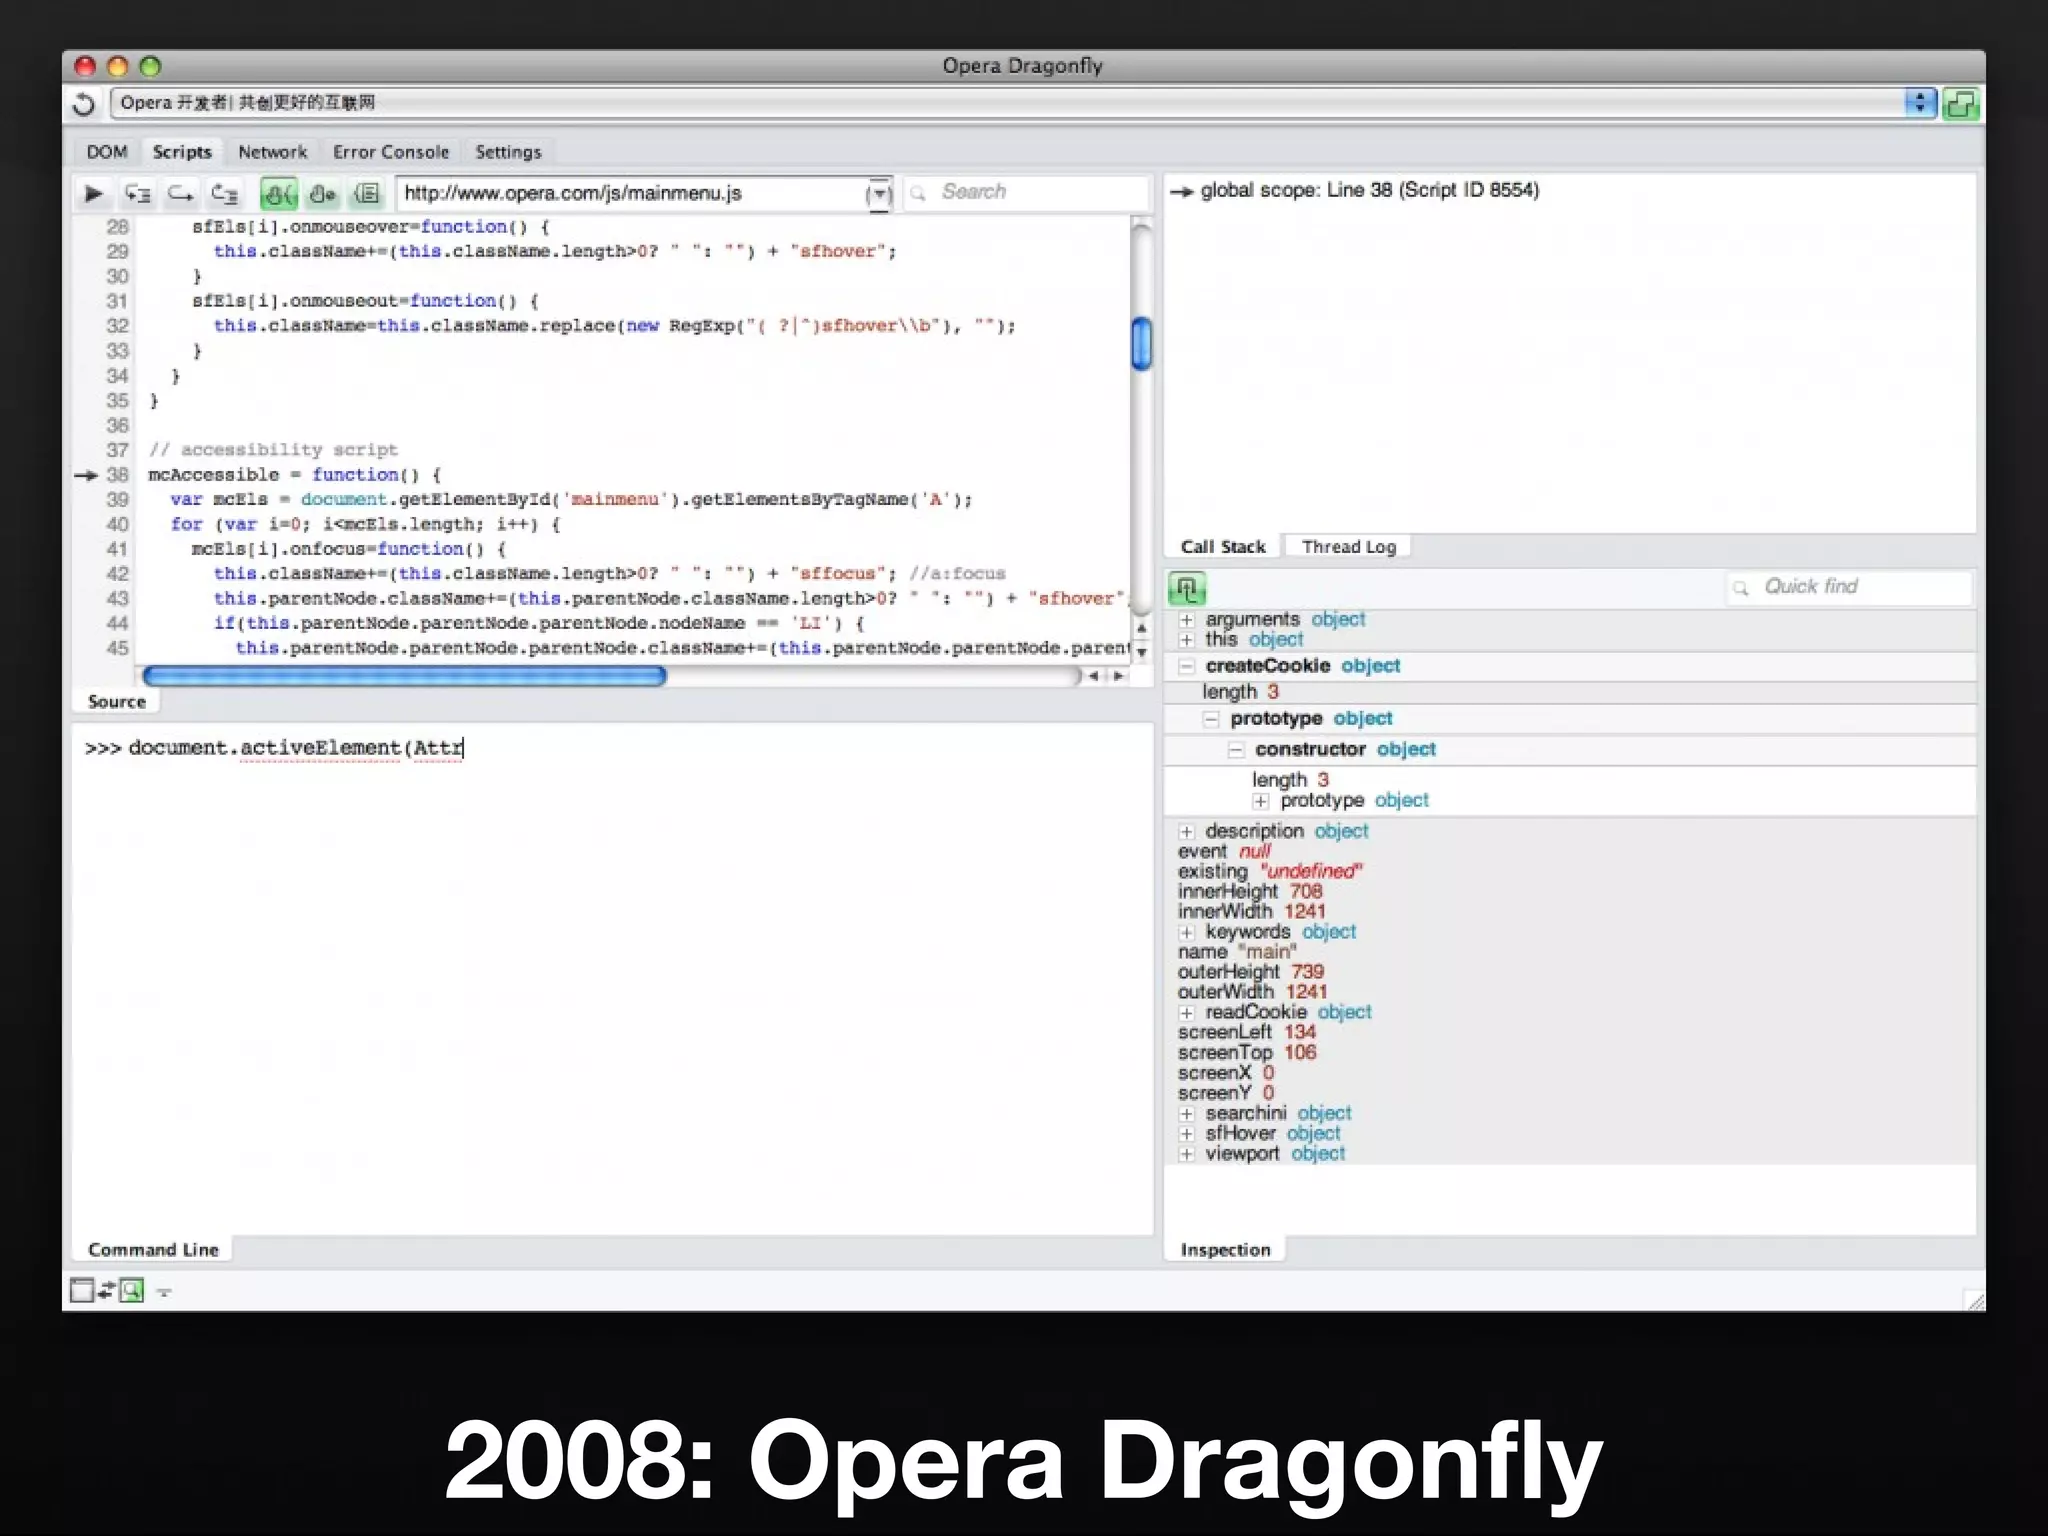
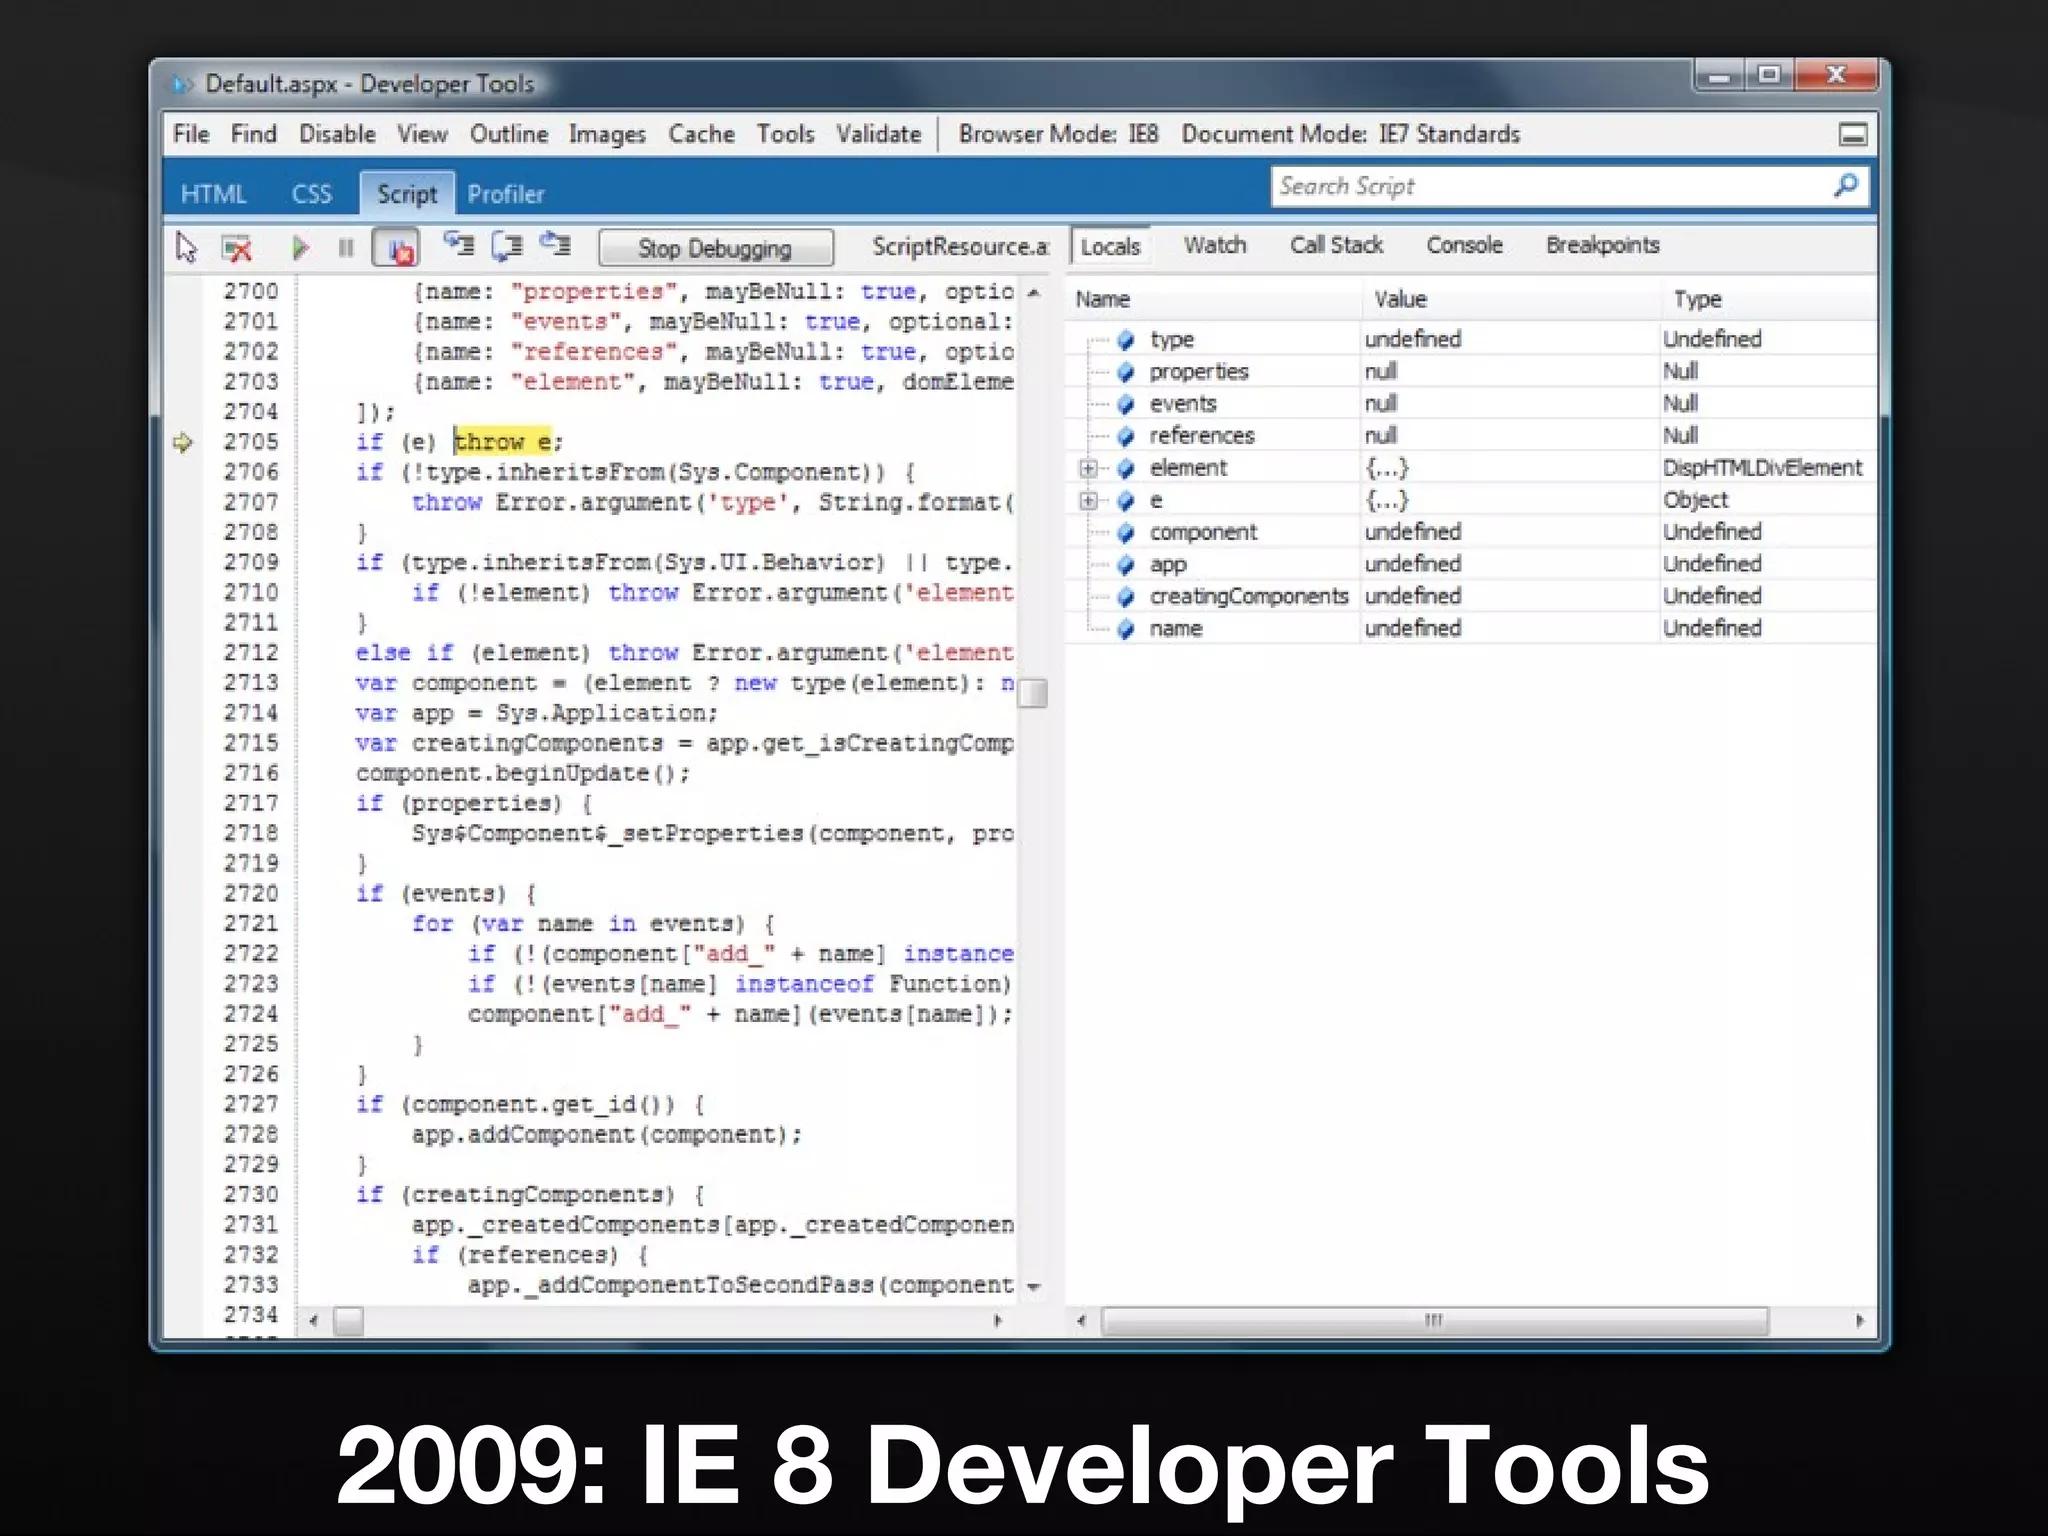
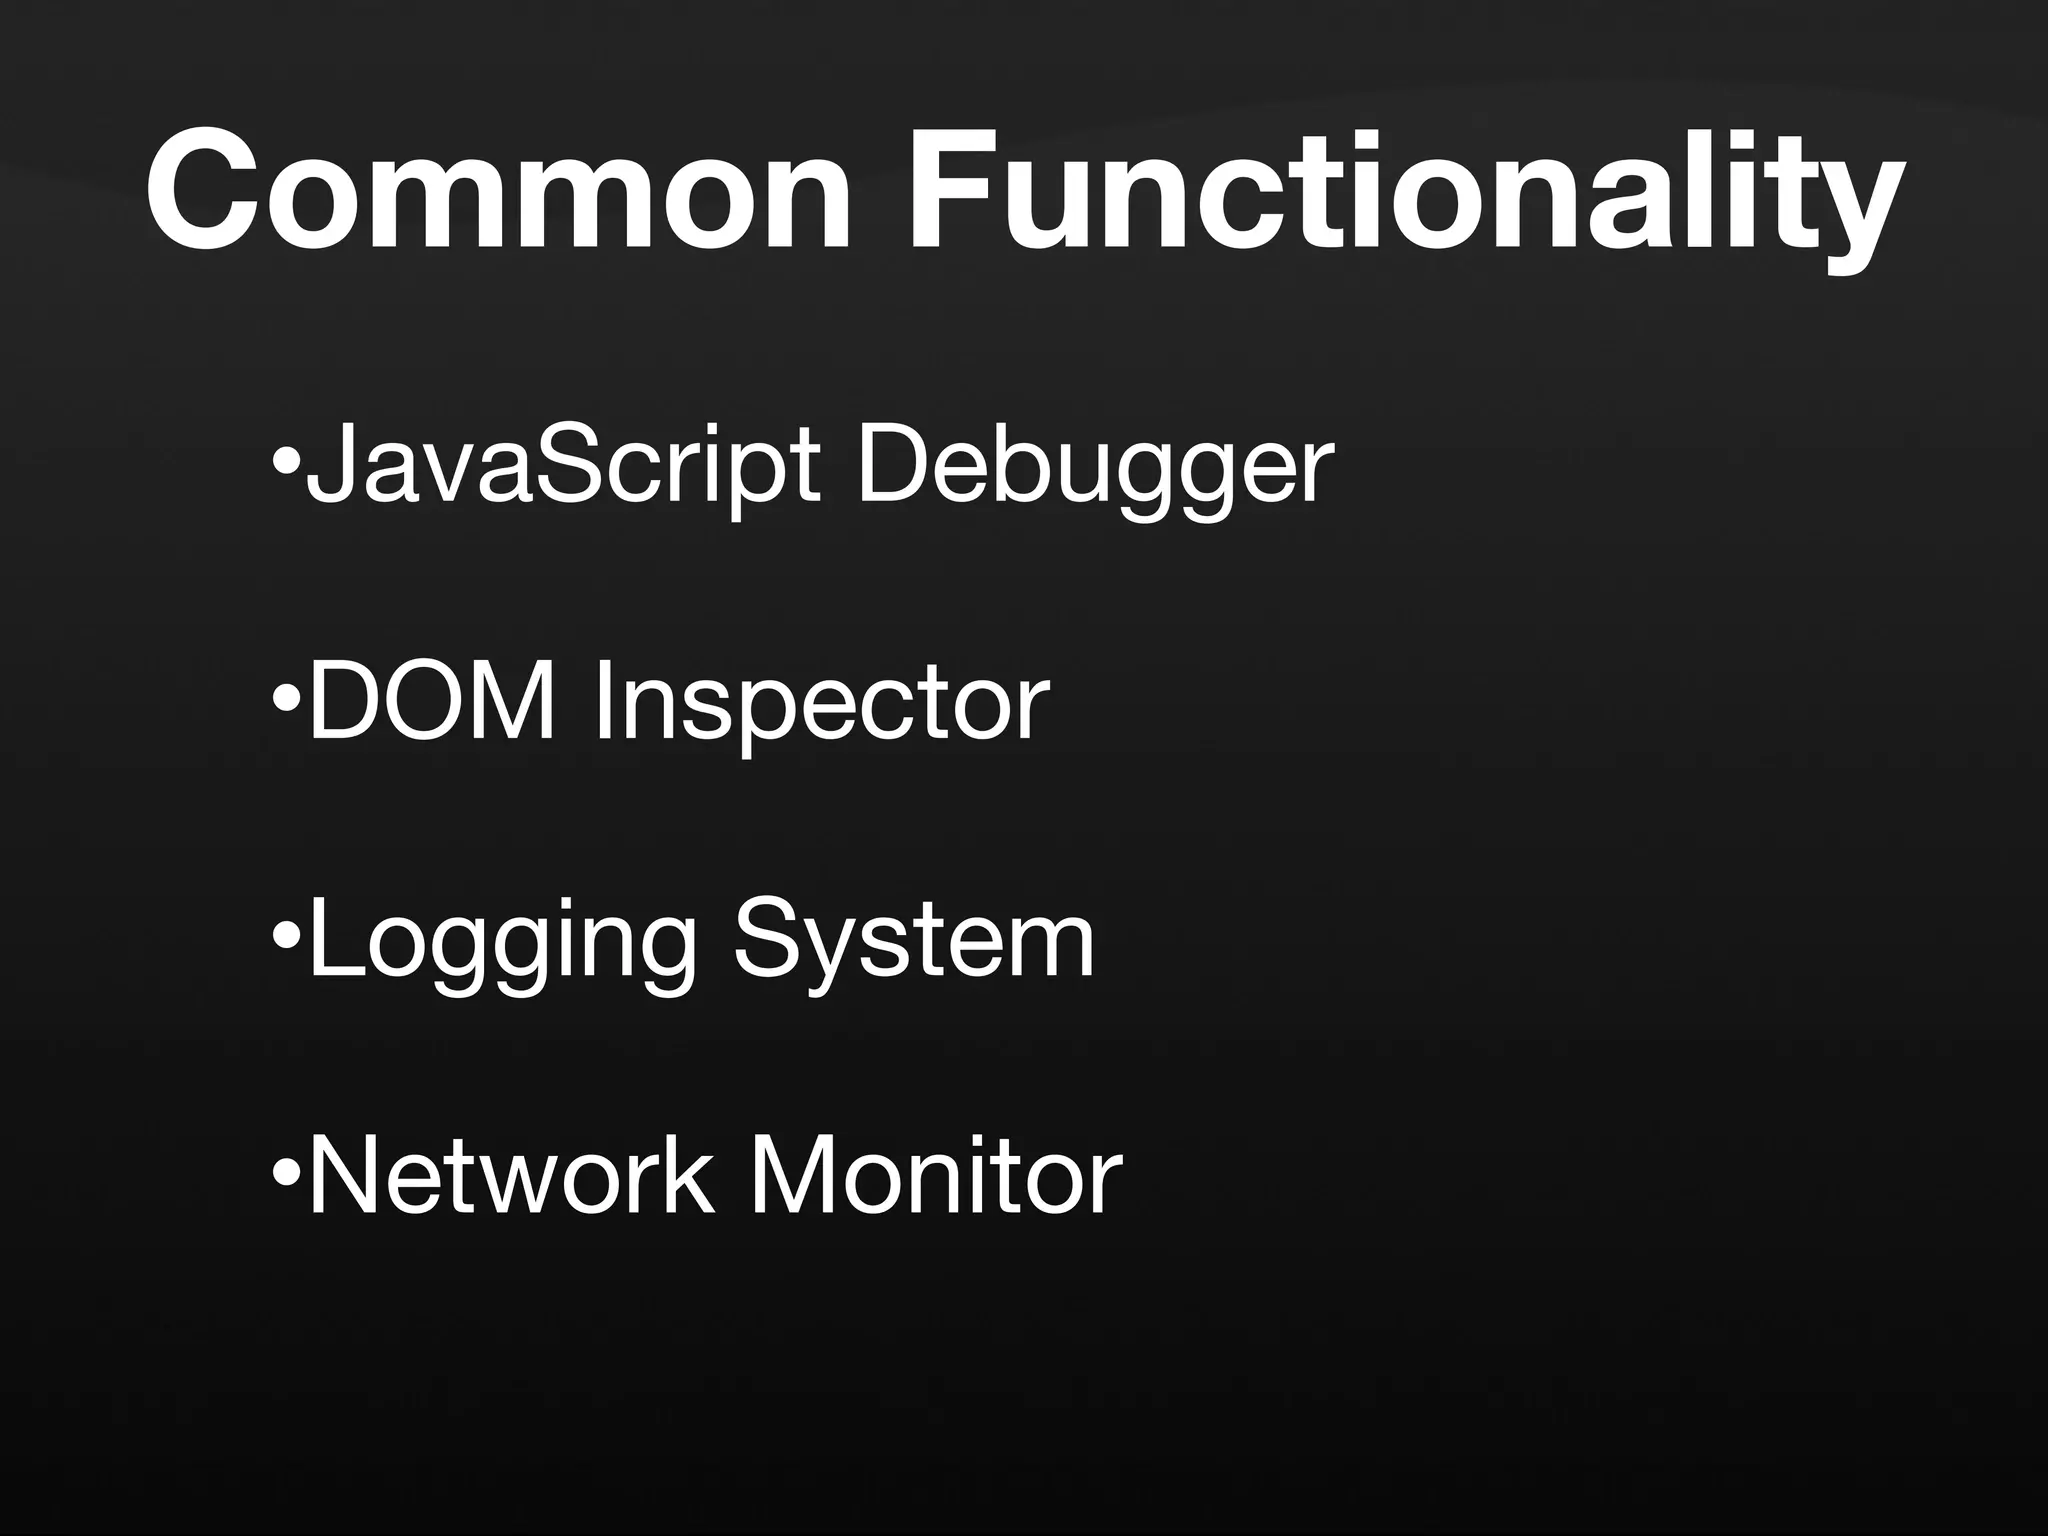
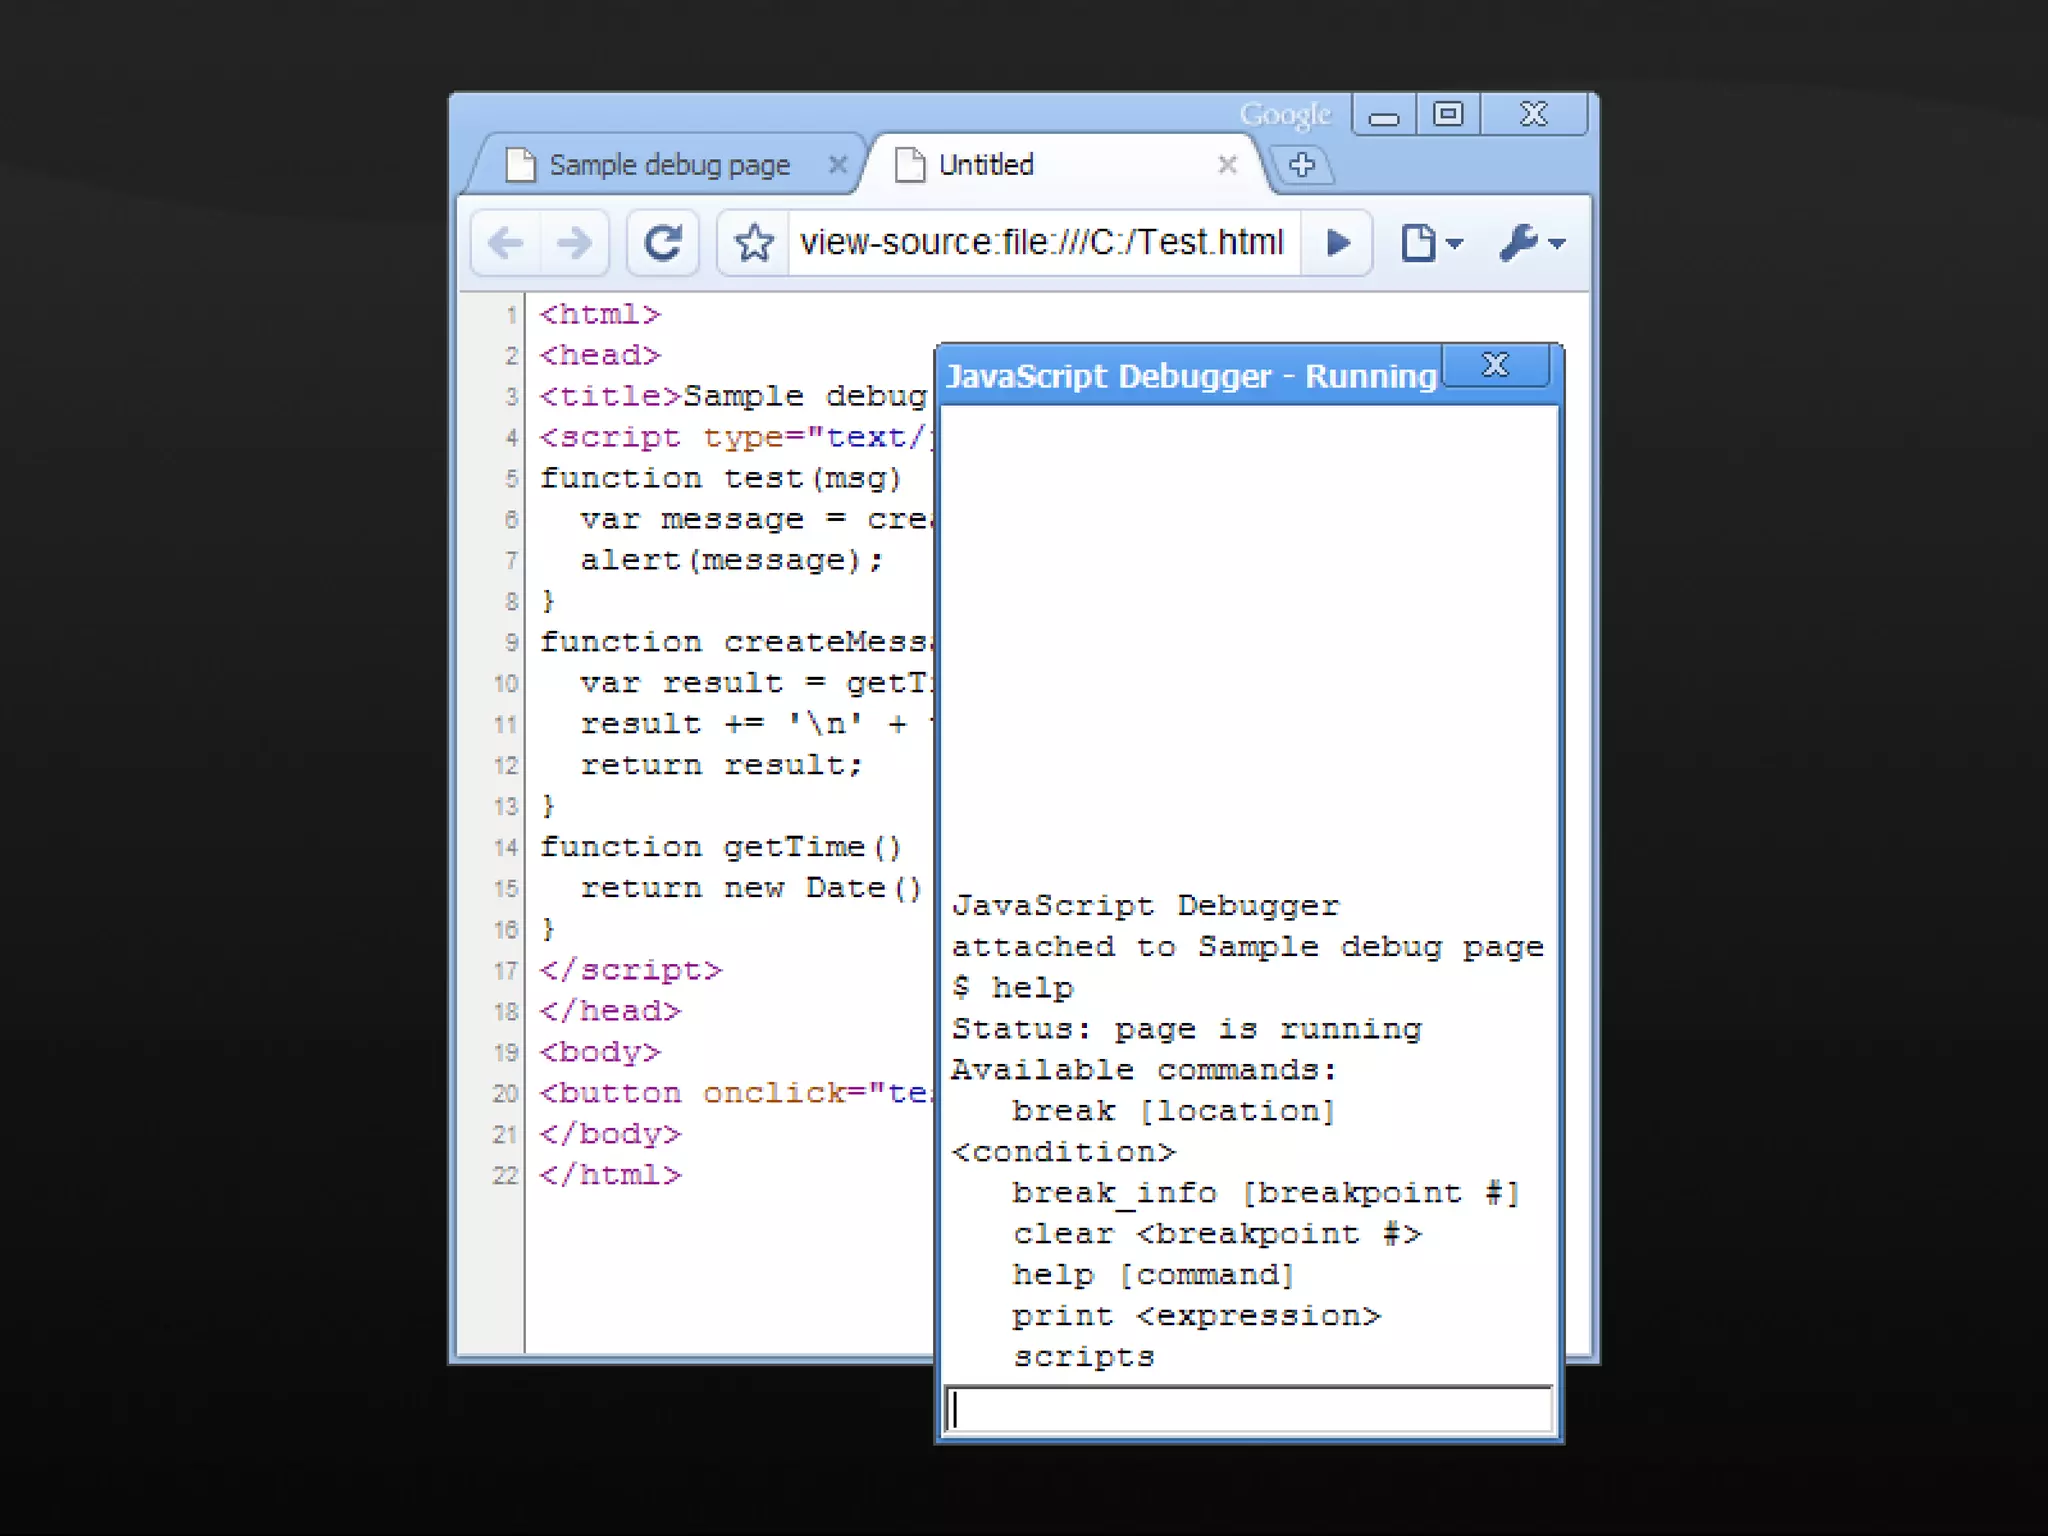
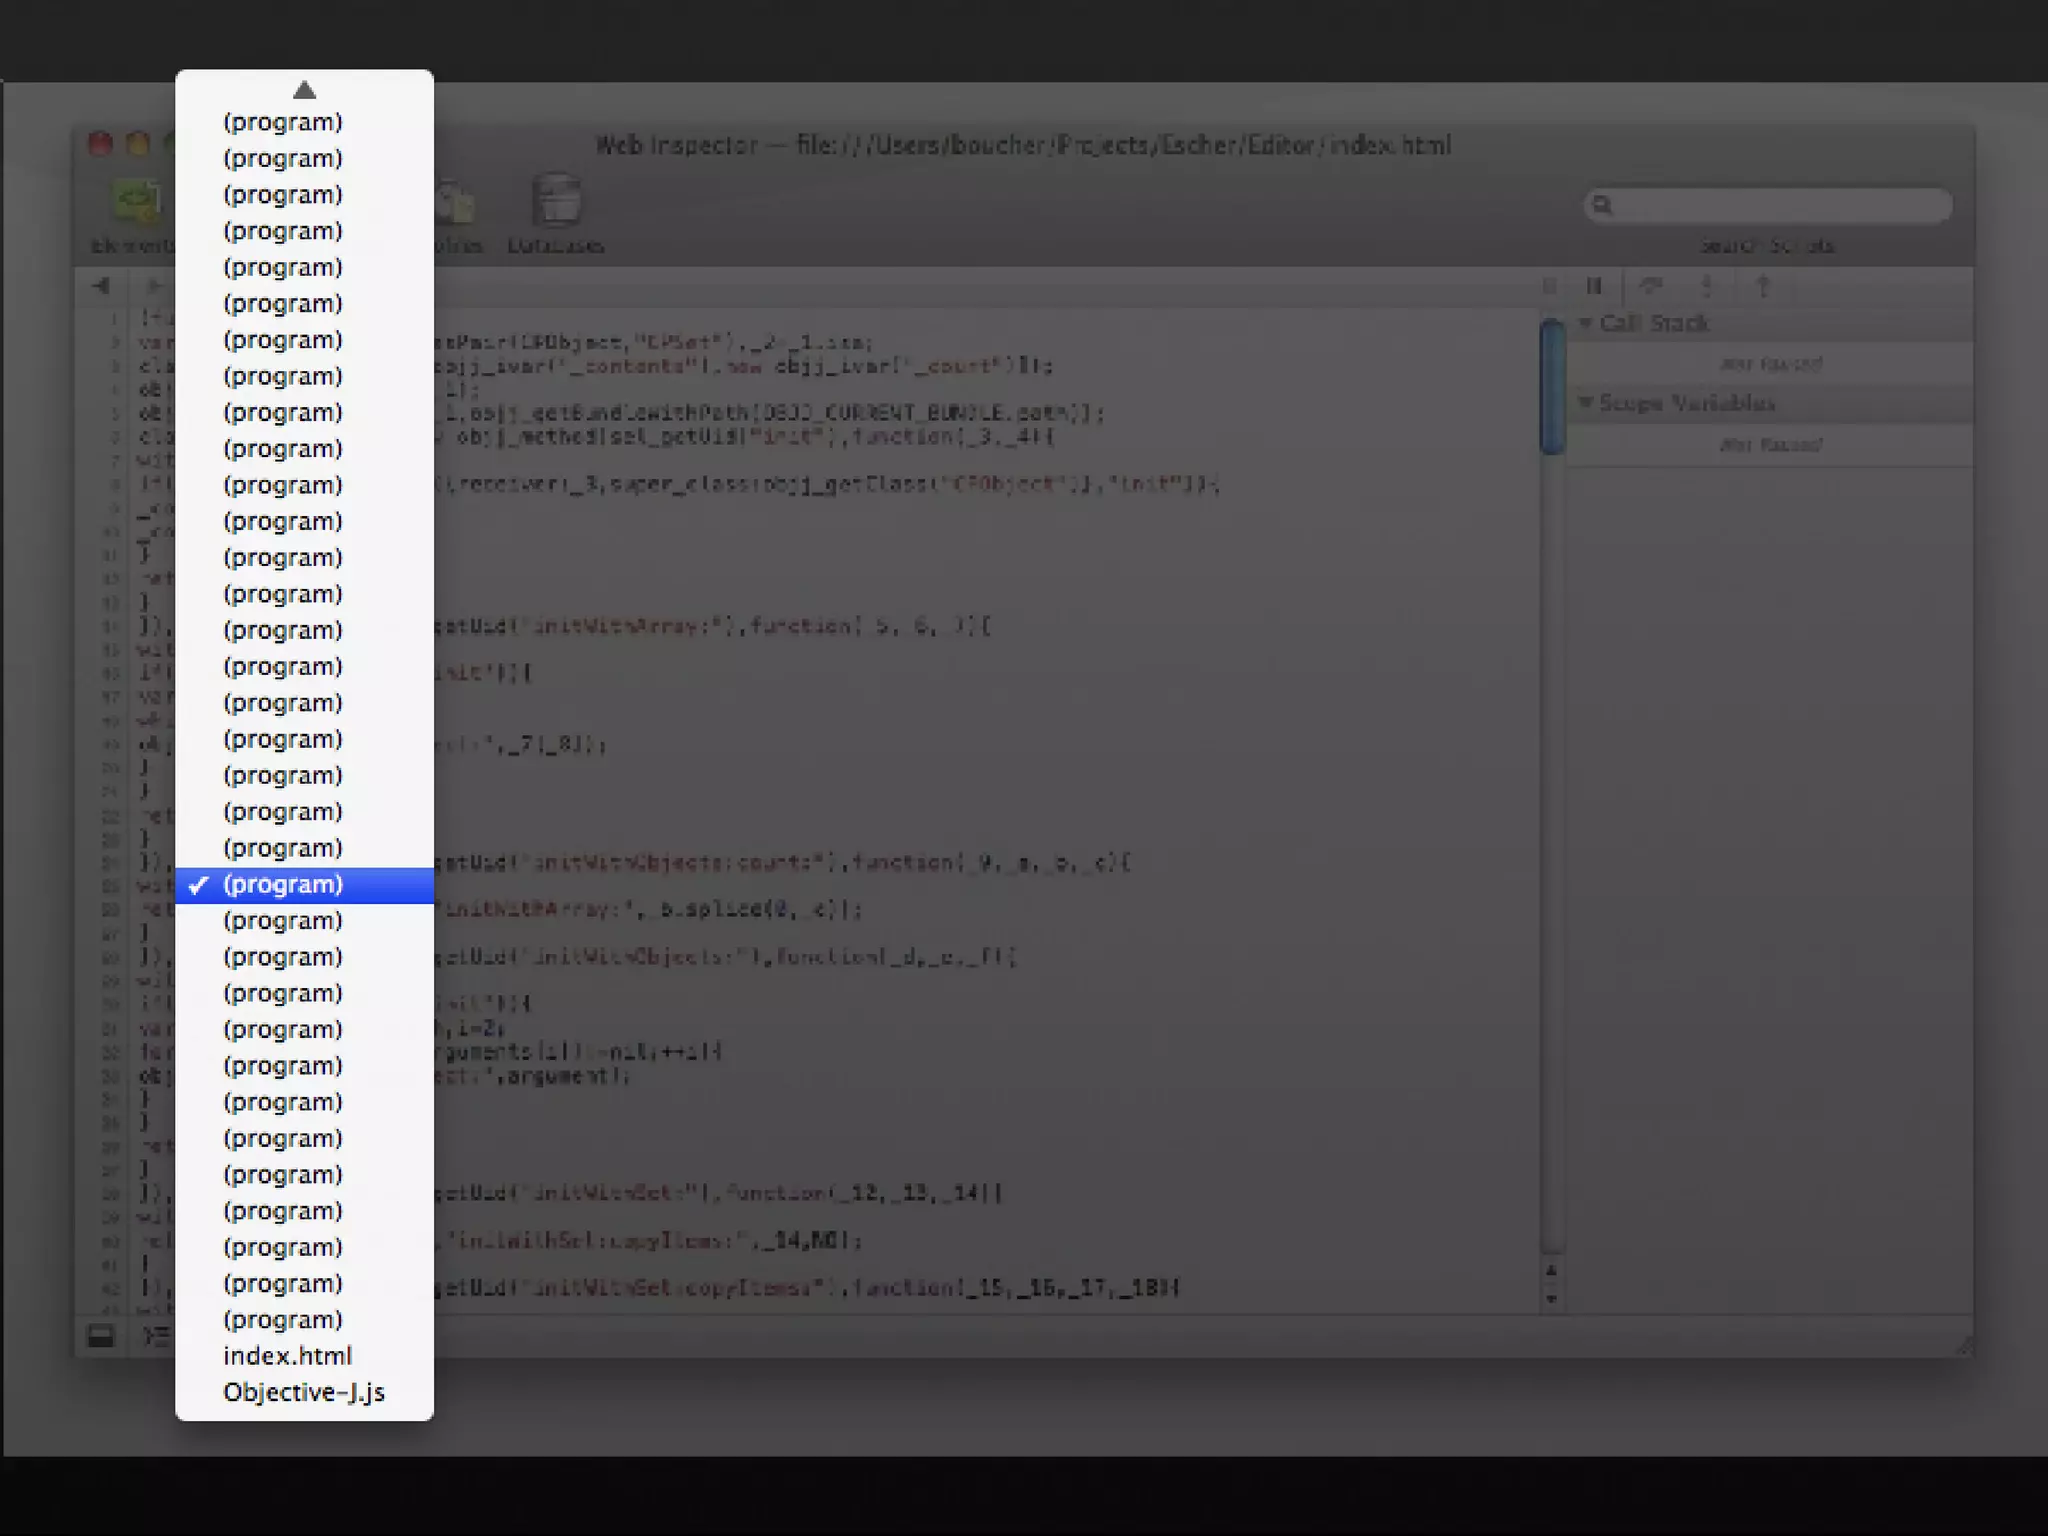
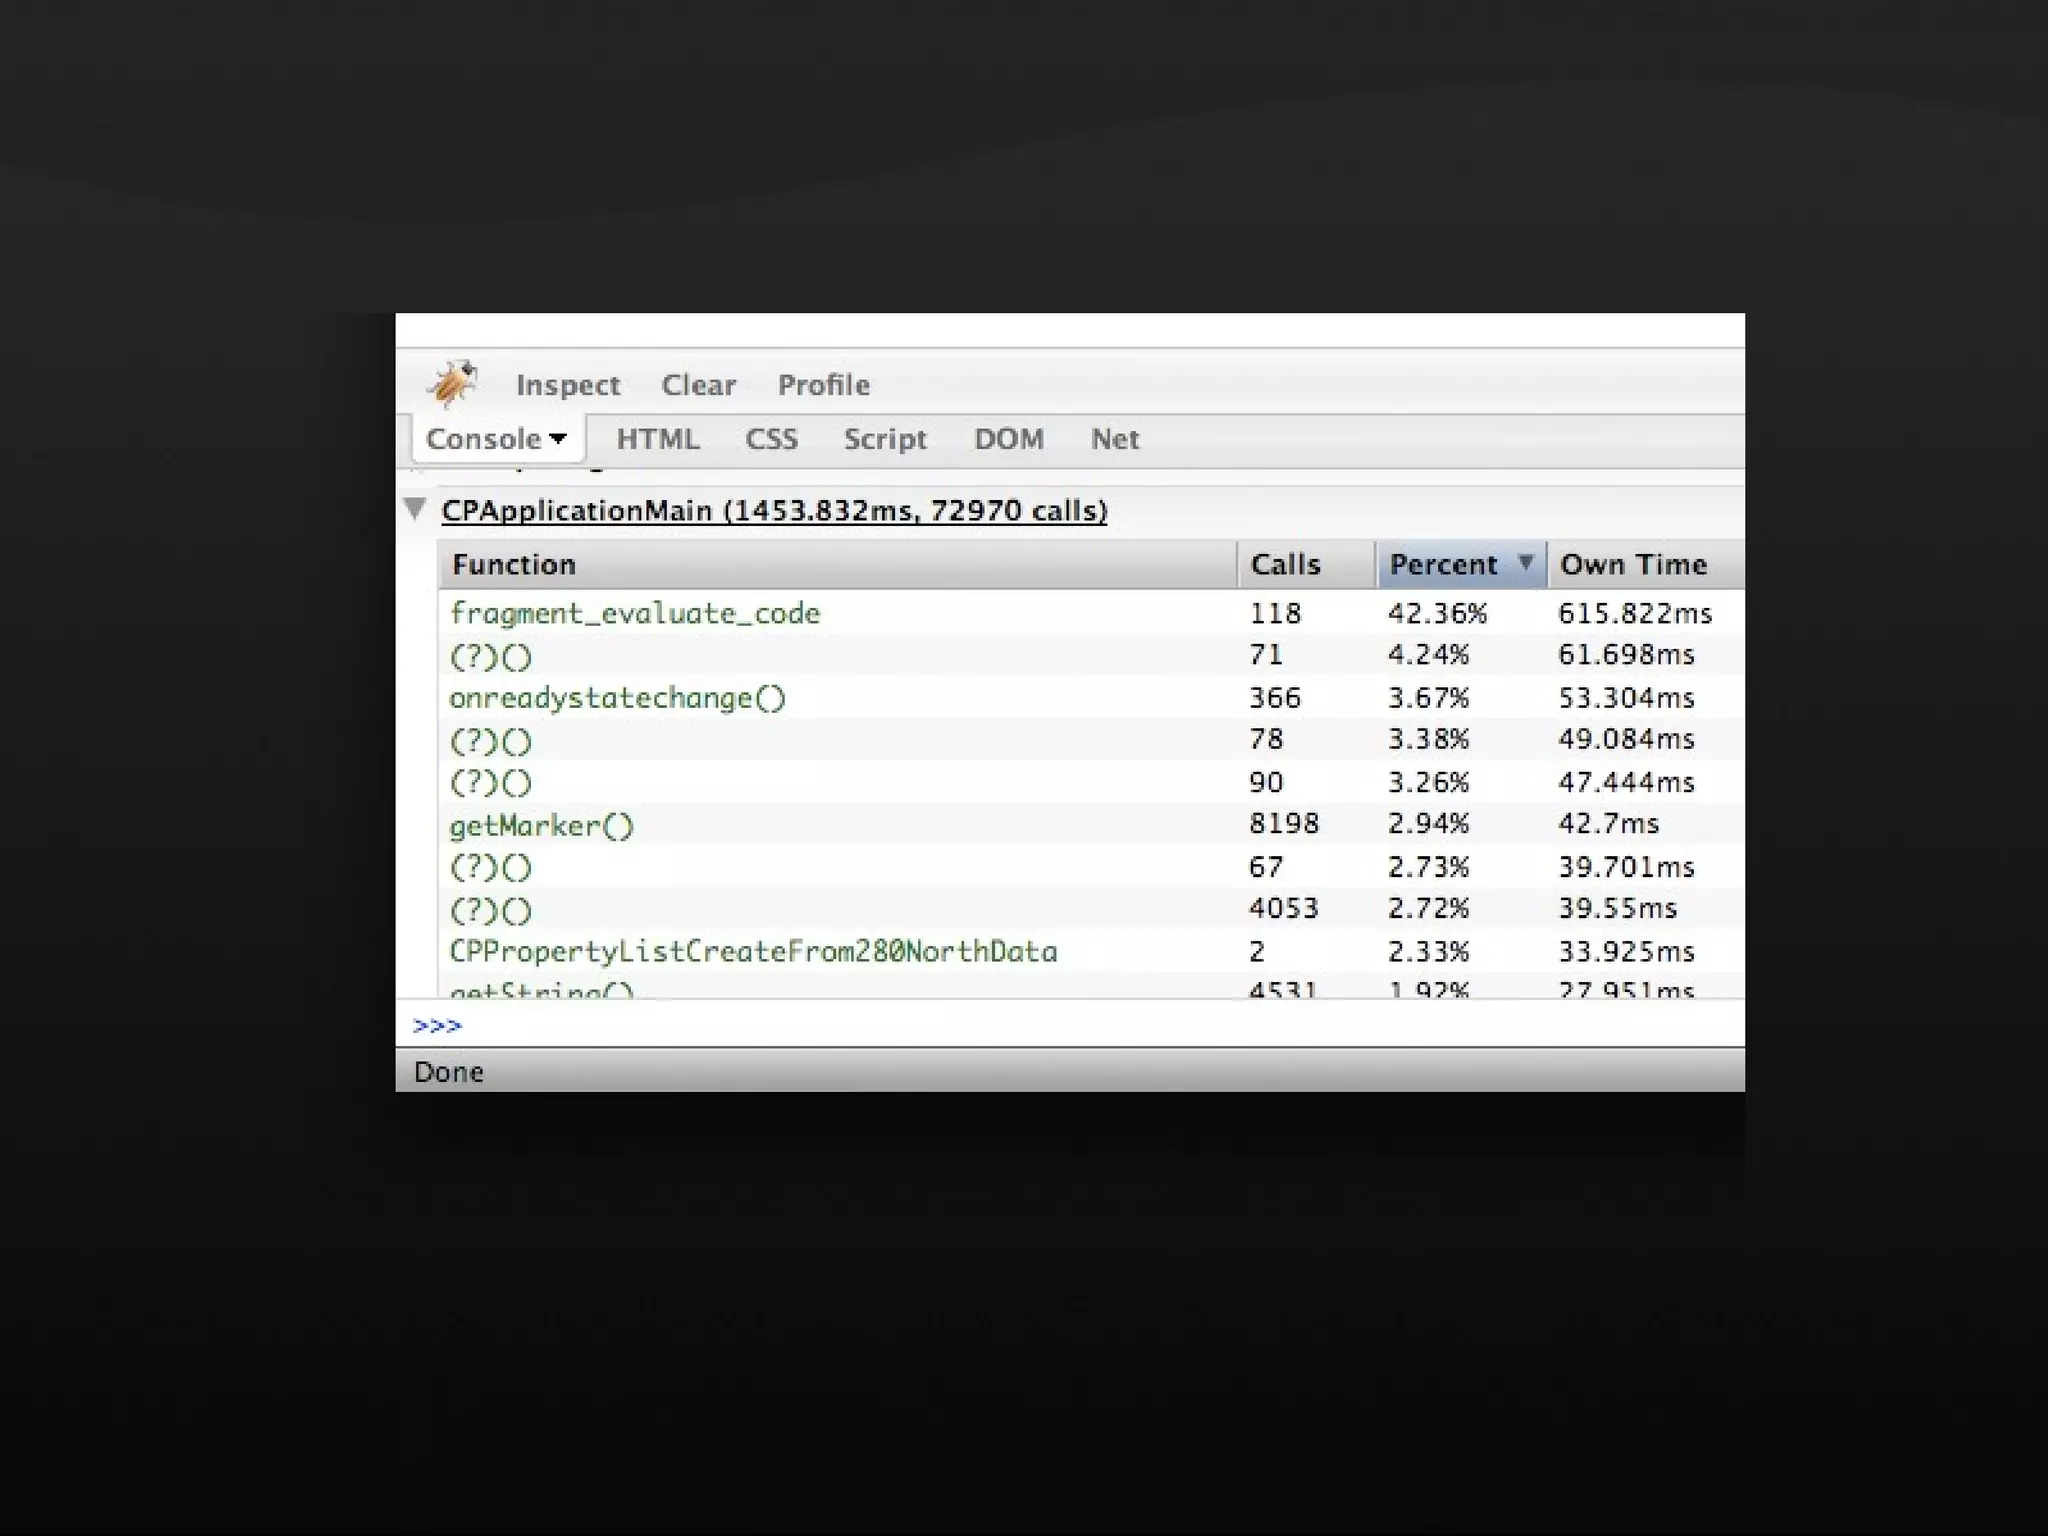
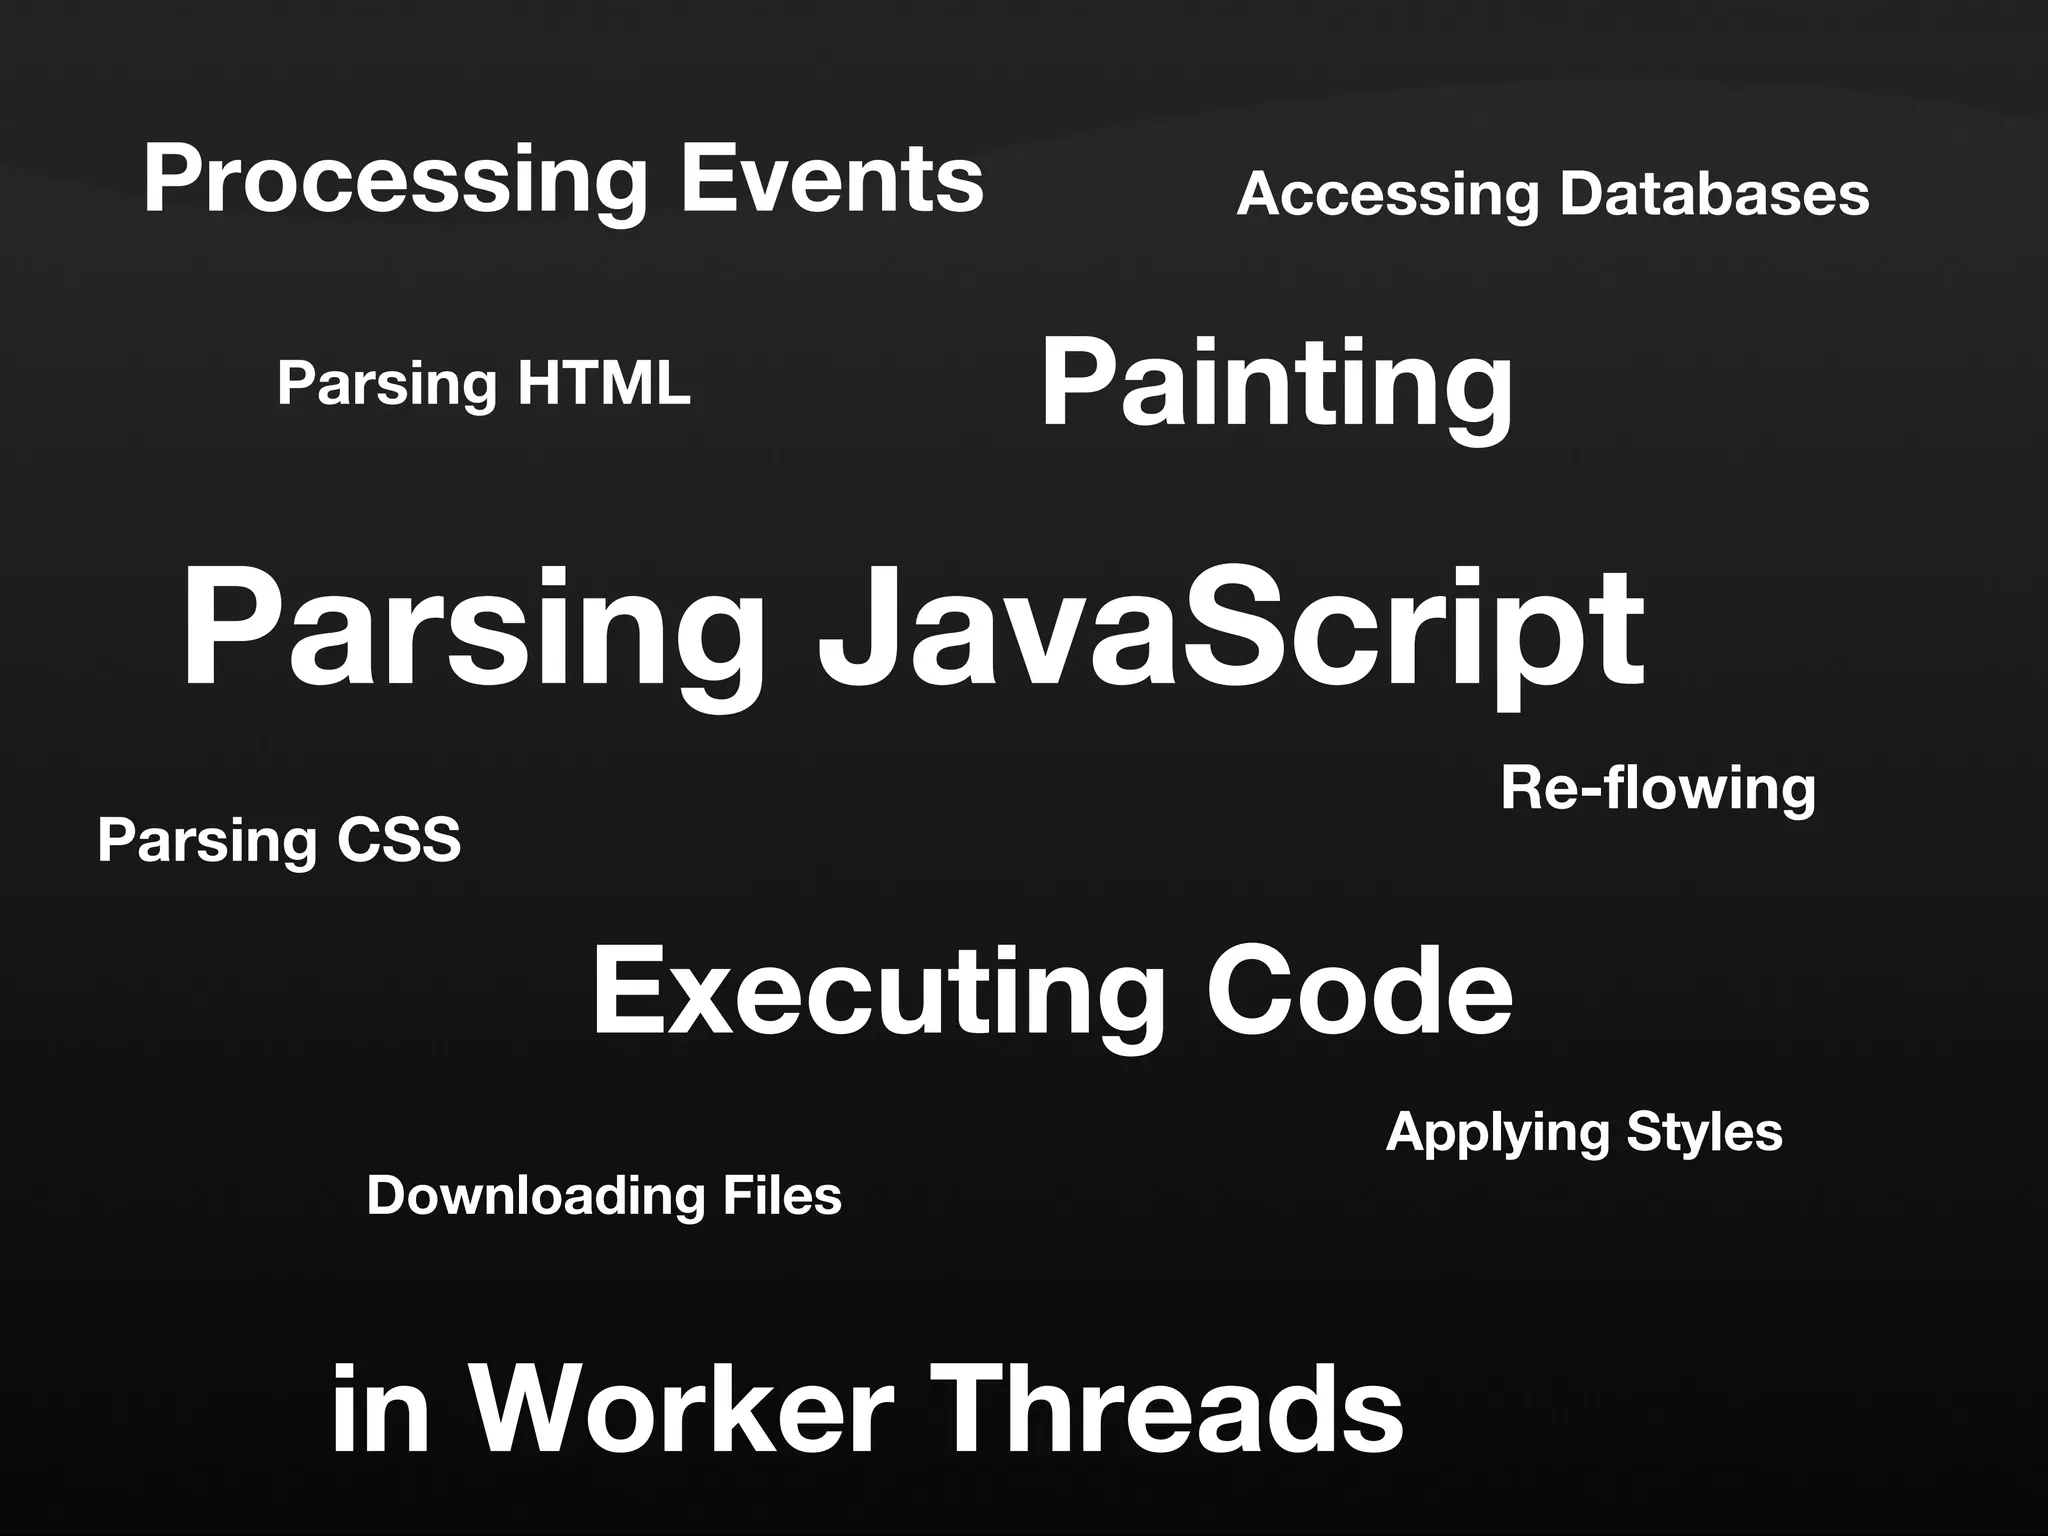
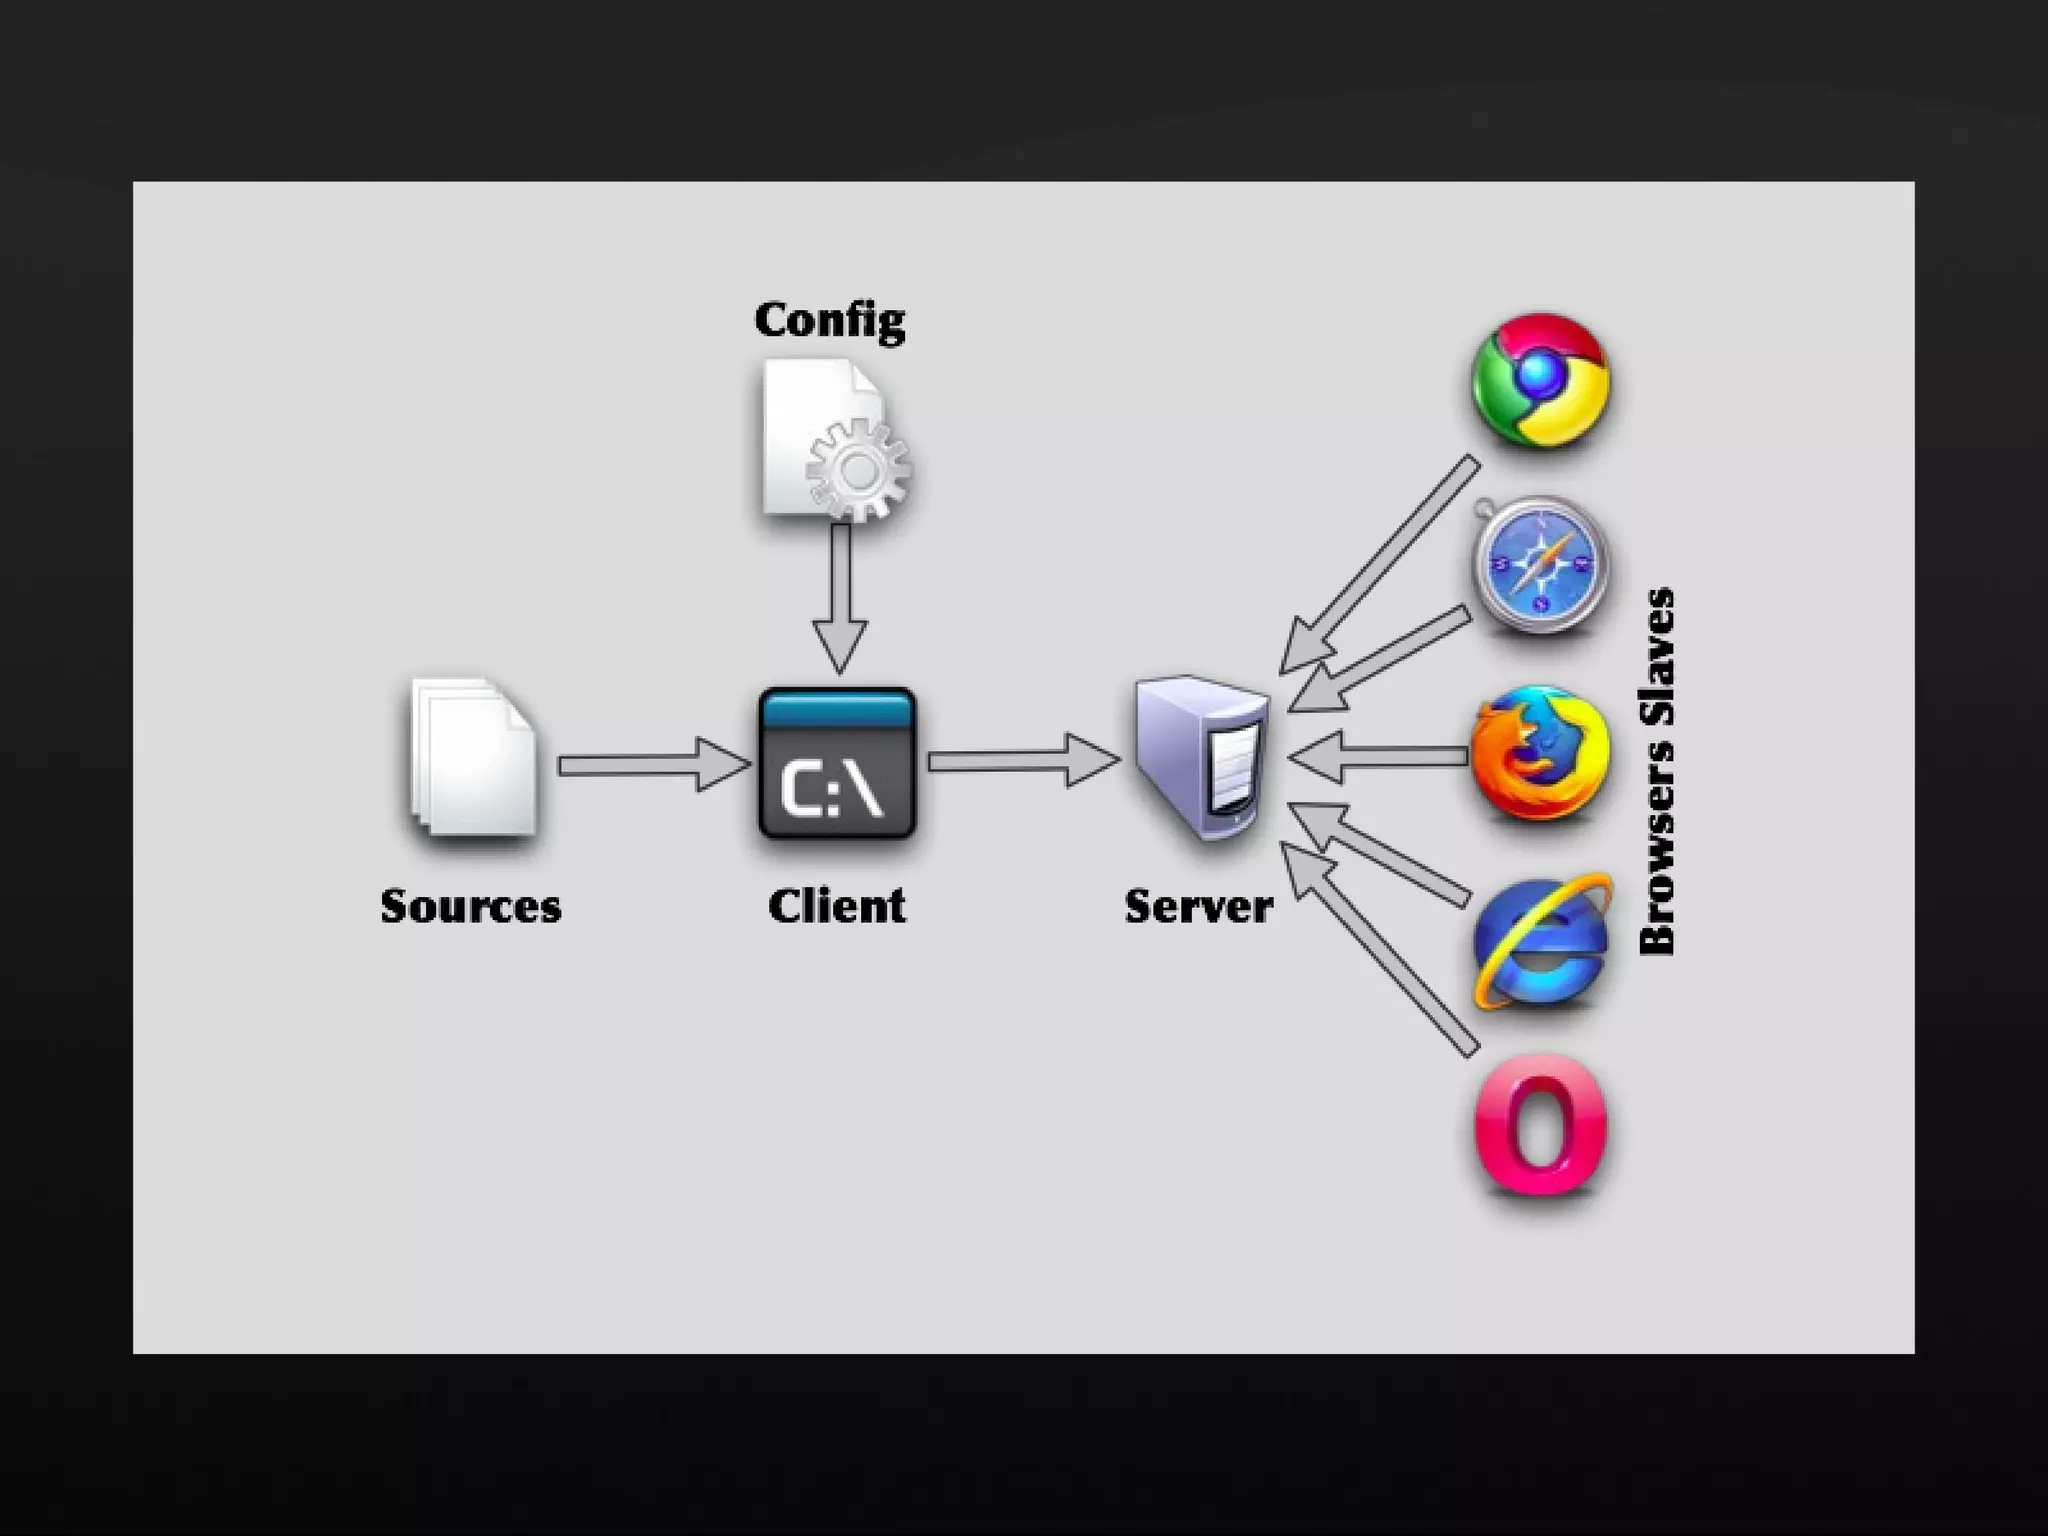
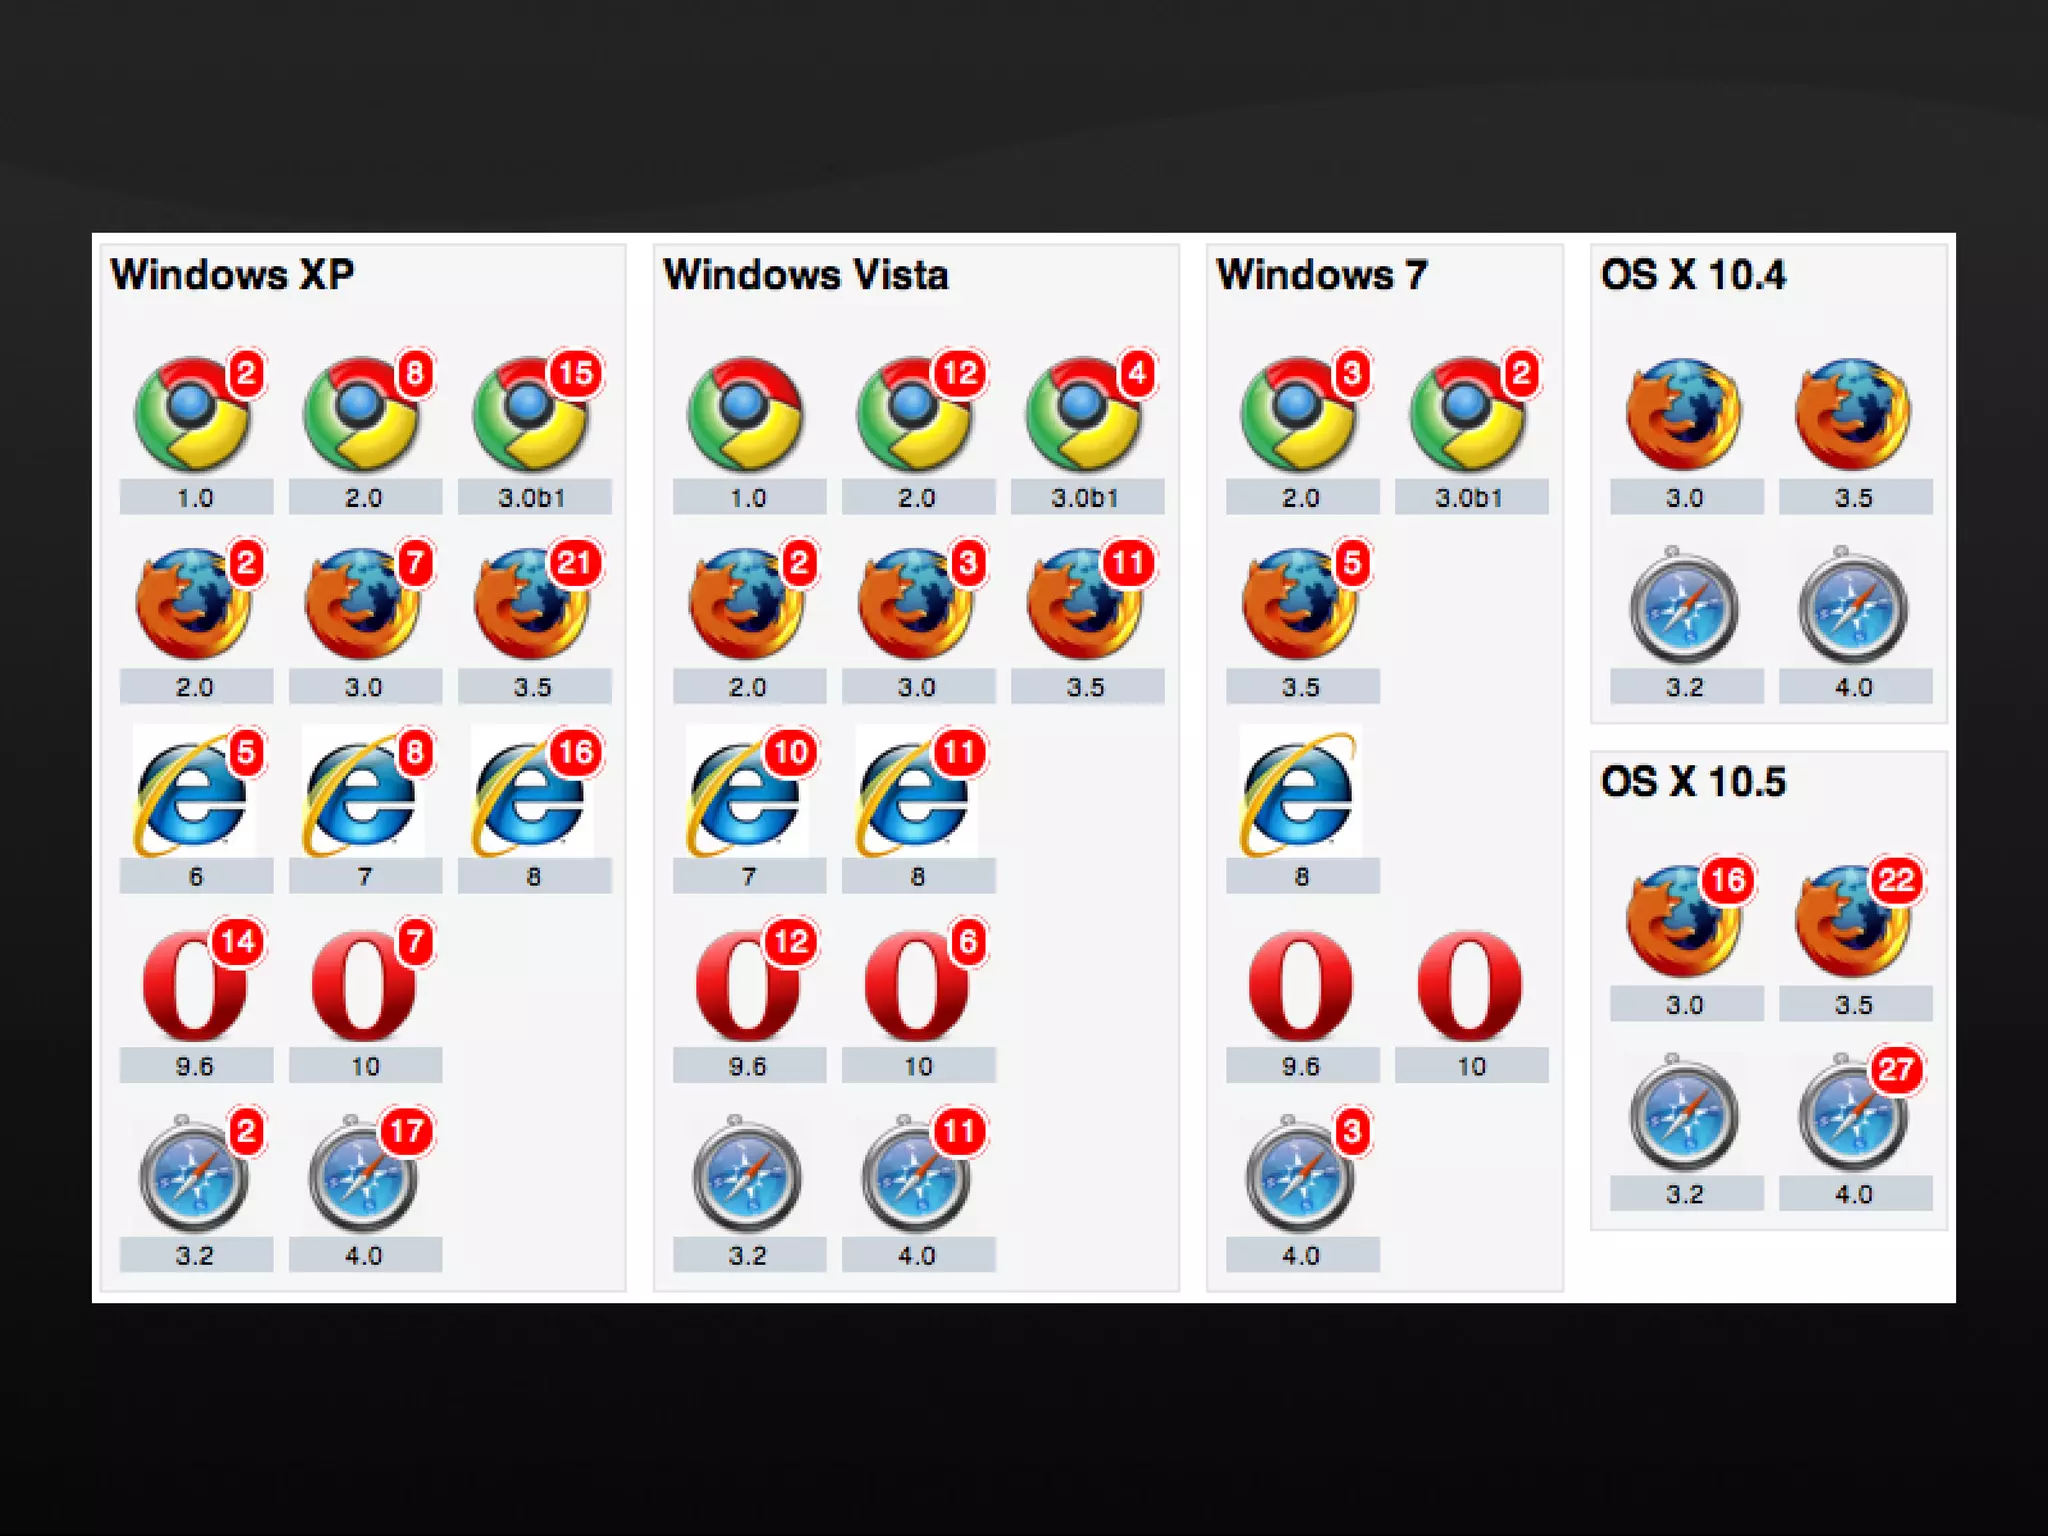
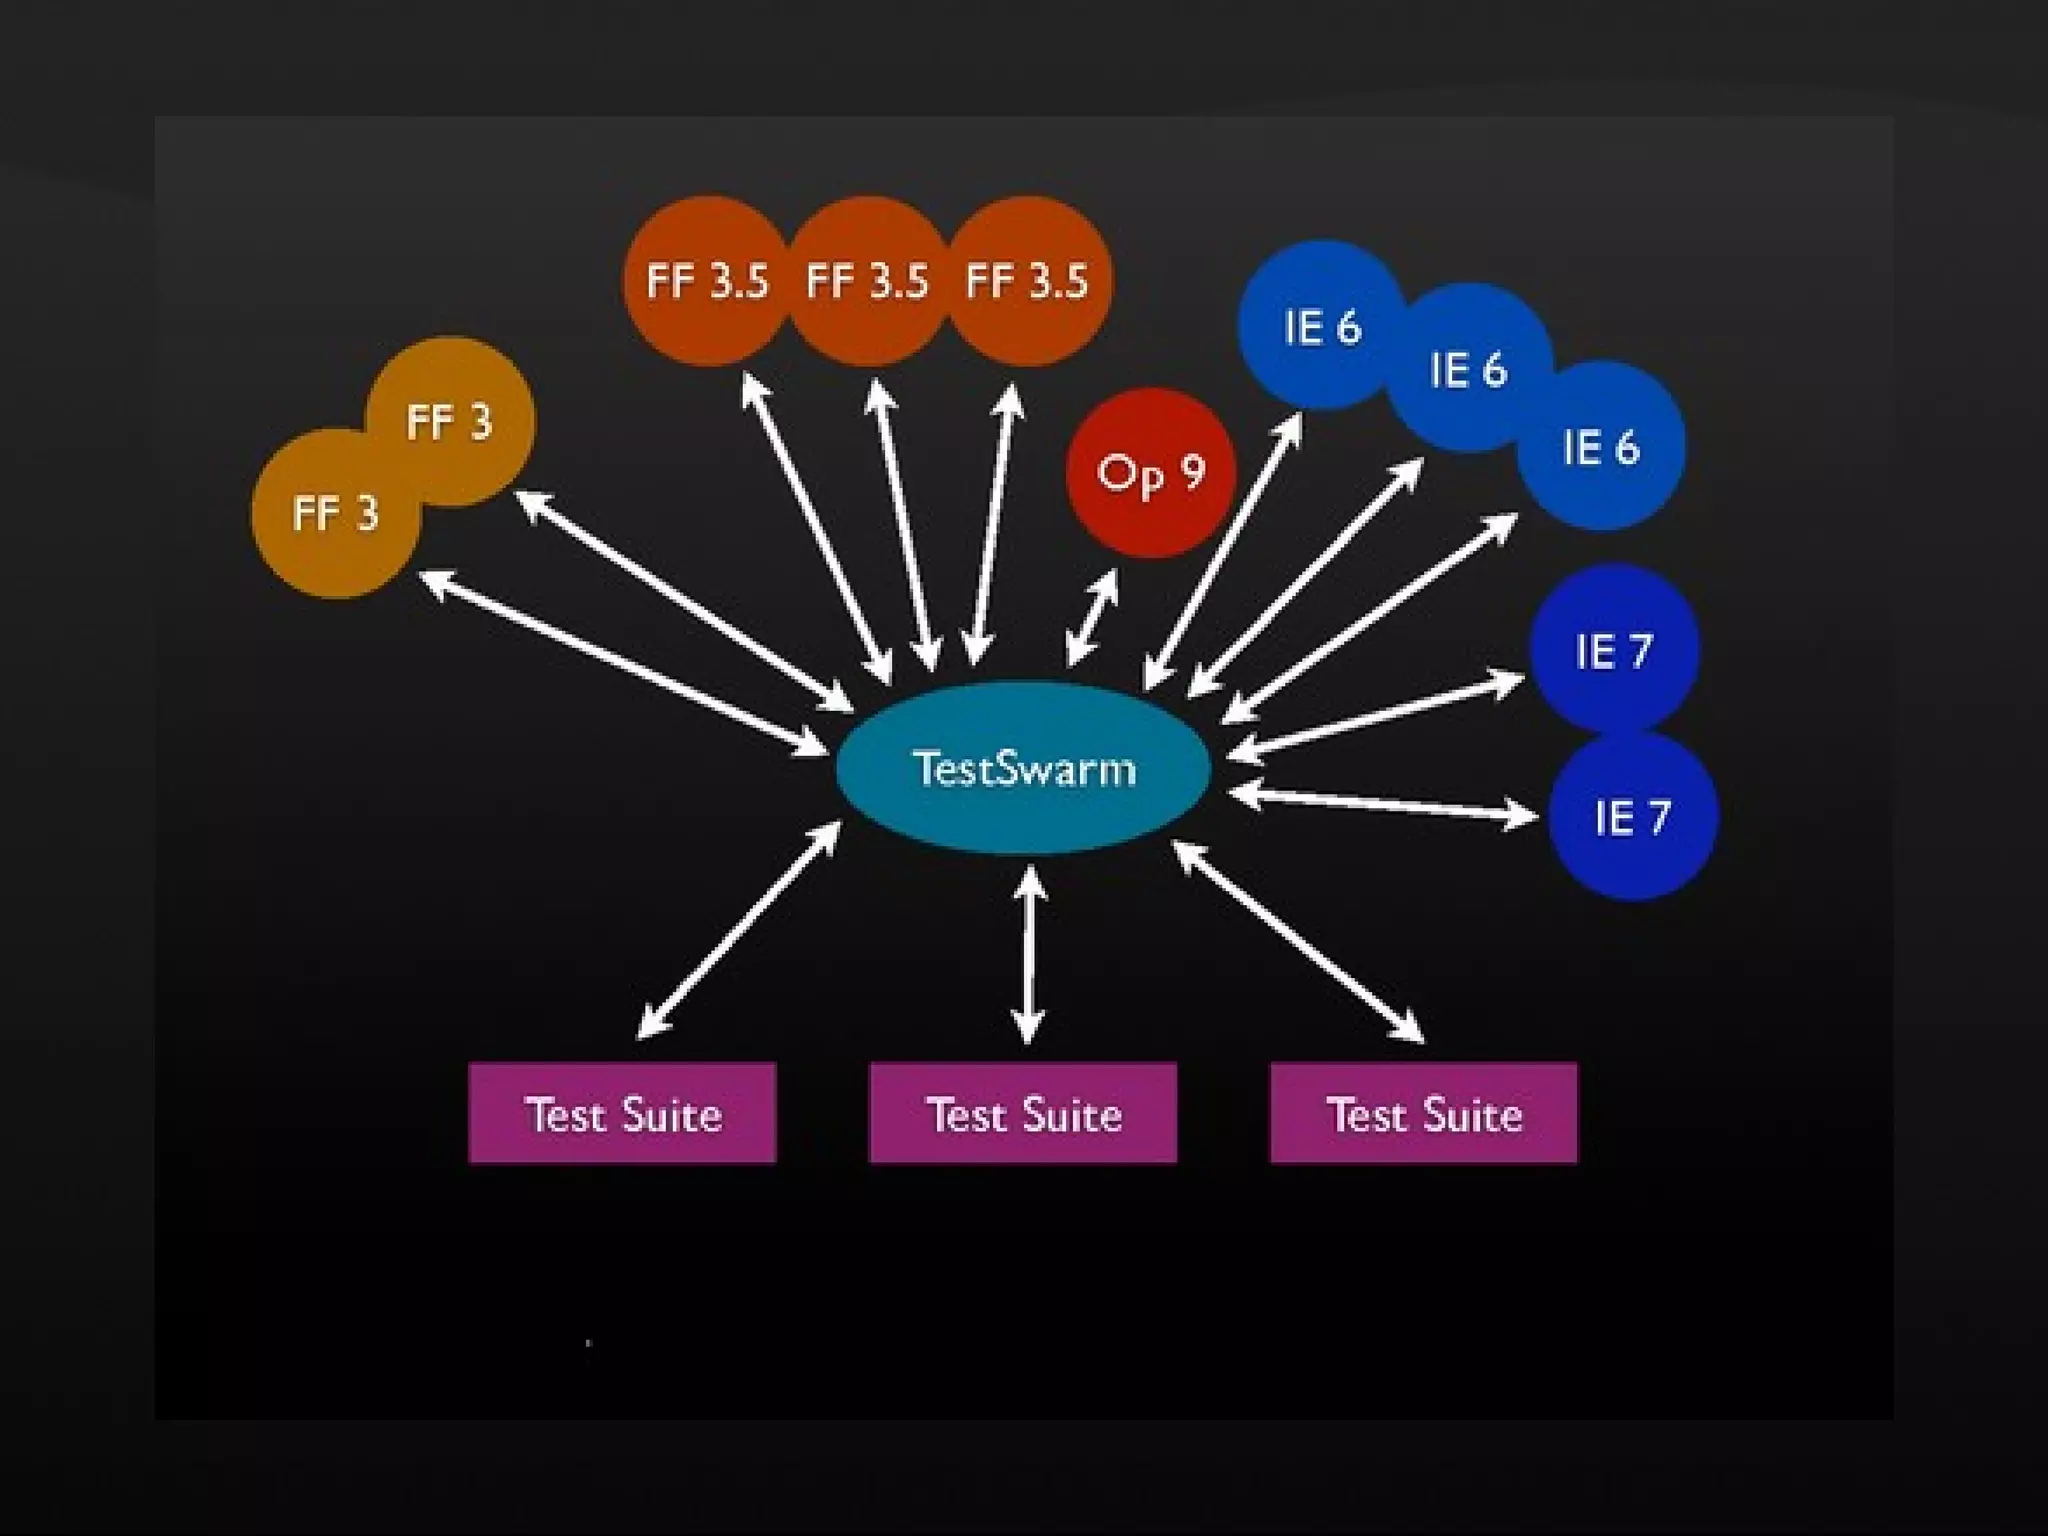
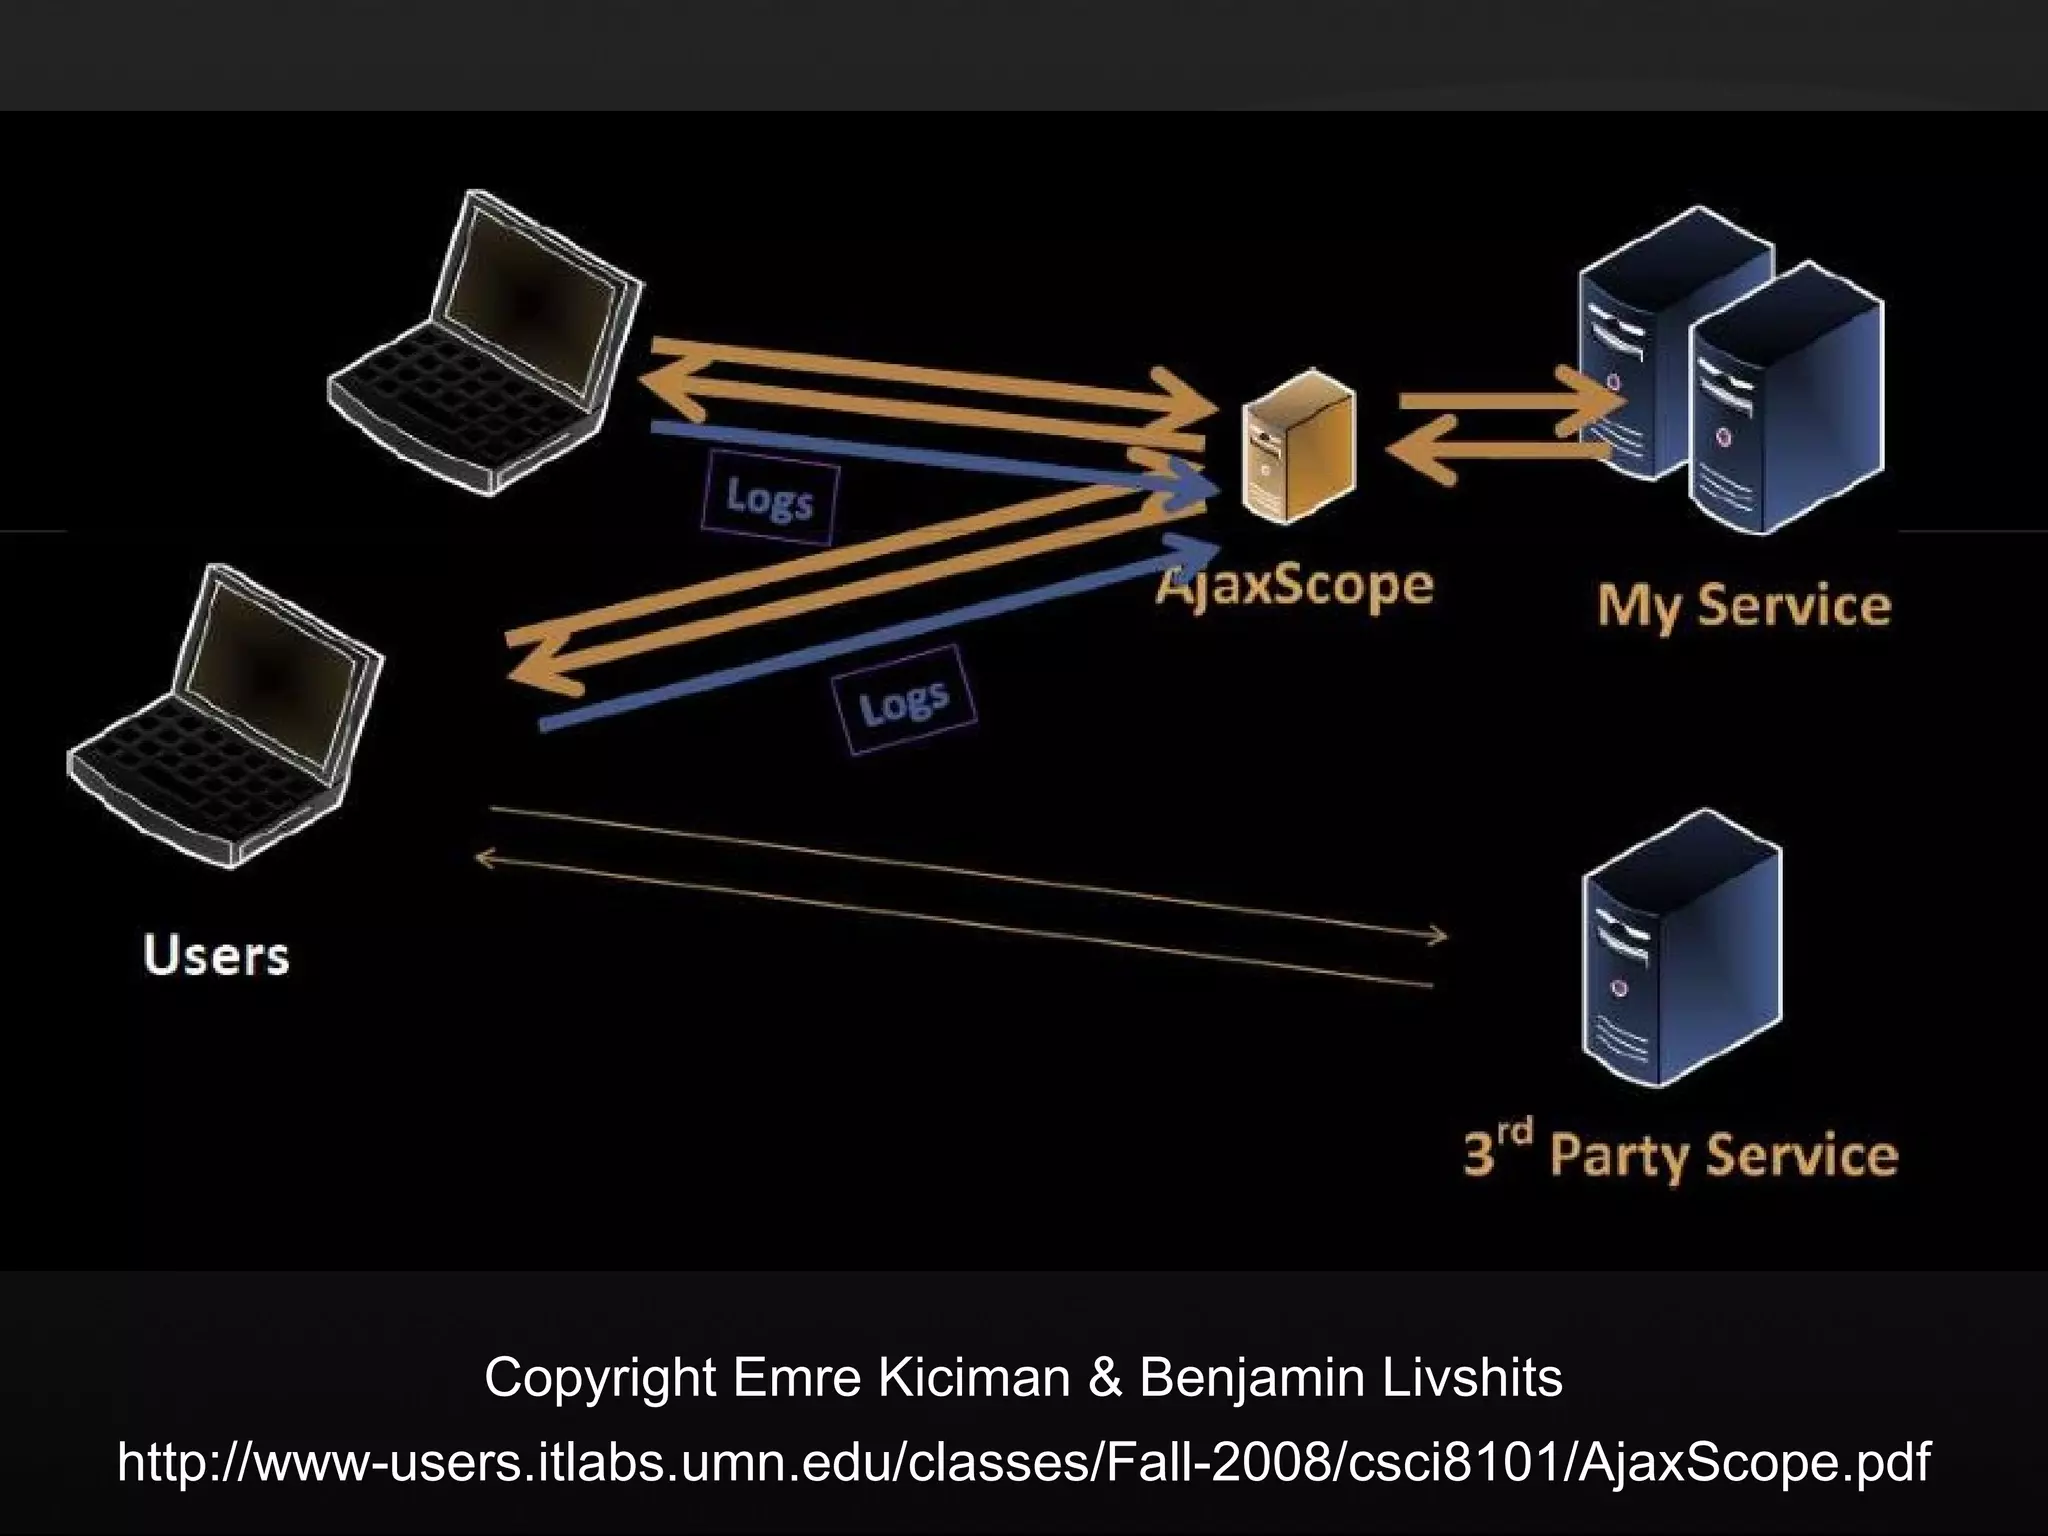
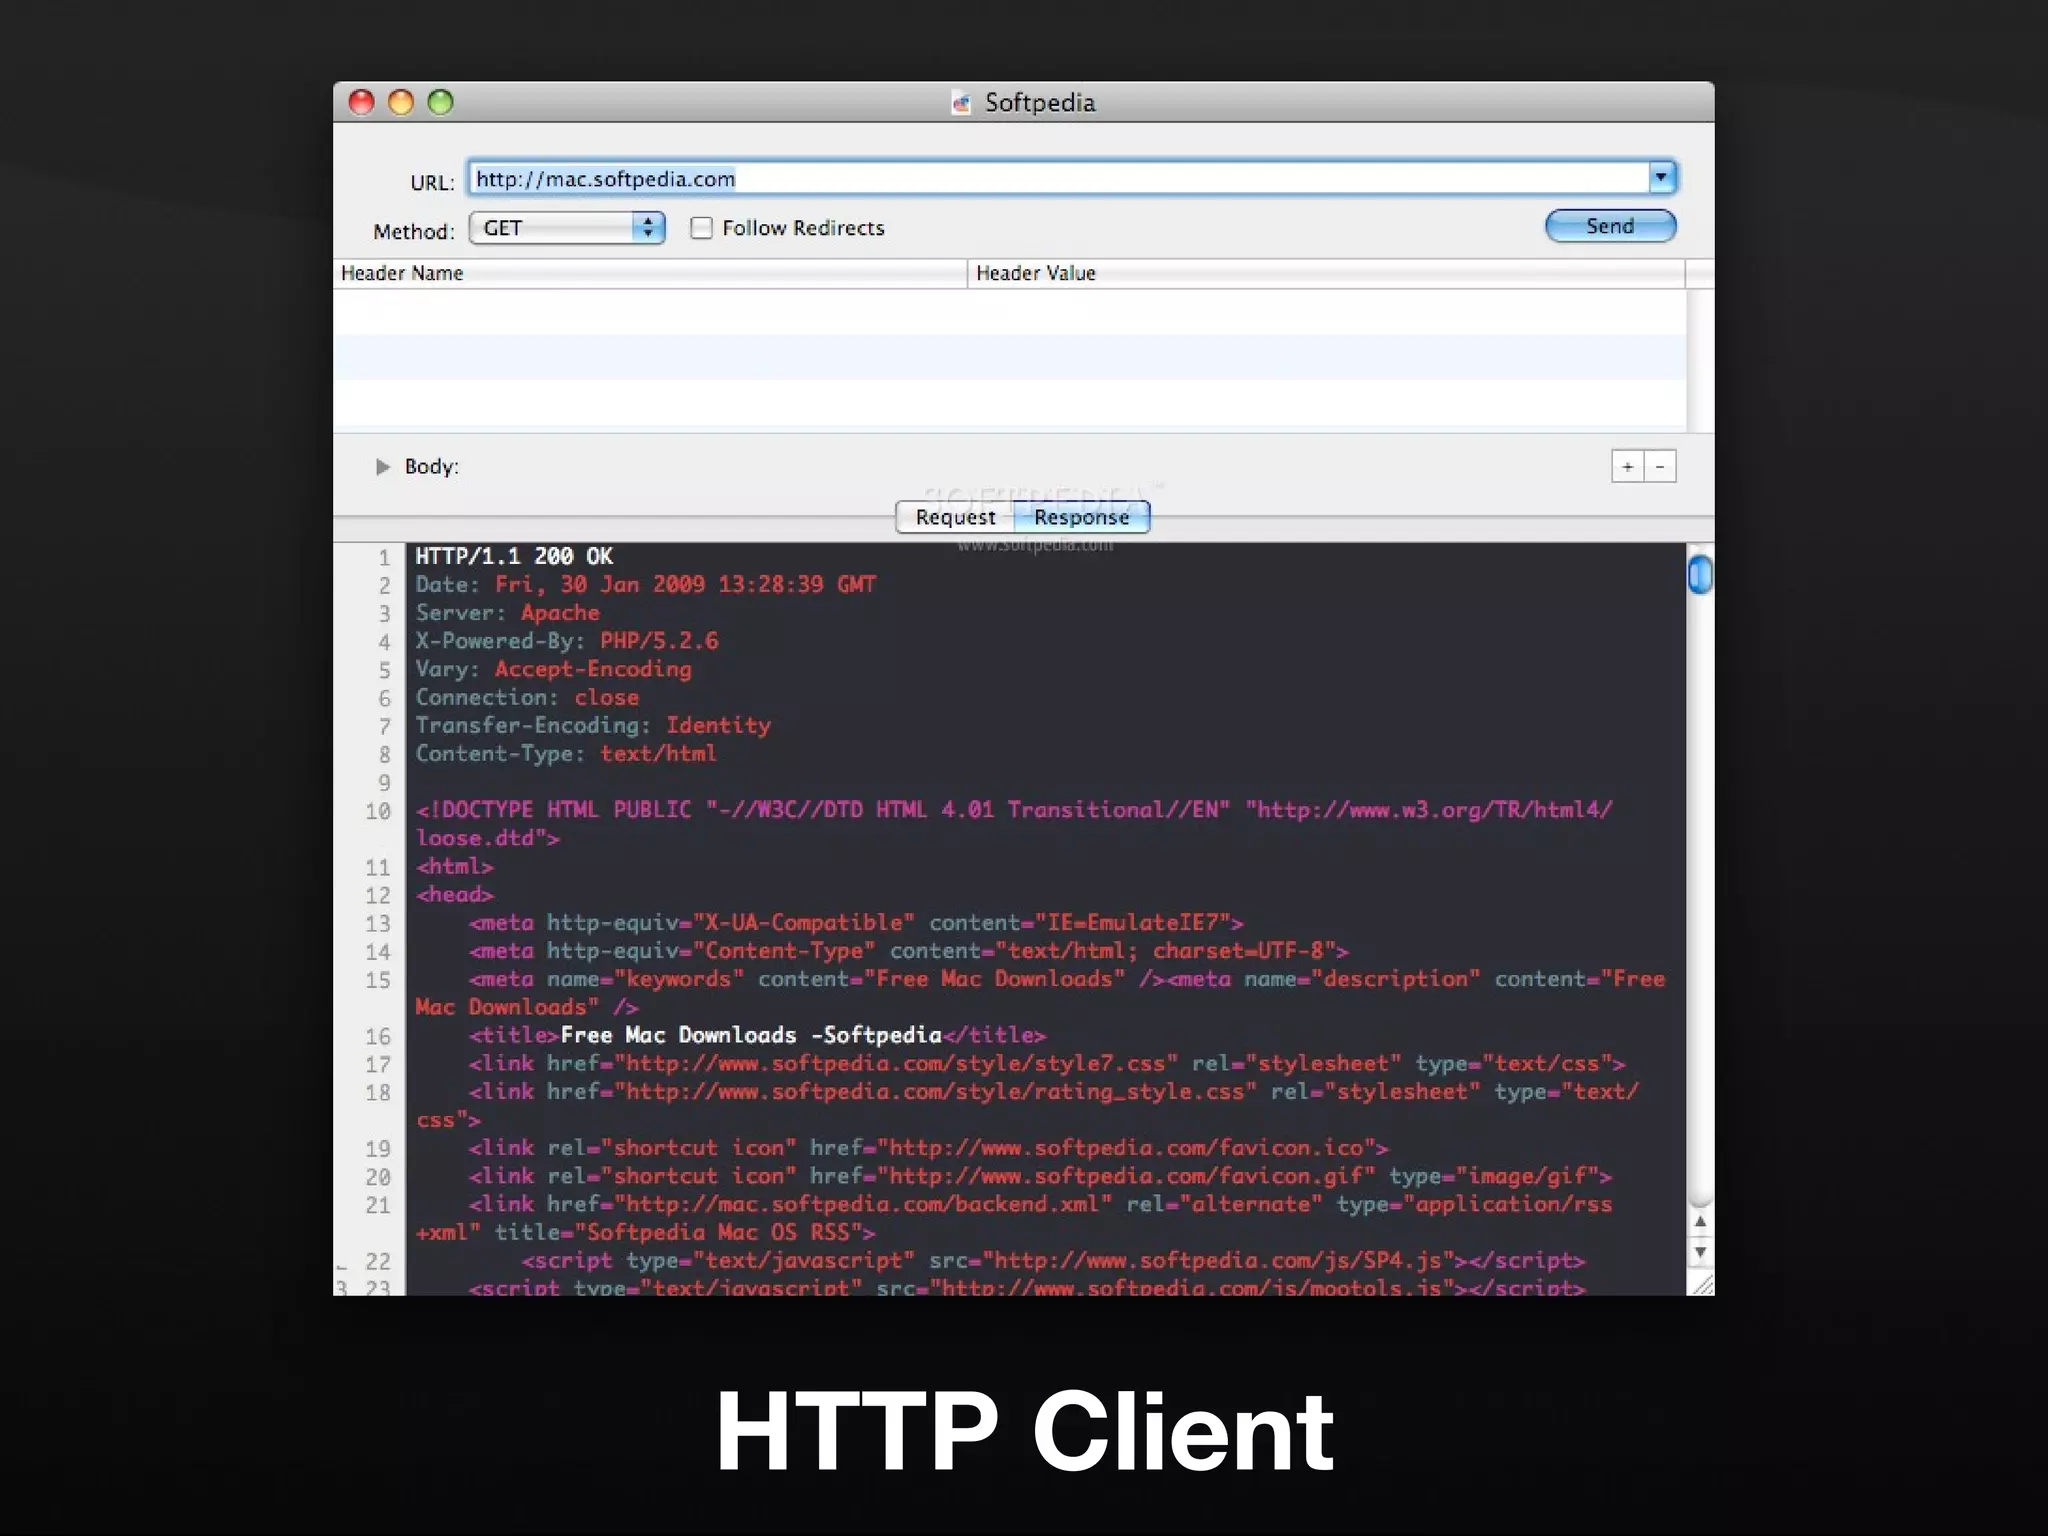
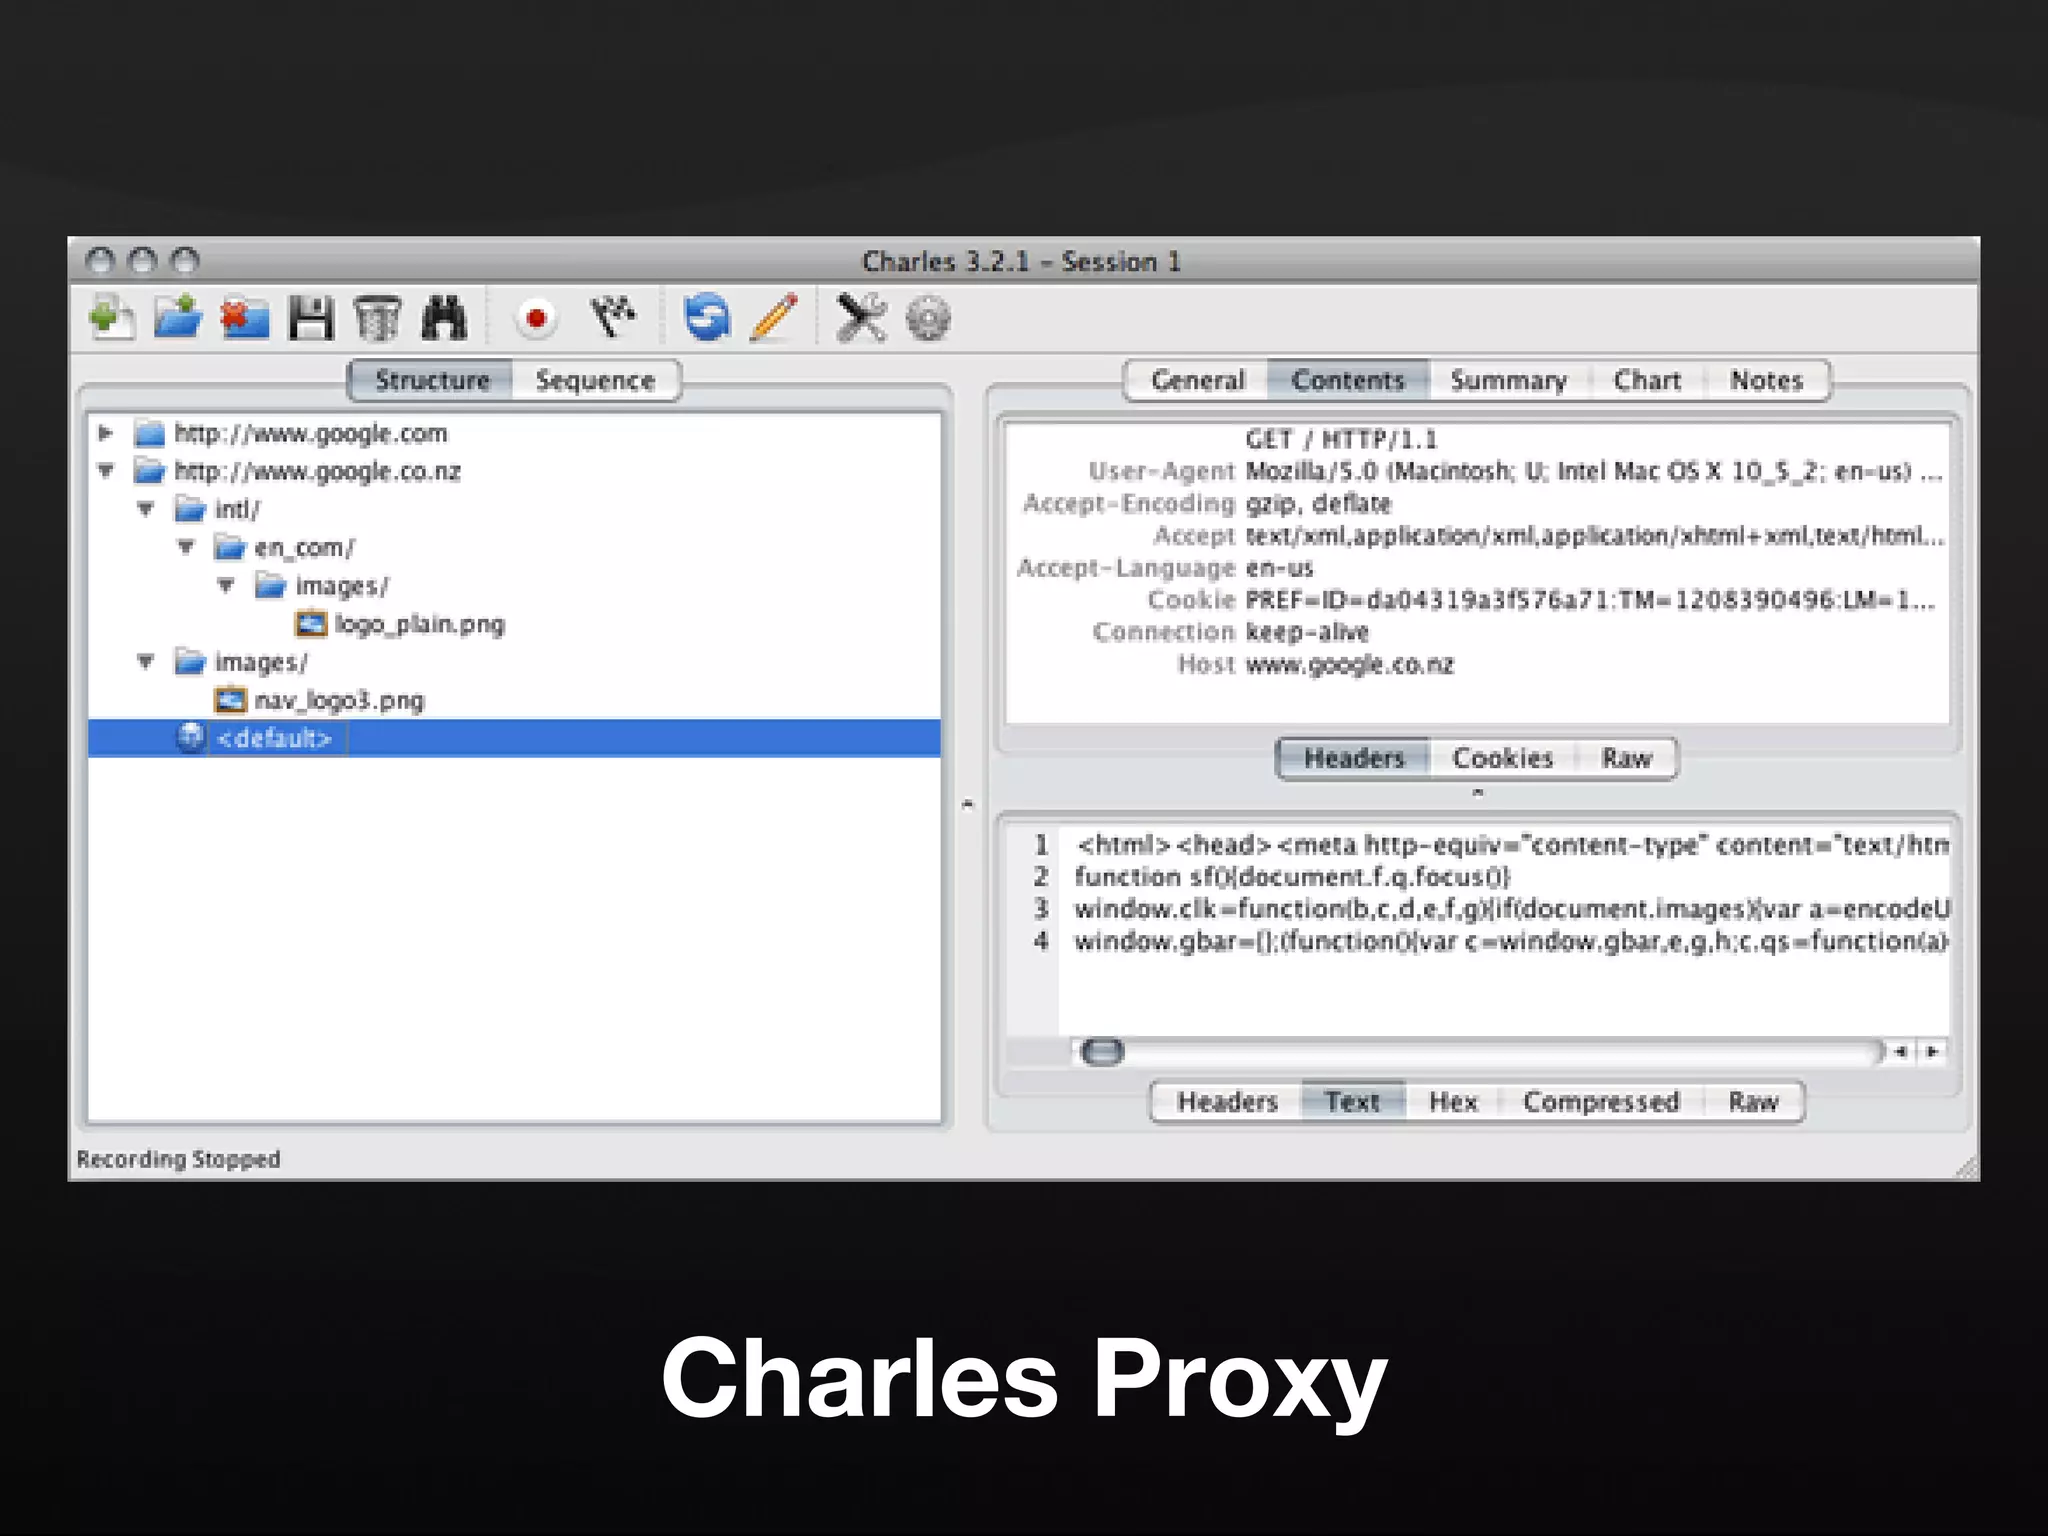
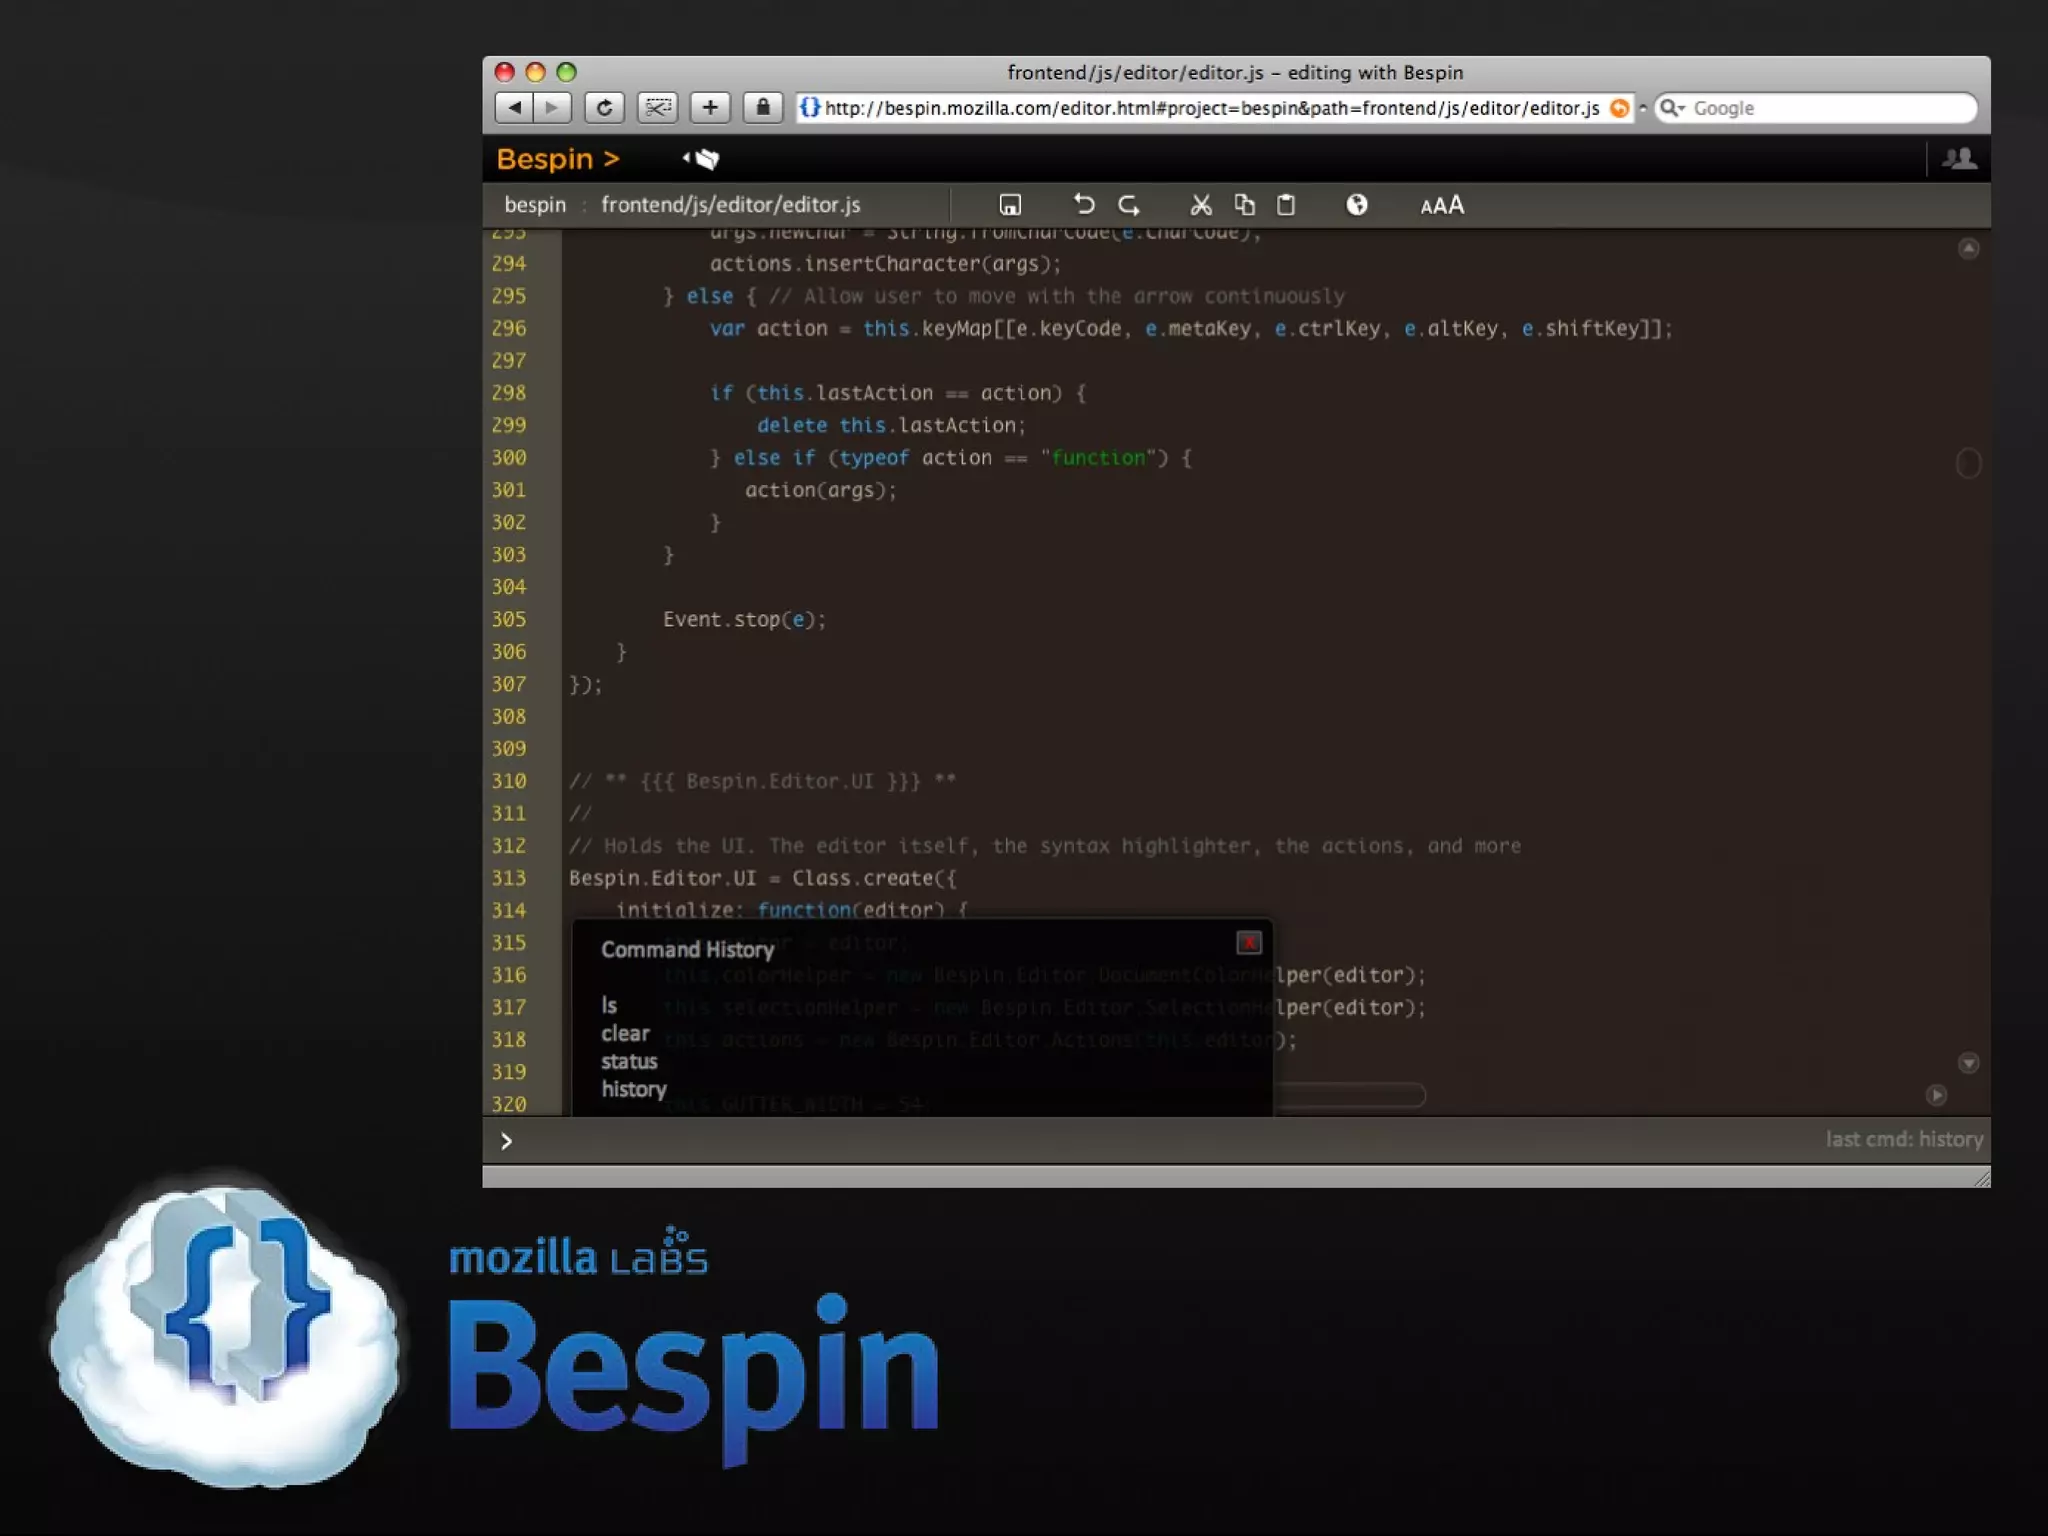
The Future of Web App Development Tools Ross Boucher Co-Founder, 280 North
 
Developer Tools
Four Categories Debugging Performance Tuning Automated Testing Development
1. Debugging
alert()
1998: Netscape JavaScript Debugger
2000: Microsoft Script Debugger
2001: Mozilla Venkman
alert()
I suspect that most JavaScript developers out there are a lot like me... We want to be able to pause our scripts, look at the call stack, and step through them one line at a time, but it's easier to just use " alert debugging " than to fire up a big clunky debugger. - Joe Hewitt, 2006
2006: Firebug
Firebug Features JavaScript Debugger JavaScript Profiler Network Monitor DOM Inspector Logging System Integrated right on the page
2008: WebKit Inspector
2008: Opera Dragonfly
2009: IE 8 Developer Tools
Common Functionality JavaScript Debugger DOM Inspector Logging System Network Monitor
Common API
 
What do we need now?
Common API
 
Scriptability
 
2. Per formance Tuning
JavaScript Profiling
 
function.displayName
 
 
Top Down vs. Bottom Up
aFunction F1 F2 F0 1 9 1 8 78 7 1 1
1 78 8 88 1 78 1 8 8 F1 F2 F0 aFunction aFunction
1 78 8 88 1 78 1 8 8 F1 aFunction
Instrumented vs. Statistical
Memory Analysis
Understand Overall Memory Usage
Find Leaks
Visualize Garbage Collection Information
 
Browser Metrics
How much time is the browser spending...
Painting Parsing JavaScript Executing Code Downloading Files Processing Events in Worker Threads Accessing Databases Re-flowing Applying Styles Parsing HTML Parsing CSS
3. Automated Testing
JsTestDriver
 
Test Swarm
 
 
AJAX Scope From Microsoft Research
Distributed Profiling and Debugging
http://www-users.itlabs.umn.edu/classes/Fall-2008/csci8101/AjaxScope.pdf Copyright Emre Kiciman & Benjamin Livshits
4. Development
Network Monitoring
HTTP Client
Charles Proxy
Code Analysis
JSure, JavaScript Lint, JSLint
Objective-J Runtime Type Checking
Web Based IDEs
 
 
Wrap Up
 
Thanks. @boucher • ross@280north.com

DevTools

Editor's Notes

  • #67 Follow me on twitter.