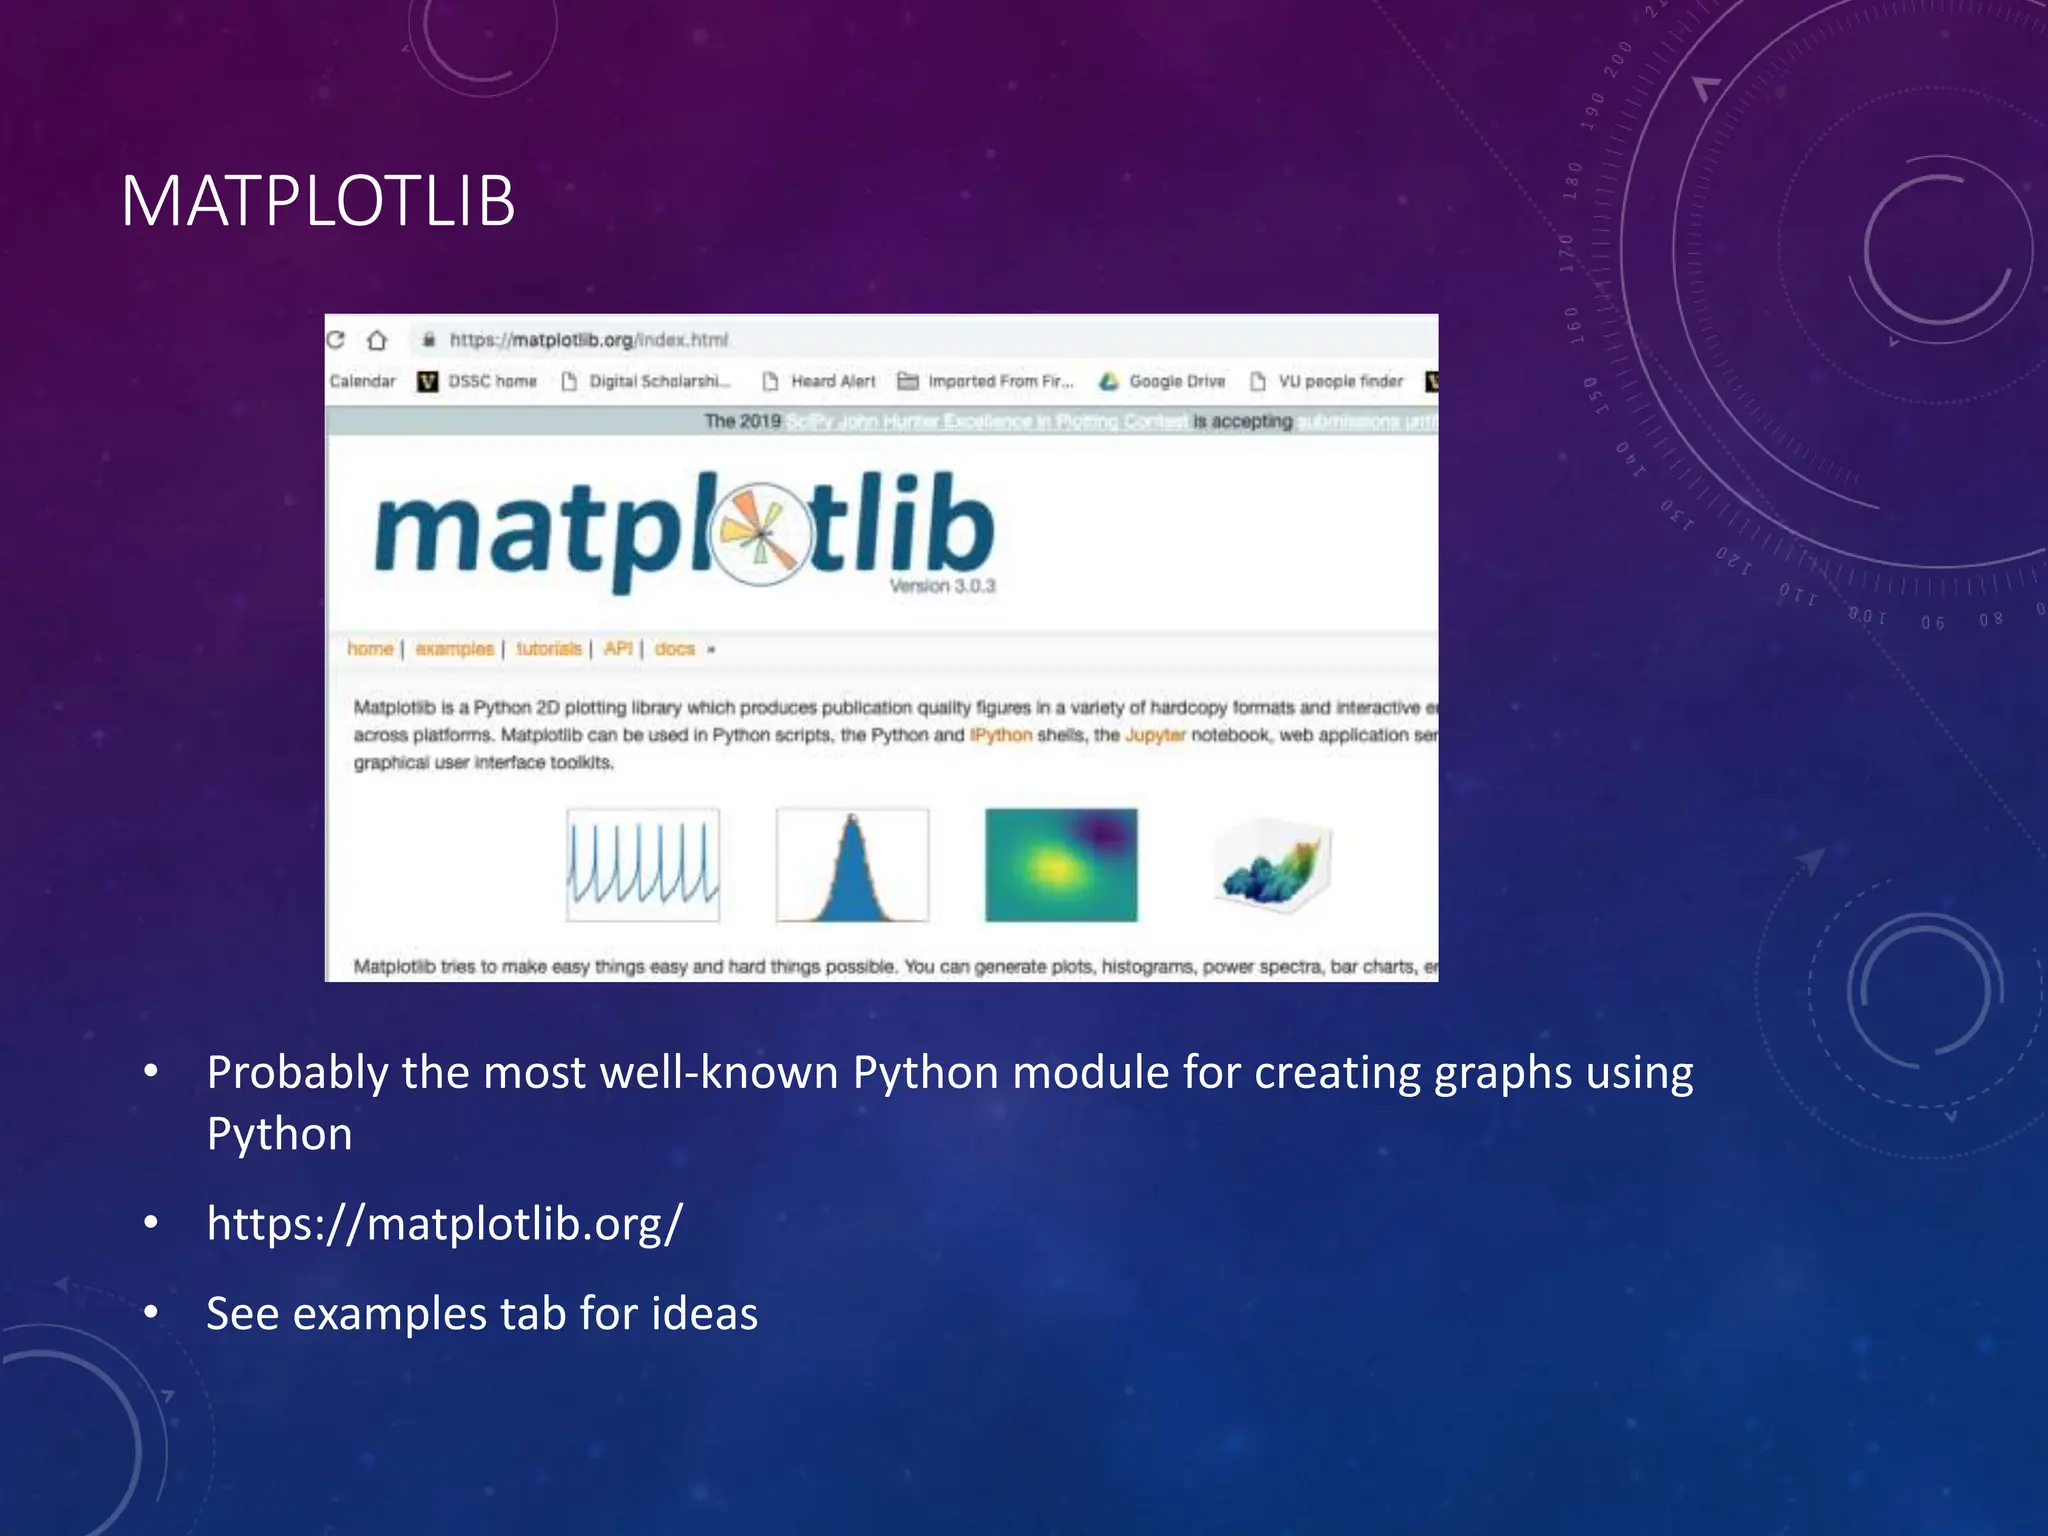
DATA VISUALIZATION WITH PYTHON Steve Baskauf Digital scholarship and scholarly communications office
WHAT IS PYTHON? • Python is a free, community-developed programming language • Run from: • command line • Integrated Development Environment (IDE) • Jupyter Notebook • Basic Python: minimal installed libraries, but extensible via modules from the community • Python is the "wild west" of programming – everyone does what they want! • Anaconda installs a bulked-up version of Python that includes many common data science libraries, Jupyter notebooks, and and IDE. • I recommend installing Anaconda if you are serious about data viz.
MATPLOTLIB • Probably the most well-known Python module for creating graphs using Python • https://matplotlib.org/ • See examples tab for ideas
EXAMPLE: VISUALIZING METRO SCHOOLS DATA • Code available in DSSC code repository: http://bit.ly/2HJKC9w • Ways to run • Editor and command line • Spyder Python IDE • Jupyter Notebook • Can launch Spyder and Jupyter n.b. from Anaconda Navigator
HOW I HACKED THIS CODE 1. Found the data I wanted: https://github.com/HeardLibrary/digital- scholarship/blob/master/data/gis/wg/Metro_Nashville_Schools.csv 2. Went to Matplotlib examples and found the graph I wanted https://matplotlib.org/gallery/lines_bars_and_markers/bar_stacked.html 3. Went to the DSSC Python lessons on input and output to find out how to read in the data: https://heardlibrary.github.io/digital- scholarship/script/python/inout/#reading-from-csv-files-from-the-web 4. Used my knowledge of Python lists, dictionaries, and tuples to turn the Metro schools data into the form needed by Matplotlib.
WHAT ARE NUMPY AND PANDAS? • The generic Python language has somewhat limited capabilities for dealing with math and array (table) data • Numpy is a library that allows for efficient processing of large numerical datasets. It also creates a n-dimensional data structure (array) that doesn't exist in generic Python. • Pandas is a Python library that builds on Numpy and Matplotlib to make it easier to work with dataframes (i.e. tables)
SEABORN • Seaborn builds on Matplotlib and Pandas • It is for statistical graphics • See https://seaborn.pydata.org/introduction.html for examples.
BOKEH • Bokeh (pronounced like bouquet) library: browser-based • visualizations • Interactive plots • Requires understanding of HTML and Javascript • Python is used to generate the visualization, HTML is used to display it. • Demo
DATA VISUALIZATION WITH R Steve Baskauf Digital scholarship and scholarly communications office
WHAT IS R? • R is a free, community-developed programming language • Run from: • command line • Integrated Development Environment (IDE) called RStudio • Jupyter Notebook • Basic R: minimal installed libraries, but extensible via curated libraries from the community • R is the "bureaucracy" of programming – much development is done by academics and deployment is more controlled via the Comprenensive R Archive Network (CRAN) • Anaconda installs a bulked-up version of R that includes many common data science libraries, Jupyter notebooks, and and RStudio. • I recommend installing Anaconda if you are serious about data viz.
R vs. RStudio • R is an open-source, community-developed programming language and is typically run through the command line. • RStudio is an open-source, commercially-developed IDE that provides a graphical interface in which you can run R scripts. It's free, but offers paid enterprise support • You can run R without RStudio, but not vice-versa. • Download R, then RStudio, or download the whole thing using Anaconda
OVERVIEW OF RSTUDIO R script editor R command line console data information plot output
BUILT-IN PACKAGE MANAGER package manager
GGPLOT2 • ggplot2: probably the most important visualization library in R. • Enables most basic plot types. • Implementation of the Grammar of Graphics (2010) by Hadley Wickham, the guru of R. • http://vita.had.co.nz/papers/layered-grammar.pdf • The Grammar of Graphics is a philosophical outlook on exploratory visualization expressed in Wilkinson, L., Anand, A., and Grossman, R. (2005), “Graph-Theoretic Scagnostics”. • http://papers.rgrossman.com/proc-094.pdf
DEMO: BAR CHART USING RStudio • Instructions at http://bit.ly/2FKFjnT • Steps: • get data in • run t-test of means (optional) • create bar chart using ggplot function.
DEMO: VISUALIZATIONS USING JUPYTER NOTEBOOK • Demonstrating a Jupyter notebook created by Kate Brady at the VIDL Data Viz working group a couple weeks ago. • Notebook and data at http://bit.ly/2HNad10 • Google "ggplot examples" for many code/screenshot options
A PLUG FOR THE GIS WORKING GROUP • Stacy Curry Johnson has been teaching how to use these tools in the GIS working group • This week: R. Next week: Python • Meets Wednesdays at noon, see Stacy for details.
SOME FINAL ISSUES • Pros and cons of IDE (Spyder or RStudio) vs. Jupyter notebook methods • IDE is excellent for hacking and learning. It also is best for scripts with a lot of branching and looping logic • Jupyter notebook is excellent for pipeline-like scripts where there is essentially a linear flow of the program logic. Jupyter is excellent when you need to describe in detail what's going on (although you can use comments in your scripts…) • Another option not discussed here is R Markdown. • Pros and cons of Python vs. R • Both can do a lot and both can be scripted • Depends on your style, background knowledge in the platform • Depends on which platform has the necessary package

Data visualisation in python tool - a brief

  • 1.
    DATA VISUALIZATION WITH PYTHON SteveBaskauf Digital scholarship and scholarly communications office
  • 2.
    WHAT IS PYTHON? •Python is a free, community-developed programming language • Run from: • command line • Integrated Development Environment (IDE) • Jupyter Notebook • Basic Python: minimal installed libraries, but extensible via modules from the community • Python is the "wild west" of programming – everyone does what they want! • Anaconda installs a bulked-up version of Python that includes many common data science libraries, Jupyter notebooks, and and IDE. • I recommend installing Anaconda if you are serious about data viz.
  • 3.
    MATPLOTLIB • Probably themost well-known Python module for creating graphs using Python • https://matplotlib.org/ • See examples tab for ideas
  • 4.
    EXAMPLE: VISUALIZING METROSCHOOLS DATA • Code available in DSSC code repository: http://bit.ly/2HJKC9w • Ways to run • Editor and command line • Spyder Python IDE • Jupyter Notebook • Can launch Spyder and Jupyter n.b. from Anaconda Navigator
  • 5.
    HOW I HACKEDTHIS CODE 1. Found the data I wanted: https://github.com/HeardLibrary/digital- scholarship/blob/master/data/gis/wg/Metro_Nashville_Schools.csv 2. Went to Matplotlib examples and found the graph I wanted https://matplotlib.org/gallery/lines_bars_and_markers/bar_stacked.html 3. Went to the DSSC Python lessons on input and output to find out how to read in the data: https://heardlibrary.github.io/digital- scholarship/script/python/inout/#reading-from-csv-files-from-the-web 4. Used my knowledge of Python lists, dictionaries, and tuples to turn the Metro schools data into the form needed by Matplotlib.
  • 6.
    WHAT ARE NUMPYAND PANDAS? • The generic Python language has somewhat limited capabilities for dealing with math and array (table) data • Numpy is a library that allows for efficient processing of large numerical datasets. It also creates a n-dimensional data structure (array) that doesn't exist in generic Python. • Pandas is a Python library that builds on Numpy and Matplotlib to make it easier to work with dataframes (i.e. tables)
  • 7.
    SEABORN • Seaborn buildson Matplotlib and Pandas • It is for statistical graphics • See https://seaborn.pydata.org/introduction.html for examples.
  • 8.
    BOKEH • Bokeh (pronouncedlike bouquet) library: browser-based • visualizations • Interactive plots • Requires understanding of HTML and Javascript • Python is used to generate the visualization, HTML is used to display it. • Demo
  • 9.
    DATA VISUALIZATION WITH R SteveBaskauf Digital scholarship and scholarly communications office
  • 10.
    WHAT IS R? •R is a free, community-developed programming language • Run from: • command line • Integrated Development Environment (IDE) called RStudio • Jupyter Notebook • Basic R: minimal installed libraries, but extensible via curated libraries from the community • R is the "bureaucracy" of programming – much development is done by academics and deployment is more controlled via the Comprenensive R Archive Network (CRAN) • Anaconda installs a bulked-up version of R that includes many common data science libraries, Jupyter notebooks, and and RStudio. • I recommend installing Anaconda if you are serious about data viz.
  • 11.
    R vs. RStudio •R is an open-source, community-developed programming language and is typically run through the command line. • RStudio is an open-source, commercially-developed IDE that provides a graphical interface in which you can run R scripts. It's free, but offers paid enterprise support • You can run R without RStudio, but not vice-versa. • Download R, then RStudio, or download the whole thing using Anaconda
  • 12.
    OVERVIEW OF RSTUDIO Rscript editor R command line console data information plot output
  • 13.
  • 14.
    GGPLOT2 • ggplot2: probablythe most important visualization library in R. • Enables most basic plot types. • Implementation of the Grammar of Graphics (2010) by Hadley Wickham, the guru of R. • http://vita.had.co.nz/papers/layered-grammar.pdf • The Grammar of Graphics is a philosophical outlook on exploratory visualization expressed in Wilkinson, L., Anand, A., and Grossman, R. (2005), “Graph-Theoretic Scagnostics”. • http://papers.rgrossman.com/proc-094.pdf
  • 15.
    DEMO: BAR CHARTUSING RStudio • Instructions at http://bit.ly/2FKFjnT • Steps: • get data in • run t-test of means (optional) • create bar chart using ggplot function.
  • 16.
    DEMO: VISUALIZATIONS USINGJUPYTER NOTEBOOK • Demonstrating a Jupyter notebook created by Kate Brady at the VIDL Data Viz working group a couple weeks ago. • Notebook and data at http://bit.ly/2HNad10 • Google "ggplot examples" for many code/screenshot options
  • 17.
    A PLUG FORTHE GIS WORKING GROUP • Stacy Curry Johnson has been teaching how to use these tools in the GIS working group • This week: R. Next week: Python • Meets Wednesdays at noon, see Stacy for details.
  • 18.
    SOME FINAL ISSUES •Pros and cons of IDE (Spyder or RStudio) vs. Jupyter notebook methods • IDE is excellent for hacking and learning. It also is best for scripts with a lot of branching and looping logic • Jupyter notebook is excellent for pipeline-like scripts where there is essentially a linear flow of the program logic. Jupyter is excellent when you need to describe in detail what's going on (although you can use comments in your scripts…) • Another option not discussed here is R Markdown. • Pros and cons of Python vs. R • Both can do a lot and both can be scripted • Depends on your style, background knowledge in the platform • Depends on which platform has the necessary package