Indonesia is one of the countries with the largest number of diphtheria sufferers in the world. Diphtheria is a case of re-emerging disease, especially in Indonesia. Diphtheria can be prevented by immunization. Diphtheria immunization has drastically reduced mortality and susceptibility to diphtheria, but it is still a significant childhood health problem. This study predicted the number of diphtheria patients in several regions using support vector regression (SVR) combined with the genetic algorithm (GA) for parameter optimization. The area is grouped into 3 clusters based on the number of cases. The proposed method is proven to overcome overfitting and avoid local optima. Model robustness tests were carried out in several other regions in each cluster. Based on the experiments in three scenarios and 12 areas, the hybrid model shows good forecasting results with an average mean squared error (MSE) of 0.036 and a symmetric mean absolute percentage error (SMAPE) of 41.2% with a standard deviation of 0.075 and 0.442, respectively. Based on experiments in various scenarios, the SVR-GA model shows better performance than others. Compares two- means tests on MSE and SMAPE were given to prove that SVR-GA models have better performance. The results of this forecasting can be used as a basis for policy making to minimize the spread of diphtheria cases.
![IAES International Journal of Artificial Intelligence (IJ-AI) Vol. 14, No. 4, August 2025, pp. 2909~2921 ISSN: 2252-8938, DOI: 10.11591/ijai.v14.i4.pp2909-2921 2909 Journal homepage: http://ijai.iaescore.com Data-driven support vector regression-genetic algorithm model for predicting the diphtheria distribution Wiwik Anggraeni1 , Yeyen Sudiarti1 , Muhammad Ilham Perdana2 , Edwin Riksakomara1 , Adri Gabriel Sooai3 1 Department of Information Systems, Faculty of Intelligent Electrical and Informatics Technology, Institut Teknologi Sepuluh Nopember, Surabaya, Indonesia 2 Department of Informatics, Faculty of Engineering, Universitas Muhammadiyah Malang, Malang, Indonesia 3 Department of Computer Science, Faculty of Engineering, Universitas Katolik Widya Mandira, Kupang, Indonesia Article Info ABSTRACT Article history: Received Feb 9, 2024 Revised Feb 20, 2025 Accepted Mar 15, 2025 Indonesia is one of the countries with the largest number of diphtheria sufferers in the world. Diphtheria is a case of re-emerging disease, especially in Indonesia. Diphtheria can be prevented by immunization. Diphtheria immunization has drastically reduced mortality and susceptibility to diphtheria, but it is still a significant childhood health problem. This study predicted the number of diphtheria patients in several regions using support vector regression (SVR) combined with the genetic algorithm (GA) for parameter optimization. The area is grouped into 3 clusters based on the number of cases. The proposed method is proven to overcome overfitting and avoid local optima. Model robustness tests were carried out in several other regions in each cluster. Based on the experiments in three scenarios and 12 areas, the hybrid model shows good forecasting results with an average mean squared error (MSE) of 0.036 and a symmetric mean absolute percentage error (SMAPE) of 41.2% with a standard deviation of 0.075 and 0.442, respectively. Based on experiments in various scenarios, the SVR-GA model shows better performance than others. Compares two- means tests on MSE and SMAPE were given to prove that SVR-GA models have better performance. The results of this forecasting can be used as a basis for policy- making to minimize the spread of diphtheria cases. Keywords: Diphtheria Disease Forecasting Genetic algorithm Support vector regression This is an open access article under the CC BY-SA license. Corresponding Author: Wiwik Anggraeni Department of Information Systems, Faculty of Intelligent Electrical and Informatics Technology Institut Teknologi Sepuluh Nopember Keputih Sukolilo, Surabaya, Indonesia Email: wiwik@is.its.ac.id 1. INTRODUCTION Diphtheria is a dangerous infectious disease caused by the bacterium Corynebacterium diphtheriae [1]. Diphtheria spreads through an infected person's saliva or contact with an infected person's skin or personal effects [2]. The disease can lead to death, due to a blocked respiratory tract and heart failure, especially in children. The mortality rate of diphtheria averages 5–10% in children under 5 years of age [2], [3]. Although diphtheria is rare in countries with high vaccination coverage, it remains a concern in areas with inadequate vaccination and healthcare infrastructure [4]. Diphtheria is a vaccine-preventable disease [5]. Immunization against diphtheria has drastically reduced mortality and susceptibility to diphtheria [6]. Global data published by WHO and UNICEF in 2022 show that there has been a sustained decline in the number of childhood vaccinations in about 30 years [7]. In 2021 alone, 25 million children missed one or more doses of](https://image.slidesharecdn.com/3325190-250911025314-fe9b08d8/75/Data-driven-support-vector-regression-genetic-algorithm-model-for-predicting-the-diphtheria-distribution-1-2048.jpg)
![ ISSN: 2252-8938 Int J Artif Intell, Vol. 14, No. 4, August 2025: 2909-2921 2910 the diphtheria vaccine. 18 million of those 25 million children did not receive a single dose of diphtheria, tetanus, and pertussis (DTP) year-round, and most of them lived in India, Nigeria, Indonesia, Ethiopia, and Philippines [7]. Indonesia has faced the challenge of diphtheria outbreaks periodically until 2022, especially in densely populated areas. Indonesia was once the country with the second-largest diphtheria cases in the world after India, which was 3,203 cases [8]. This is even more dangerous because of the decline in immunization coverage in Indonesia due to the impact of COVID-19. WHO Indonesia Situation Report-13 states that the decrease occurred by 10-40% in March-April 2020 compared to the previous year [2]. Based on these conditions, the Indonesian Ministry of Health needs to prepare a strategy to deal with the increase in the number of cases. The strategy will be timely and targeted if it is based on information on the possible distribution of the number of cases and vaccines in each region. For this reason, this study is carried out to forecast the number of diphtheria sufferers in several regions in Indonesia by paying attention to various vaccines associated with diphtheria. The results of forecasting the number of diphtheria cases resulting from this study can be used to assist the health office in determining policies that will be carried out to reduce the number of diphtheria sufferers. Forecasting related to the health domain is needed, especially if the forecasting involves multivariable [9]. Based on our best knowledge, currently there is still a lack of research related to diphtheria directed to forecasting. Rather, previous studies tend to be more interested in the factor analyses influential to the rising of diphtheria cases [3], [4], analysis of the effectivity of vaccination to the people’s health specified by age [10]‒[12], regional demography [13], [14], countries’ income [15], and population [16]. This study tries to forecast the spread of the diphtheria case number involving other variables related to vaccination that have been given previously. The number of vaccines given is involved as a regressor because vaccination is very crucial to the diphtheria case number fluctuation [10], [11]. A diphtheria case forecasting study has been done by [16]. However, Anggraeni et al. [16] only does so by using just a single variable, which is the diphtheria total cases. In addition, Anggraeni et al. [17] has also done a forecasting study involving more influential variables, but the implemented model still has serious limitations. Only very few studies have been found to have done a forecasting analysis on the case study of diphtheria. This makes the state-of-the-art study about this method very limited. A previous study mentioned earlier does a forecasting of the number of diphtheria cases using the radial basis function (RBF) network approach [16]. However, the study involves only the number of cases in the past without considering other influential factors. In addition, the performance of the model is a bit lacking. The study would be developed further by involving another influential variable, which is the number of vaccinations [17], by implementing the fuzzy approach. The data involved in this research is not sufficient in quantity, so the chance of overfitting occurring is high because the model cannot learn from enough data. Forecasting with a small dataset in training is challenging [9]. Knowing this condition, this study implements the support vector regression (SVR) method to do a forecasting on the number of diphtheria cases. The support vector machine (SVM) has been proven to solve the problem of overfitting, so it is suitable to be implemented to produce long-term forecasting with a relatively small dataset [18]. The SVR is also more consistent in forecasting a case than other regression approaches [19] and is hybridized with others [20]. In addition, the SVR has a better generalizing ability, which is suitable for small dataset analyses with non-linear data [21], [22]. In spite of its superior features, the parameter value of the SVR must be defined with precise accuracy to construct an optimized SVR model [22]. Unsuitable parameter value in the SVR analysis would, needless to say, influence its forecasting performance [18]. Parameter definition based on trial and error could cause serious problems and needs more time to analyze [18]. This research hybridizes the SVR method with the genetic algorithm (GA). The GA is implemented to define the parameter value of the SVR. The fitness value of the GA is capable of avoiding the local optimum and defining the global optimum in a short time [23]. The GA, as one of the many kinds of metaheuristic algorithms, has been proven capable of optimizing the performance of a heuristic optimization algorithm [20]. The SVR-GA method has been applied to forecast tourism demand in China [22]. The study finds that the SVR- GA outperforms both the back propagation neural network (BPNN) and autoregressive integrated moving average (ARIMA) models according to normalized mean square error (MSE) and mean absolute percentage error (MAPE) [22]. This SVR-GA method has also been applied to make a forecast on the quality of the aquaculture water [24]. The research finds that the SVR-GA outperforms the traditional SVR and the BPNN model [24]. The hybridization of the GA and SVR in the optimization of parameter value is an effective way to increase the accuracy of the prediction and the ability to generalize a model [20]. In this study, the SVR-GA method is used to model and forecast the number of infections by diphtheria with some independent variables, namely the immunization range and population density. What this research wants to contribute is listed as follows: i) this study proposes a hybrid model combining the SVR and GA methods to produce a more](https://image.slidesharecdn.com/3325190-250911025314-fe9b08d8/75/Data-driven-support-vector-regression-genetic-algorithm-model-for-predicting-the-diphtheria-distribution-2-2048.jpg)
![Int J Artif Intell ISSN: 2252-8938 Data-driven support vector regression-genetic algorithm model for predicting … (Wiwik Anggraeni) 2911 optimal forecasting model without a trial-and-error experiment in finding a parameter that would produce a forecasting model with fewer errors. The forecasting is deduced by involving some variables influential on the number of sufferers. ii) The model that we propose is suitable for speculating data with more training data but fewer irregular patterns. This model can successfully tackle an increase in data located outside its interval and history. iii) This study is equipped with a deeper hypothetical testing to prove that the implemented hybrid approach has a lot better performance than the others. The rest of this paper is as follows. The first section of the introduction contains the conditions and problems that occur, related works that have existed before, gaps, and contributions offered. In the next section, there is a method consisting of a research location, a dataset, and a methodology. Next is the result and discussion. Finally, a conclusion which is also complemented by the development plan of this paper presented at the end. 2. METHOD 2.1. Research location and dataset The domain this research was carried out is some regions or cities in the East Java Province, Indonesia. East Java is a province where diphtheria cases are found to be most frequent in Indonesia, with a percentage of 74% [7]. This is because diphtheria is a re-emerging case in this province. The highest recorded number of cases happened in 2012, with a total of 955 cases and 37 deaths. But it seems that from time to time, reported cases of diphtheria keep increasing, as well as those who are reported as dead because of this illness. East Java has been pronounced multiple times as a province with an outbreak of diphtheria cases. Meanwhile, the data processed in this research are those concerning those who are infected by diphtheria in some regions/cities in East Java with a monthly time horizon. In addition, there are some data involved because they are influential on the number of diphtheria cases, namely the immunization range (DPT1, DPT2, DPT3, and DPT4 vaccines) as well as the population density. 2.2. Methodology The steps undertaken to forecast the number of diphtheria cases in the next periods are systematically illustrated in Figure 1. This forecasting framework integrates epidemiological data with SVR enhanced by a GA for parameter optimization. The GA is employed to identify the optimal combination of SVR parameters, thus improving the model’s predictive performance. This hybrid approach enables more accurate and reliable forecasting, which is essential for timely public health interventions and efficient resource planning. Figure 1. Research methodology 2.2.1. Data collection The first step was data collection, which is highly crucial to the essence and performance of the present study. Data concerning the number of infected individuals in some regions/cities in East Java were](https://image.slidesharecdn.com/3325190-250911025314-fe9b08d8/75/Data-driven-support-vector-regression-genetic-algorithm-model-for-predicting-the-diphtheria-distribution-3-2048.jpg)
![ ISSN: 2252-8938 Int J Artif Intell, Vol. 14, No. 4, August 2025: 2909-2921 2912 collected from the East Java provincial health department. From the same department, we also got the data concerning the immunization range from the DPT1, DPT2, DPT3, and DPT4 vaccines. However, data concerning the population density were collected from the Central Bureau of Statistics in East Java Province. The collected statistical descriptive data are shown in Table 1. Data in Table 1 shows that there is no data that is distributed normally. This shows that the skewness value as well as the kurtosis deviate from zero. Table 1. Statistical descriptive data Variable Min Max Mean Std. deviation Skewness Kurtosis Population Density 528,793 8,231,742 1,684,752 2,081,239 2,450 4,771 Sufferer Number 0.000 22,000 1,032 1,802 3,763 23,636 DPT-1 0.000 98,330 8,169 4,394 16,747 336,146 DPT-2 0.000 97,370 8,072 4,337 16,550 331,411 DPT-3 0.000 96,170 8,031 4,333 16,284 323,839 DPT-4 0.000 127,020 5,123 7,835 7,769 94,756 2.2.2. Preprocessing The preprocessing data was done to fill out the empty data and the zero data, whose values are not supposed to be zero. Multiple imputations are necessary to do so. In addition, data reduction is also necessary, especially for data that has no clear information. Data normalization was carried out since the data shown in Table 1 has a very wide range. After the data was ready, we divided it into two sections: the training set and the testing set, with a ratio of 75:25. 2.2.3. Data clustering Data in various regions at the next case study location were grouped into 3 clusters. Grouping was based on the highest number of sufferers in each region. The characteristics of each cluster, namely cluster 1, are data for cities/regions that have the highest number of sufferers with a score more than 10, cluster 2 is in the range from 6 to 10, and cluster 3 is for less than or equal to 5. For each cluster, one dataset was selected as a representative used in creating the SVR-GA model. This selection was made based on areas that have more complex data patterns. The data used in making the model in cluster 1 is SR City, cluster 2 is ML Regency, and cluster 3 is SM Regency. 2.2.4. Correlation analysis The correlation test was carried out to determine the relationship between the independent variable and the dependent variable. The correlation test used is the Pearson correlation test as carried out in [25]. The regressors whose correlation was analyzed were immunization coverage and population density, while the dependent variable was the number of diphtheria sufferers. The immunization coverage variable includes DPT1, DPT2, DPT3, and DPT4. All of these types of immunization are included in the forecasting model. 2.2.5. The SVR model construction There are 3 models that were formed, namely the cluster 1 model, which uses the SR City dataset, the cluster 2 model, which uses the ML Regency dataset, and the cluster 3 model, which uses the SM Regency dataset. The kernel that was used in forming the models is the RBF kernel. This SVR has three parameters used, namely parameters C (constant), γ (gamma), and ε (epsilon). In the first scenario, the three parameters used an initial value, namely 0.1, and then the MSE and symmetric mean absolute percentage error (SMAPE) values from this scenario would be calculated. SVM is a machine learning method that applies the principle of inductive risk minimization to obtain good generalization across a number of learning patterns [26]. The SVM implements learning algorithms that are useful for recognizing patterns in complex data sets. SVR is a form of SVM but for the regression case [26]. The goal of the SVR is to find a function f(x) as a hyperplane in the form of a regression function that fits all of the input data by maximizing the margin between two classes and minimizing the error as little as possible [27]. Suppose the function in (1) is a regression line as an optimal hyperplane [18], [19]. 𝑓(𝑥) = 𝜔𝑇 (𝑥) + 𝑏 (1) Maximizing the margin increases the probability of the data falling within the ±ε radius. Therefore, to maximize margin, a minimum ‖w‖ is required [27]. It is assumed that all points are in the range f(x)±ε (feasible), where there are several points that may be out of the range, then slack variables ξ and ξ^* are](https://image.slidesharecdn.com/3325190-250911025314-fe9b08d8/75/Data-driven-support-vector-regression-genetic-algorithm-model-for-predicting-the-diphtheria-distribution-4-2048.jpg)
![Int J Artif Intell ISSN: 2252-8938 Data-driven support vector regression-genetic algorithm model for predicting … (Wiwik Anggraeni) 2913 added to overcome the problem of infeasible constraints in the optimization problem [27]. Next, the optimization problem can be formulated as (2) to (5) [21], [27]. 𝑚𝑖𝑛 1 2 ‖𝑤‖2 + 𝐶 ∑ (𝜉𝑖 + 𝜉𝑖 ∗ ) 𝑙 𝑖=1 (2) With conditions: 𝑦𝑖 − 𝜔𝑇 (𝑥𝑖) − 𝑏 − 𝜉𝑖 ≤ 𝜀 untuk 𝑖 = 1, … , 𝑙 (3) 𝜔𝑇 (𝑥𝑖) − 𝑦𝑖 + 𝑏 − 𝜉𝑖 ∗ ≤ 𝜀 untuk 𝑖 = 1, … , 𝑙 (4) 𝜉𝑖,𝜉𝑖 ∗ ≥ 0 (5) where xi is the input data, yi is the output, ω, ξ, ε are the parameters whose values will be searched for. In the SVR, there is a kernel function. The kernel function is used to make non-linear data separable by moving it to a higher-dimensional space. The kernel that will be used in the SVR is the RBF kernel because it has been proven to produce better prediction performance [28]. The RBF kernel formulation as shown in (6) [20], [29]. In the SVR, selecting hyper-optimal parameters is an important step. These parameters include are parameter C that determines the trade-off costs as a penalty due to an infeasible problem, parameter γ that shows the bandwidth of the kernel function which represents the variance of the RBF kernel function, and ε-insensitive loss function which is the distance between the hyperplane and 2 boundary lines equal to accuracy of the estimate placed on the training data points [18], [19], [27]. 𝐾(𝑥, 𝑦) = exp (− 1 2𝜎2 ‖𝑥 − 𝑦‖2 ) (6) 2.2.6. The SVR-GA model construction Parameter tuning aims to find the optimal SVR hyperparameter values. In this study, optimal parameter definition was carried out using the GA method. GA is a metaheuristic method inspired by the natural selection process [30]. GA uses crossover and mutation operators, which make the population more diverse and thus more immune to being trapped in a local optimum. In theory, diversity also helps the algorithm be faster in reaching the global optimum because it will allow the algorithm to explore the solution space more quickly [23]. In searching for SVR parameters with the GA, there are stages of initial solution, fitness function, selection, crossover, and mutation. The length of the chromosome is 3, each representing the SVR parameter whose optimal value will be sought, namely constant, gamma, and epsilon. At the initial solution stage, a random method was used to obtain 10 chromosomes. Then the 10 chromosomes will undergo selection, crossover, and mutation to reach 100 chromosomes. Each chromosome's value will be entered into the SVR model so that the MSE and SMAPE calculations can be carried out. The fitness function used is the smallest MSE and SMAPE values. The parameter tuning is carried out on each model that has been formed. 2.2.7. Selection of the best combination of variables After obtaining the best model and parameters, the next step is to create a combination of variables. These combinations are between dependent variable namely number of sufferer and independepent variables like immunization range and population density, immunization range, and population density. The combination of variables with the smallest MSE and SMAPE values will be selected as the model for carrying out the next forecasting process. 2.2.8. Performance evaluation To measure the performance of forecasting results, this study uses MSE and SMAPE [25]. MSE is the sum of the differences between forecast data and actual data. Besides, SMAPE is an alternative to calculating MAPE when the actual data is 0 or close to 0. 2.2.9. Forecasting the next period Forecasting is performed using a predictive model configured with the optimal set of parameters and the most relevant combination of input variables. This approach is designed to enhance the accuracy of the forecasting results. The model is then applied to estimate the number of diphtheria cases that can happen over the next 24 periods in SR City, ML Regency, and SM Regency, thereby providing valuable insights for local public health planning and intervention.](https://image.slidesharecdn.com/3325190-250911025314-fe9b08d8/75/Data-driven-support-vector-regression-genetic-algorithm-model-for-predicting-the-diphtheria-distribution-5-2048.jpg)
![ ISSN: 2252-8938 Int J Artif Intell, Vol. 14, No. 4, August 2025: 2909-2921 2914 2.2.10. Robustness test model The model with the best parameters and combination of variables will be tested on other datasets that are still in the same cluster as the dataset used to create the model. This is done to find out how robust the SVR-GA model that has been created is. The dataset was selected using a simple random sampling method. Cluster 1, with the highest number of regions, will be tested for robustness in 4 other regions. As for clusters 2 and 3, they were tested in 3 and 2 other regions, respectively. 3. RESULTS AND DISCUSSION The results of the correlation test used to determine the influence between variables in various sample areas are shown in Table 2. Table 2 shows that, for the city of SB, the DPT1 variable has a directly proportional relationship with the number of sufferers, while the variables DPT2, DPT3, DPT4, and population density have an inversely proportional relationship. Meanwhile, all p-values are greater than 0.05, so there is no significant relationship between variables. However, the P-value for the population density and number of sufferers variables is smaller than the other variables, so even though the value is greater than 0.05, the population density variable has a greater influence on the number of sufferers than the other variables. Table 2. Correlation test result between regressor variables and the number of sufferers Variable SB City ML Regency SM Regency Pearson correlation coefficient P-value Pearson correlation coefficient P-value Pearson correlation coefficient P-value DPT-1– sufferer number 0.054 0.655 -0.011 0.931 0.061 0.619 DPT-2– sufferer number -0.007 0.953 -0.008 0.948 0.102 0.395 DPT-3– sufferer number -0.034 0.780 -0.010 0.936 0.112 0.348 DPT-4– sufferer number -0.083 0.488 -0.131 0.273 -0.027 0.824 Population density – sufferer number -0.187 0.117 0.035 0.769 0.052 0.665 Meanwhile, for ML Regency, the variables DPT1, DPT2, DPT3, and DPT4 have an inverse relationship with the number of sufferers. Meanwhile, the population density variable has a directly proportional relationship with the number of sufferers. All p-values are greater than the predetermined threshold value, so that there is no significant relationship between variables. However, the p-value of the DPT4 variable is smaller than the other variables, so even though the value is greater than the real level value (0.05), the DPT4 variable has a greater influence on the number of sufferers than the other variables. Then, for SM Regency, the variables DPT1, DPT2, DPT3, and population density have a directly proportional relationship with the number of sufferers, while the DPT4 variable has an inverse relationship with the number of sufferers. All P-value values are greater than the real level values that have been determined, so there is no significant relationship between variables. However, the P-value of the variables DPT2 and DPT3 has a smaller value than other variables, so even though the value is greater than the real level value (0.05), this variable has a greater influence on the number of sufferers than other variables. The correlation test results in Table 2 show that all regressor variables are said to have no significant effect on the number of sufferers. The general conclusion is, of course, the opposite of what was conveyed by [3], [4], who argue that many factors can influence the number of sufferers of diphtheria. As well as for [11], [24] who state that vaccination has a big impact on reducing the number of sufferers. However, even though it does not have a significant effect, the correlation coefficient still has a non-null value, so it can still be considered to have an influence, even though it is not significant. So, in determining the best model, several scenarios are used that involve these regressor variables. After the correlation test is carried out, the next step is to find the best parameter values. Parameter tuning is carried out using training data, which is influenced by all variables. Tuning of SVR parameters (C, ε, and γ) was carried out using the GA method. The best parameter values in each cluster are shown in Table 3. In each cluster, the greater the C value, the better the resulting MSE and SMAPE values, while the smaller the gamma and epsilon values, the better the resulting MSE and SMAPE values. However, the values of these three parameters have different ranges in each cluster. Table 3 shows that the differences in the MSE and SMAPE values of the initiation parameters and the best parameters show quite significant results, so it can be confirmed that the results of parameter tuning are the best parameter values from all the experiments that have been carried out. After obtaining the best parameter values, the next experiment was carried out using several scenario combinations of regressor variables to forecast the next period. Table 4 shows a](https://image.slidesharecdn.com/3325190-250911025314-fe9b08d8/75/Data-driven-support-vector-regression-genetic-algorithm-model-for-predicting-the-diphtheria-distribution-6-2048.jpg)
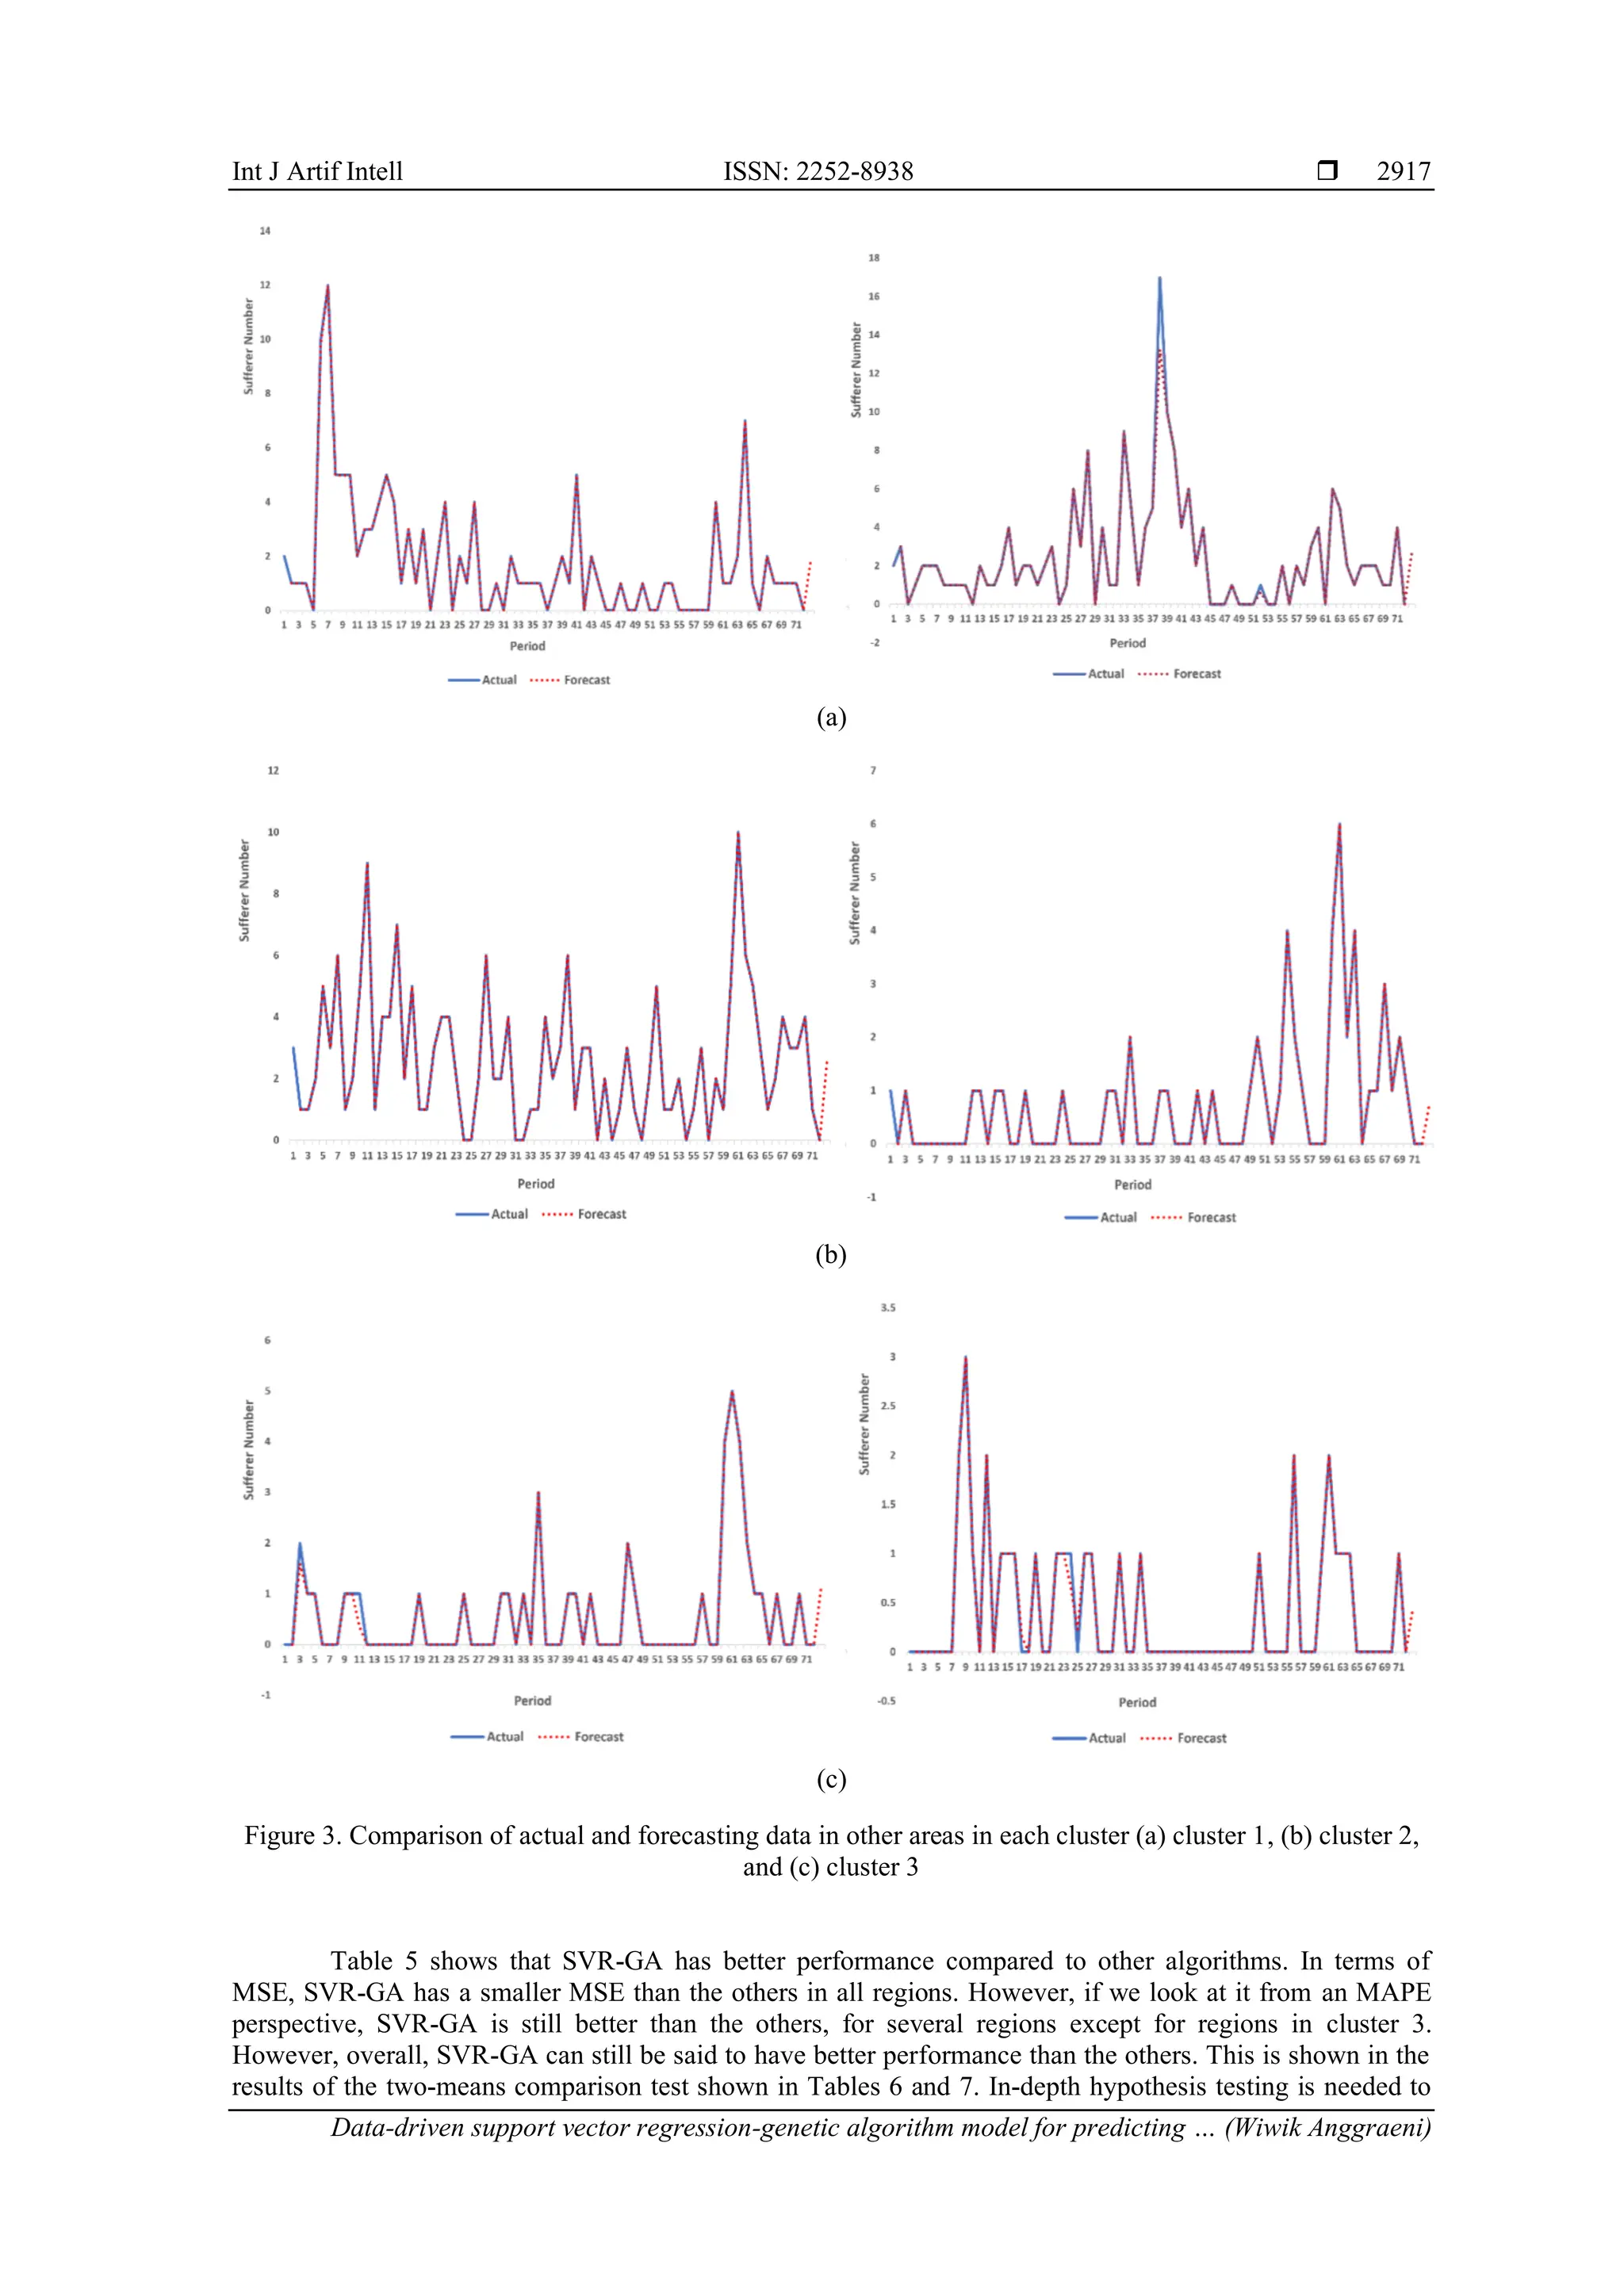
![Int J Artif Intell ISSN: 2252-8938 Data-driven support vector regression-genetic algorithm model for predicting … (Wiwik Anggraeni) 2915 comparison of MSE and SMAPE values resulting from various combinations of variables for the cluster 1, cluster 2, and cluster 3 sample areas. Table 3. Parameter tuning result using genetic algorithm Cluster Parameter MSE SMAPE (%) µ σ e µ Σ Iniation Best parameter value 1 10 0.0022 0.0065 6,571 0.0001371 36.88 11.53 2 40 0.0001 0.0001 2,039 5.203E-07 40.90 22.65 3 8 0.0001 0.0001 0.675 6.951E-08 89.38 52.83 Table 4. Parameter tuning result based on different regressor variable combinations for each cluster Independent variable Dependent variables Cluster-1- SB City Cluster-2 – ML Regency Cluster-3- SM Regency MSE SMAPE (%) MSE SMAPE (%) MSE SMAPE (%) Training Testing Training Testing Training Testing Training Testing Training Testing Training Testing All independent variables Sufferer number 0.0001 0.218 11.52 6.42 0.000 0.000 26.42 23.53 0.000 0.000 67.92 52.94 Immunization (DPT1– DPT4) Sufferer number 0.4720 0.123 13.18 6.95 0.134 0.000 28.07 23.53 0.026 0.002 68.55 53.08 Population density Sufferer number 0.0001 0.216 11.52 6.42 0.073 0.007 29.70 23.81 0.167 0.000 76.34 63.57 The smaller the MSE and SMAPE values, the better the model performance. Based on Table 4, the scenario with a combination of all independent variables in cluster 1, represented by SB City, shows the best performance. Likewise, for cluster 2, which is represented by ML Regency, and cluster 3 by SM Regency. It can be seen that the best model is a model involving all regressor variables, and the parameters used are as shown in Table 4. Comparison of actual data and forecast results for training and testing data is shown for each cluster, as shown in Figure 2. After the model is proven to have good performance, the model is then used to predict the number of diphtheria sufferers in the next 24 periods. The results of future forecasting for SB City, ML Regency, and SM Regency are also shown in Figure 2 from the 73rd period onwards. Forecasting results for the next 24 periods in the SB city, as displayed in Figure 2(a), show pattern values that are similar to training and testing data for previous periods compared to forecasting results in other regions. This means that the model in the city of SB has the best performance compared to other datasets. Likewise, forecasting for the next 24 periods in ML Regency in Figure 2(b) shows that the forecast line can follow the actual data pattern even though there are several periods that are slightly different from the actual data. The forecasting results for SB City and ML Regency show that the SVR-GA algorithm is suitable for application to data that has a non-linear pattern but tends to fluctuate around the average, with a large data range and a lot of small data. However, this is different from the forecasting results for the next 24 periods in SM Regency as shown in Figure 2(c). This supports what was said by [18], who states that the SVR model is suitable for long-term forecasting with a lot of small data. This finding is also in line with the findings of [21]. The SVR-GA model is proven to be able to predict other data well, which shows that it has good generalization abilities even though a lot of historical data is used sparingly and is sometimes non-linear [21], [22]. Comparison of actual and forecasting data in other areas is shown in Figure 3. Cluster 1 is shown in Figure 3(a), cluster 2 in Figure 3(b), and Figure 3(c) represents the results in cluster 3 area. Figure 3 shows that the resulting graph is not as good as the comparison shown in Figure 2. This can be seen from the forecast line, which is not able to follow the actual data pattern well. This condition can be caused by the data pattern here being different from the dataset in the cluster areas in SB City and ML Regency. SM Regency has a lot of zero data when compared to SB City and ML Regency. The data range is also very small, namely only around 0–5. From the forecasting results for SM Regency, it can be said that the SVR-GA algorithm is not suitable when applied to data that is characterized by having many zero values and a small data range. This means that forecasting for SM Regency cannot be used as a reference for decision-making in the next 24 periods. These findings support what was stated by [25], who states that forecasting with data that contains a lot of zeros and small values is difficult. Apart from that, forecasting with many zero values is also difficult to get good performance [31]. After obtaining a model with the best parameter values and combination of variables, experiments were carried out using other regional datasets. Forecasting using other datasets was used to see how robust the model that had been created was. The test results can be seen in Table 5. From Table 5, it can be seen that several SMAPE values are above 50%. However, the SMAPE value cannot be completely used as a benchmark in measuring performance. It must also be seen in terms of graphs and the MSE value as a consideration. All tests produce very good MSE values and also show excellent graphics. Examples of comparison results of actual and forecasting data for other regions in each cluster are shown in Figure 3.](https://image.slidesharecdn.com/3325190-250911025314-fe9b08d8/75/Data-driven-support-vector-regression-genetic-algorithm-model-for-predicting-the-diphtheria-distribution-7-2048.jpg)
![ ISSN: 2252-8938 Int J Artif Intell, Vol. 14, No. 4, August 2025: 2909-2921 2916 Figure 3 shows that the best model for each cluster is robust. This is shown in the forecasting results graph, which shows a pattern similar to the actual data, including cluster 3 shown in Figures 3(c). This condition increasingly shows that the SVR-GA model is capable of working with other data, which shows that it has good generalization abilities, even though a lot of historical data is used. This supports the statement made by [9], [21], [22]. To demonstrate whether the proposed model is capable of generating superior forecasting compared to others, SVR-GA is compared with regression methods previously employed. The benchmark methods used follow those utilized in prior research, namely SVM [9], [31], artificial neural network (ANN) [31], linear regression (LR) [9], stochastic gradient descent (SGD), gradient boosting (GB), and AdaBoost. The results of the performance comparison are presented in Table 5. (a) (b) (c) Figure 2. Comparison of actual and foresting data for the next 24 periods, (a) SB City, (b) ML regency and (c) SM regency Table 5. Performance comparison of the proposed model with others Cluster Dataset SVR-GA SVM SGD ANN LR GB AdaBoost MSE SMAPE (%) MSE SMAPE (%) MSE SMAPE (%) MSE SMAPE (%) MSE SMAPE (%) MSE SMAPE (%) MSE SMAPE (%) 1 SB 0.218 6.420 18.392 99.655 22.828 99.744 22.828 99.708 17.053 99.736 14.143 90.987 16.167 42.421 BT 0.202 21.851 10.805 82.188 7.706 99.701 12.206 97.955 9.184 99.627 8.194 92.303 8.333 51.349 TL 0.001 29.791 1.657 85.925 2.297 88.975 2.698 94.600 2.160 90.216 2.588 95.387 2.222 59.775 BK 0.000 29.582 12.996 77.443 9.775 86.039 8.893 87.700 9.591 88.937 2.872 86.870 3.556 62.379 2 ML 0.000 23.530 5.222 99.524 5.260 88.674 5.175 86.688 5.295 99.780 8.632 89.278 8.167 63.889 BU 0.000 63.383 0.659 87.768 0.908 71.275 0.883 69.473 0.970 71.000 3.407 80.414 1.167 51.852 SD 0.000 14.090 4.169 99.754 5.543 99.438 6.538 99.833 5.714 99.831 6.260 99.800 6.444 40.444 TB 0.000 56.342 1.977 80.319 1.785 88.643 1.683 78.685 1.792 88.628 2.021 82.664 2.778 46.296 3 SM 0.000 52.940 1.012 79.291 1.693 80.249 1.042 84.514 1.705 81.089 0.890 52.382 1.222 57.407 BJ 0.008 64.229 1.177 55.060 0.982 77.795 1.236 77.047 1.007 64.945 0.218 77.514 0.500 46.296 MG 0.003 67.890 0.379 99.924 0.356 85.870 0.341 95.610 0.382 86.261 0.447 70.346 0.556 38.889 TG 0.000 61.975 0.621 74.826 0.539 81.821 1.013 85.245 0.551 81.879 1.162 57.557 0.944 43.519](https://image.slidesharecdn.com/3325190-250911025314-fe9b08d8/75/Data-driven-support-vector-regression-genetic-algorithm-model-for-predicting-the-diphtheria-distribution-8-2048.jpg)
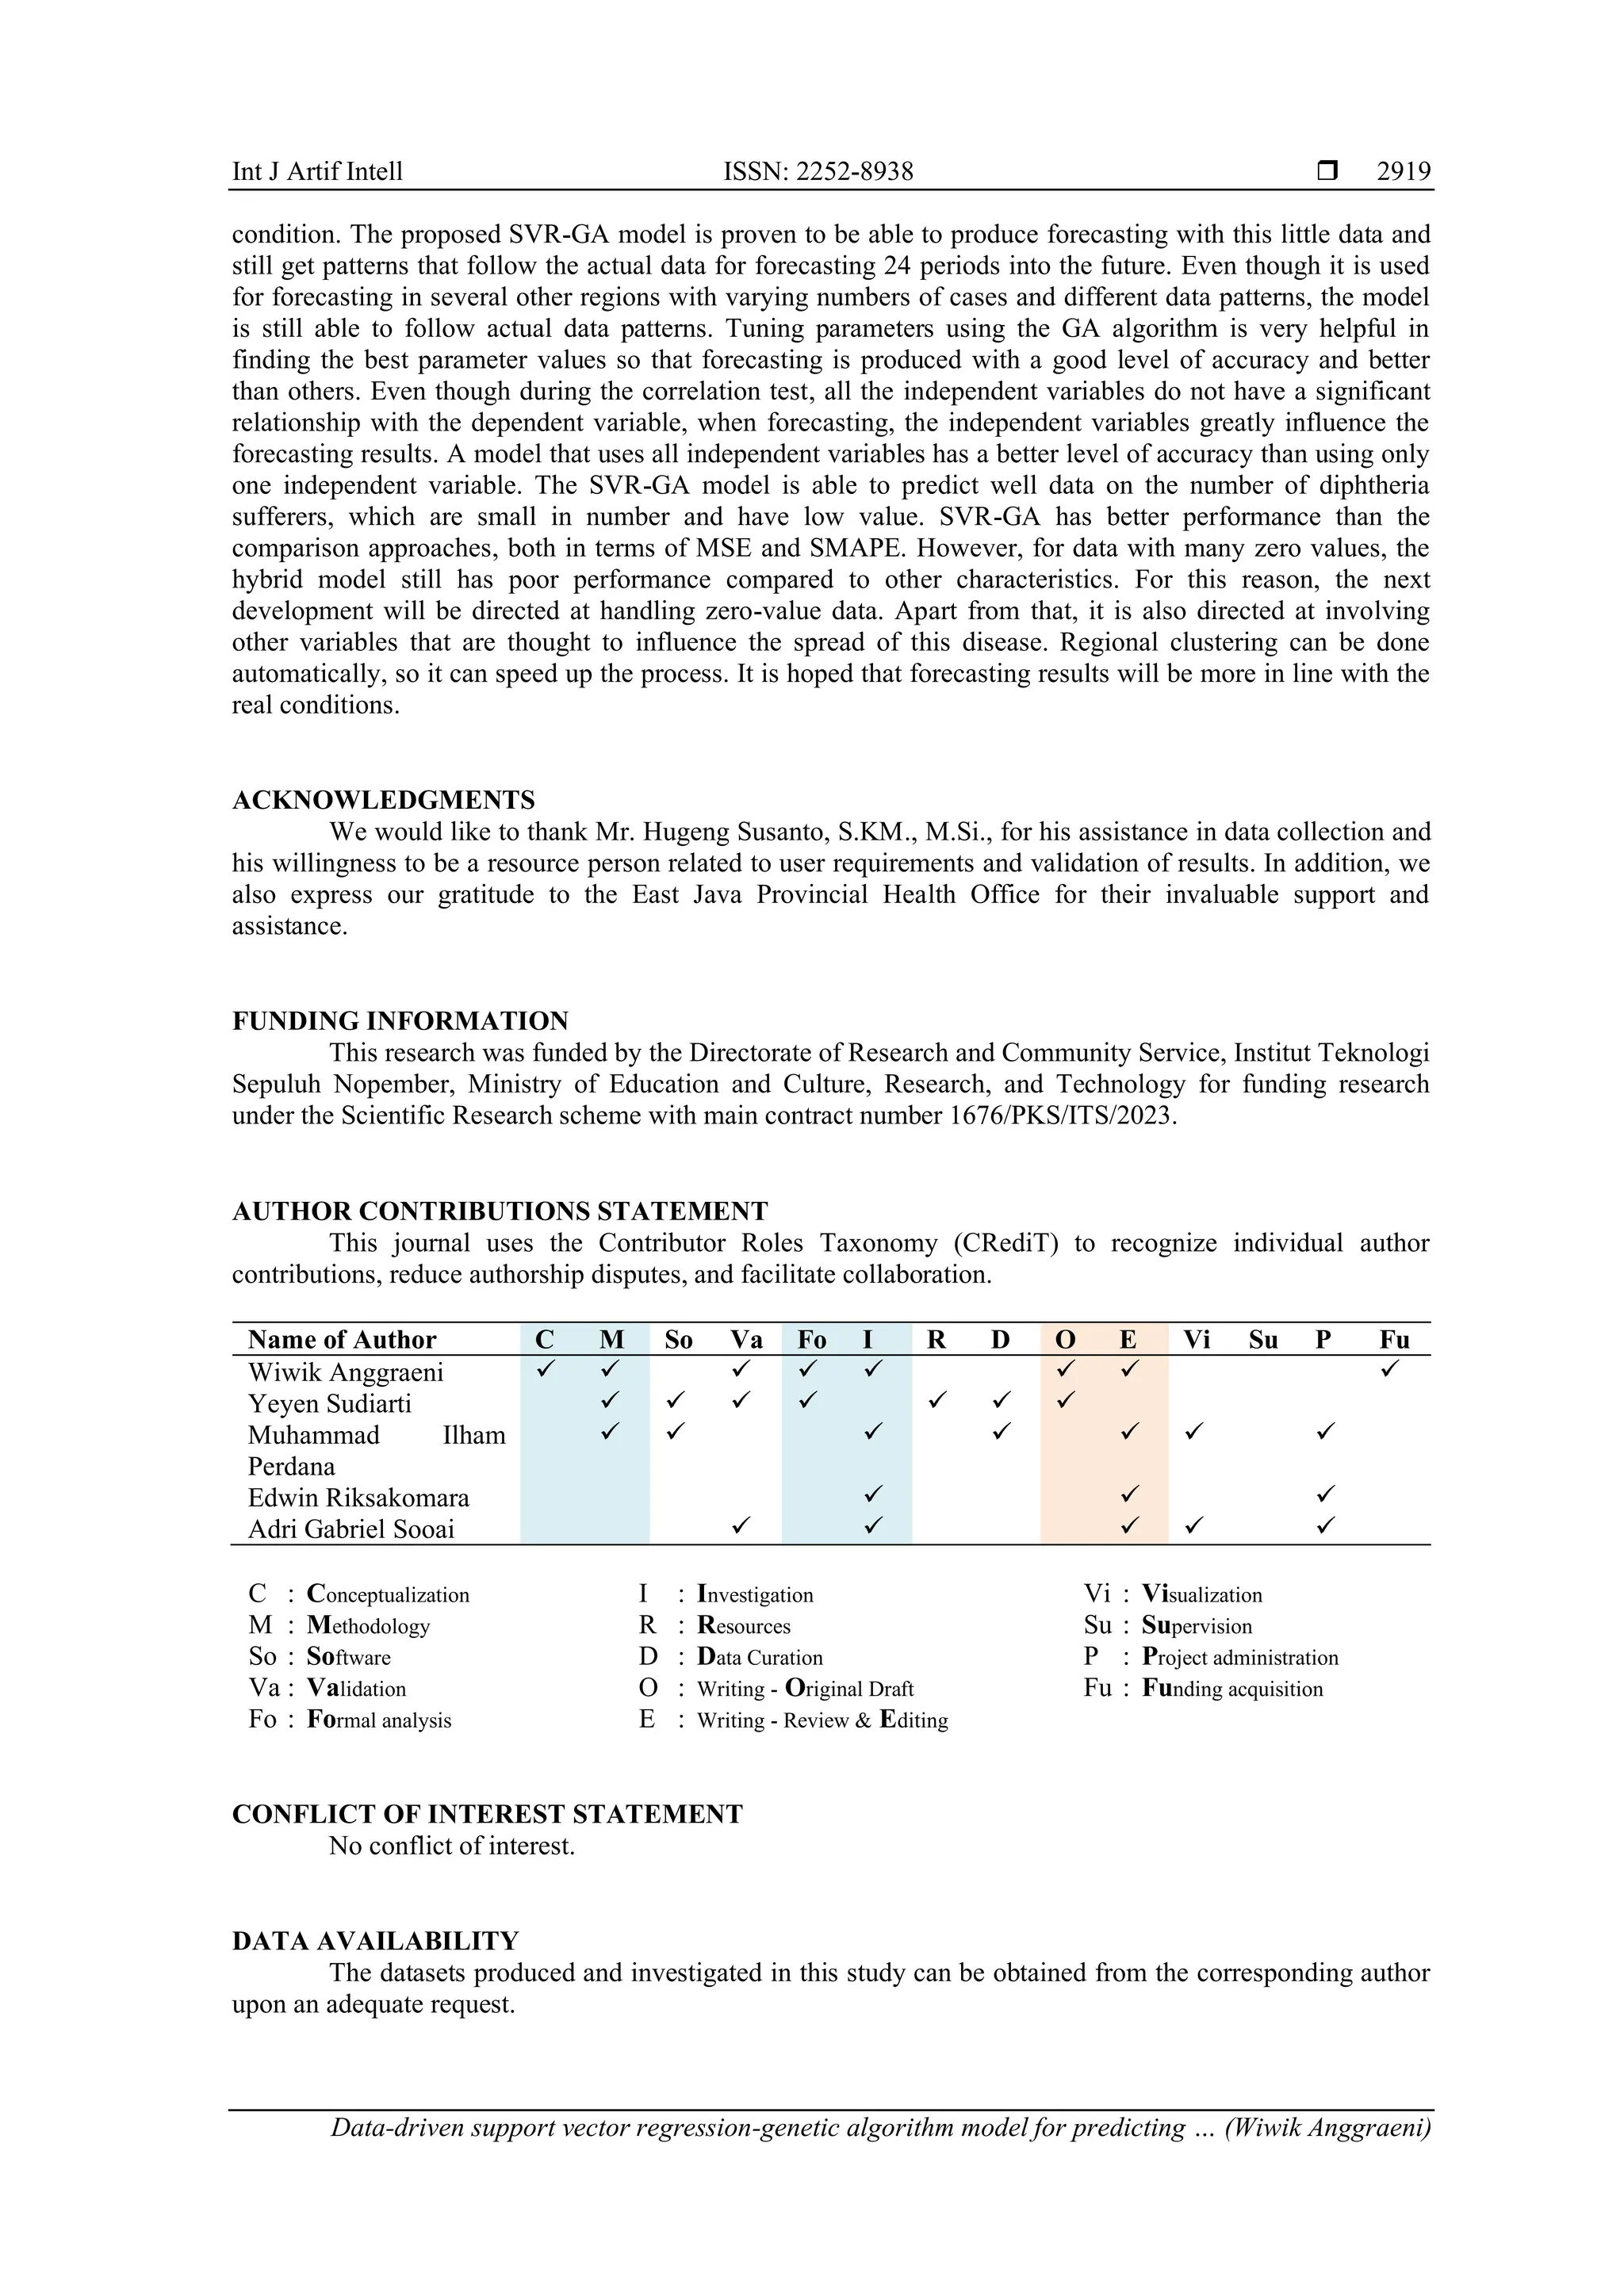
![ ISSN: 2252-8938 Int J Artif Intell, Vol. 14, No. 4, August 2025: 2909-2921 2918 prove that the model performance displayed in numerical form actually has better performance or vice versa [25]. This 2 means comparison test was carried out on MSE and MAPE for SVR-GA with the comparison method with the best performance. The null hypothesis shows that SVR-GA is not better than other methods (H0: MSESVR-GA ≥ MSEbest other method) and the competing hypothesis shows that SVR-GA is better than other methods (H1: MSESVR-GA < MSEbest other method). The confidence level used is 95%. If modeled mathematically, it becomes as shown in (9) and (10) for MSE and (11) and (12) for SMAPE. 𝐻0: 𝑀𝑆𝐸𝑆𝑉𝑅−𝐺𝐴 ≥ 𝑀𝑆𝐸𝑏𝑒𝑠𝑡 𝑜𝑡ℎ𝑒𝑟 𝑚𝑒𝑡ℎ𝑜𝑑 (9) 𝐻1: 𝑀𝑆𝐸𝑆𝑉𝑅−𝐺𝐴 < 𝑀𝑆𝐸𝑏𝑒𝑠𝑡 𝑜𝑡ℎ𝑒𝑟 𝑚𝑒𝑡ℎ𝑜𝑑 (10) 𝐻0: 𝑆𝑀𝐴𝑃𝐸𝑆𝑉𝑅−𝐺𝐴 ≥ 𝑆𝑀𝐴𝑃𝐸𝑏𝑒𝑠𝑡 𝑜𝑡ℎ𝑒𝑟 𝑚𝑒𝑡ℎ𝑜𝑑 (11) 𝐻1: 𝑆𝑀𝐴𝑃𝐸𝑆𝑉𝑅−𝐺𝐴 < 𝑆𝑀𝐴𝑃𝐸𝑏𝑒𝑠𝑡 𝑜𝑡ℎ𝑒𝑟 𝑚𝑒𝑡ℎ𝑜𝑑 (12) Table 6. Two means comparison test result based on MSE Cluster Region MSE Std. Dev. MSE t-value Critical value Status SVR-GA Best comparison method SVR-GA Best comparison method 1 SB 0.218 14.143 0.900 21.473 -2.749 -1.734 Ho Rejected BT 0.202 7.706 0.000 10.918 -2.916 -1.734 Ho Rejected TL 0.001 1.657 0.000 2.280 -3.083 -1.734 Ho Rejected BK 0.000 2.872 0.000 4.334 -2.811 -1.734 Ho Rejected 2 ML 0.000 5.175 0.000 10.640 -2.063 -1.740 Ho Rejected BU 0.000 0.659 0.000 2.246 -1.245 -1.740 Ho Rejected SD 0.000 4.169 0.000 9.489 -1.864 -1.740 Ho Rejected TB 0.000 1.683 0.000 4.417 -1.616 -1.740 Ho Rejected 3 SM 0.000 1.012 0.000 2.209 -1.943 -1.740 Ho Rejected BJ 0.008 0.218 0.000 2.215 -0.402 -1.734 Ho Rejected MG 0.003 0.341 0.000 0.983 -1.460 -1.734 Ho Rejected TG 0.000 0.551 0.000 1.274 -1.835 -1.740 Ho Rejected Table 7. Two means comparison test result based-on SMAPE Cluster Region SMAPE Std. Dev. SMAPE t-value Critical value Status SVR- GA Best comparison method SVR- GA Best comparison method 1 SB 6.420 42.421 0.242 24.667 -6.192 -1.734 Ho Rejected BT 21.851 51.349 0.382 36.189 -3.458 -1.714 Ho Rejected TL 29.791 59.775 0.500 43.139 -2.949 -1.708 Ho Rejected BK 29.582 62.379 0.461 41.697 -3.337 -1.708 Ho Rejected 2 ML 23.530 63.889 0.437 41.290 -4.147 -1.717 Ho Rejected BU 63.383 51.852 0.485 50.127 0.976 -1.684 Ho Not Rejected SD 14.090 40.444 0.323 36.141 -3.094 -1.717 Ho Rejected TB 56.342 46.296 0.485 50.018 0.852 -1.684 Ho Not Rejected 3 SM 52.940 57.407 0.514 49.581 -0.382 -1.684 Ho Rejected BJ 64.229 46.296 0.514 50.018 1.521 -1.684 Ho Not Rejected MG 67.890 38.889 0.502 50.163 2.453 -1.701 Ho Not Rejected TG 61.975 43.519 0.461 48.216 1.624 -1.684 Ho Not Rejected Tables 6 and 7 show that H0 is rejected in all regions. This shows that the performance of SVR-GA is better than other methods. However, this is different from what is shown in Table 7, where performance is seen from SMAPE. For several areas, such as BT in cluster 2, then BJ, MG, and TG in cluster 3, the performance of SVR-GA is no better than other methods. This is indicated by the status H0, which is not rejected, which means that other methods have the same or better performance than SVR-GA. The better condition of SVR-GA compared to others, especially traditional SVM and NN, supports the findings presented by [22], [24]. 4. CONCLUSION Forecasting the number of diphtheria sufferers is needed in an effort to prepare related control measures. The data used in this study is relatively small, so it requires an approach that is able to handle this](https://image.slidesharecdn.com/3325190-250911025314-fe9b08d8/75/Data-driven-support-vector-regression-genetic-algorithm-model-for-predicting-the-diphtheria-distribution-10-2048.jpg)
![ ISSN: 2252-8938 Int J Artif Intell, Vol. 14, No. 4, August 2025: 2909-2921 2920 REFERENCES [1] CDC, “Diphtheria: causes and how it spreads,” Centers for Disease Control and Prevention. Accessed: Feb. 23, 2023. [Online]. Available: https://www.cdc.gov/diphtheria/about/index.html#cdc_disease_basics_causes_risk_spread-how-it-spreads [2] WHO, “Indonesia: WHO supports lifesaving diphtheria programmes during COVID-19 pandemic,” World Health Organizatio, 2020, Accessed: Nov. 07, 2023. [Online]. Available: https://www.who.int/news-room/feature-stories/detail/indonesia-who- supports-lifesaving-diphtheria-programmes-during-covid-19-pandemic [3] E. Arguni, M. R. Karyanti, H. I. Satari, and S. R. Hadinegoro, “Diphtheria outbreak in Jakarta and Tangerang, Indonesia: epidemiological and clinical predictor factors for death,” PLOS ONE, vol. 16, no. 2, 2021, doi: 10.1371/journal.pone.0246301. [4] J. Ikejezie, B. Adebusoye, W. Ekezie, T. Langley, S. Lewis, and R. Phalkey, “Modifiable risk factors for diphtheria: a systematic review and meta-analysis,” Global Epidemiology, vol. 5, Dec. 2023, doi: 10.1016/j.gloepi.2023.100100. [5] S. Boghani et al., “A study on the characteristics and outcomes of reported diphtheria patients in a Western State in India,” Cureus, vol. 15, no. 3, 2023, doi: 10.7759/cureus.35769, doi: 10.7759/cureus.35769. [6] A. A. H. Nassar, M. A. Al-Amad, Y.A. Ghaleb, “Risk factors for diphtheria in Sana’a, Yemen, 2019: a matched case–control study,” International Journal of Infectious Diseases Regions, vol. 2, pp. 40–44, Mar. 2022, doi: 10.1016/j.ijregi.2021.11.010. [7] UNICEF Indonesia, “Indonesia’s catch-up immunization campaign tackles major decline in childhood immunization,” UNICEF Indonesia, 2022. Accessed: Nov. 08, 2023. [Online]. Available: https://www.unicef.org/indonesia/press-releases/indonesias- catch-immunization-campaign-tackles-major-decline-childhood-immunization [8] K. E. N. Clarke, “Review of the epidemiology of diphtheria–2000-2016,” US Centers for Disease Control and Prevention, World Health Organization, 2016. [9] R. González-Crespo, E. Herrera-Viedma, N. Dey, S. J. Fong, and G. Li, “Finding an accurate early forecasting model from small dataset: a case of 2019-nCoV novel coronavirus outbreak,” International Journal of Interactive Multimedia and Artificial Intelligence, vol. 6, pp. 132–140, 2020, doi: 10.9781/ijimai.2020.02.002. [10] A. Gonzales, D. Choque, P. Marcos-Carbajal, and G. Salvatierra, “Factors associated with diphtheria vaccination completion among children under five years old in Peru 2010–2019: A cross-sectional population-based study,” Heliyon, vol. 8, no. 11, Nov. 2022, doi: 10.1016/j.heliyon.2022.e11370. [11] L. Nicholson et al., “What is the true burden of diphtheria, tetanus, pertussis and poliovirus in children aged 3–18 years in Asia? A systematic literature review,” International Journal of Infectious Diseases, vol. 117, pp. 116–129, Apr. 2022, doi: 10.1016/j.ijid.2022.01.045. [12] R. Verdier, C. Marchal, M. Belhassen, M. L. Pannerer, N. Guiso, and R. Cohen, “Coverage rates for diphtheria, tetanus, poliomyelitis, and pertussis age-specific booster recommendations in France: 2018 update of the real-world cohort analysis,” Infectious Medicine, vol. 2, no. 1, pp. 51-56, Dec. 2022, doi: 10.1016/j.imj.2022.12.002. [13] I. Dadari, J. Ssenyonjo, and J. Anga, “Effective vaccine management through social behavior change communication: Exploring solutions using a participatory action research approach in the Solomon Islands,” Vaccine, vol. 38, no. 44, pp. 6941–6953, Oct. 2020, doi: 10.1016/j.vaccine.2020.08.057. [14] N. Khetsuriani et al., “Diphtheria and tetanus seroepidemiology among children in Ukraine, 2017,” Vaccine, vol. 40, no. 12, pp. 1810–1820, Mar. 2022, doi: 10.1016/j.vaccine.2022.02.006. [15] X. Li et al., “Estimating the health impact of vaccination against ten pathogens in 98 low-income and middle-income countries from 2000 to 2030: a modelling study,” The Lancet, vol. 397, no. 10272, pp. 398–408, 2021, doi: 10.1016/S0140-6736(20)32657-X. [16] W. Anggraeni, D. Nandika, F. Mahananto, Y. Sudiarti, and C. A. Fadhilla, “Diphtheria case number forecasting using radial basis function neural network,” in 2019 3rd International Conference on Informatics and Computational Sciences (ICICoS), pp. 1–6, Oct. 2019, doi: 10.1109/ICICoS48119.2019.8982403. [17] W. Anggraeni, M. Firdausiah, and M. I. Perdana, “Forecasting the case number of infectious diseases using type-2 fuzzy logic for a diphtheria case study,” Engineering Proceedings, vol. 39, no. 1, 2023, doi: 10.3390/engproc2023039003. [18] G. Hu, Z. Xu, G. Wang, B. Zeng, Y. Liu, and Y. Lei, “Forecasting energy consumption of long-distance oil products pipeline based on improved fruit fly optimization algorithm and support vector regression,” Energy, vol. 224, 2021, doi: 10.1016/j.energy.2021.120153. [19] D. Parbat, M. Chakraborty, “A python based support vector regression model for prediction of COVID19 cases in India,” Chaos, Solitons & Fractals, vol. 138, Sep. 2020, doi: 10.1016/j.chaos.2020.109942. [20] C. Peng, Z. Che, T. W. Liao, and Z. Zhang, “Prediction using multi-objective slime mould algorithm optimized support vector regression model,” Applied Soft Computing, vol. 145, Sep. 2023, doi: 10.1016/j.asoc.2023.110580. [21] C. Rao, Y. Zhang, J. Wen, X. Xiao, and M. Goh, “Energy demand forecasting in China: a support vector regression-compositional data second exponential smoothing model,” Energy, vol. 263, Jan. 2023, doi: 10.1016/j.energy.2022.125955. [22] K. Chen and C. Wang, “Support vector regression with genetic algorithms in forecasting tourism demand,” Tourism Management, vol. 28, pp. 215–226, 2007, doi: 10.1016/j.tourman.2005.12.018. [23] Z. Liu, G. Dong, and Y. Gui, “Data-driven emergency evacuation decision for cruise ports under COVID-19: an improved genetic algorithm and simulation,” Physica A: Statistical Mechanics and its Applications, vol. 629, 2023, doi: 10.1016/j.physa.2023.129094. [24] S. Liu, H. Tai, Q. Ding, D. Li, L. Xu, and Y. Wei, “A hybrid approach of support vector regression with genetic algorithm optimization for aquaculture water quality prediction,” Mathematical and Computer Modelling, vol. 58, pp. 458–465, 2013, doi: 10.1016/j.mcm.2011.11.021. [25] W. Anggraeni et al., “A hybrid EMD-GRNN-PSO in intermittent time-series data for dengue fever forecasting,” Expert Systems with Applications, vol. 237, Mar. 2024, doi: 10.1016/j.eswa.2023.121438. [26] V. Anandhi and R. M. Chezian, “Support vector regression to forecast the demand and supply of pulpwood,” International Journal of Future Computer and Communication, vol. 2, no. 3, pp. 266–269, 2013, doi: 10.7763/IJFCC.2013.V2.165. [27] M. Beniwal, A. Singh, and N. Kumar, “Forecasting long-term stock prices of global indices: a forward-validating genetic algorithm optimization approach for support vector regression,” Applied Soft Computing, vol. 145, 2023, doi: 10.1016/j.asoc.2023.110566. [28] C. Shoko and C. Sigauke, “Short-term forecasting of COVID-19 using support vector regression: an application using Zimbabwean data,” American Journal of Infection Control, vol. 51, no. 10, pp. 1095–1107, 2023, doi: 10.1016/j.ajic.2023.03.010. [29] G. R. Brindha, B. S. Rishiikeshwer, B. Santhi, K. Nakendraprasath, R. Manikandan, and A. H. Gandomi, “Precise prediction of multiple anticancer drug efficacy using multi target regression and support vector regression analysis,” Computer Methods and Programs in Biomedicine, vol. 224, Sep. 2022, doi: 10.1016/j.cmpb.2022.107027. [30] O. Nadirgil, “Carbon price prediction using multiple hybrid machine learning models optimized by genetic algorithm,” Journal of Environmental Management, vol. 342, Sep. 2023, doi: 10.1016/j.jenvman.2023.118061. [31] E. Mussumeci and F. C. Coelho, “Large-scale multivariate forecasting models for dengue-LSTM versus random forest regression,” Spatial and Spatio-temporal Epidemiology, vol. 35, Nov. 2020, doi: 10.1016/j.sste.2020.100372.](https://image.slidesharecdn.com/3325190-250911025314-fe9b08d8/75/Data-driven-support-vector-regression-genetic-algorithm-model-for-predicting-the-diphtheria-distribution-12-2048.jpg)