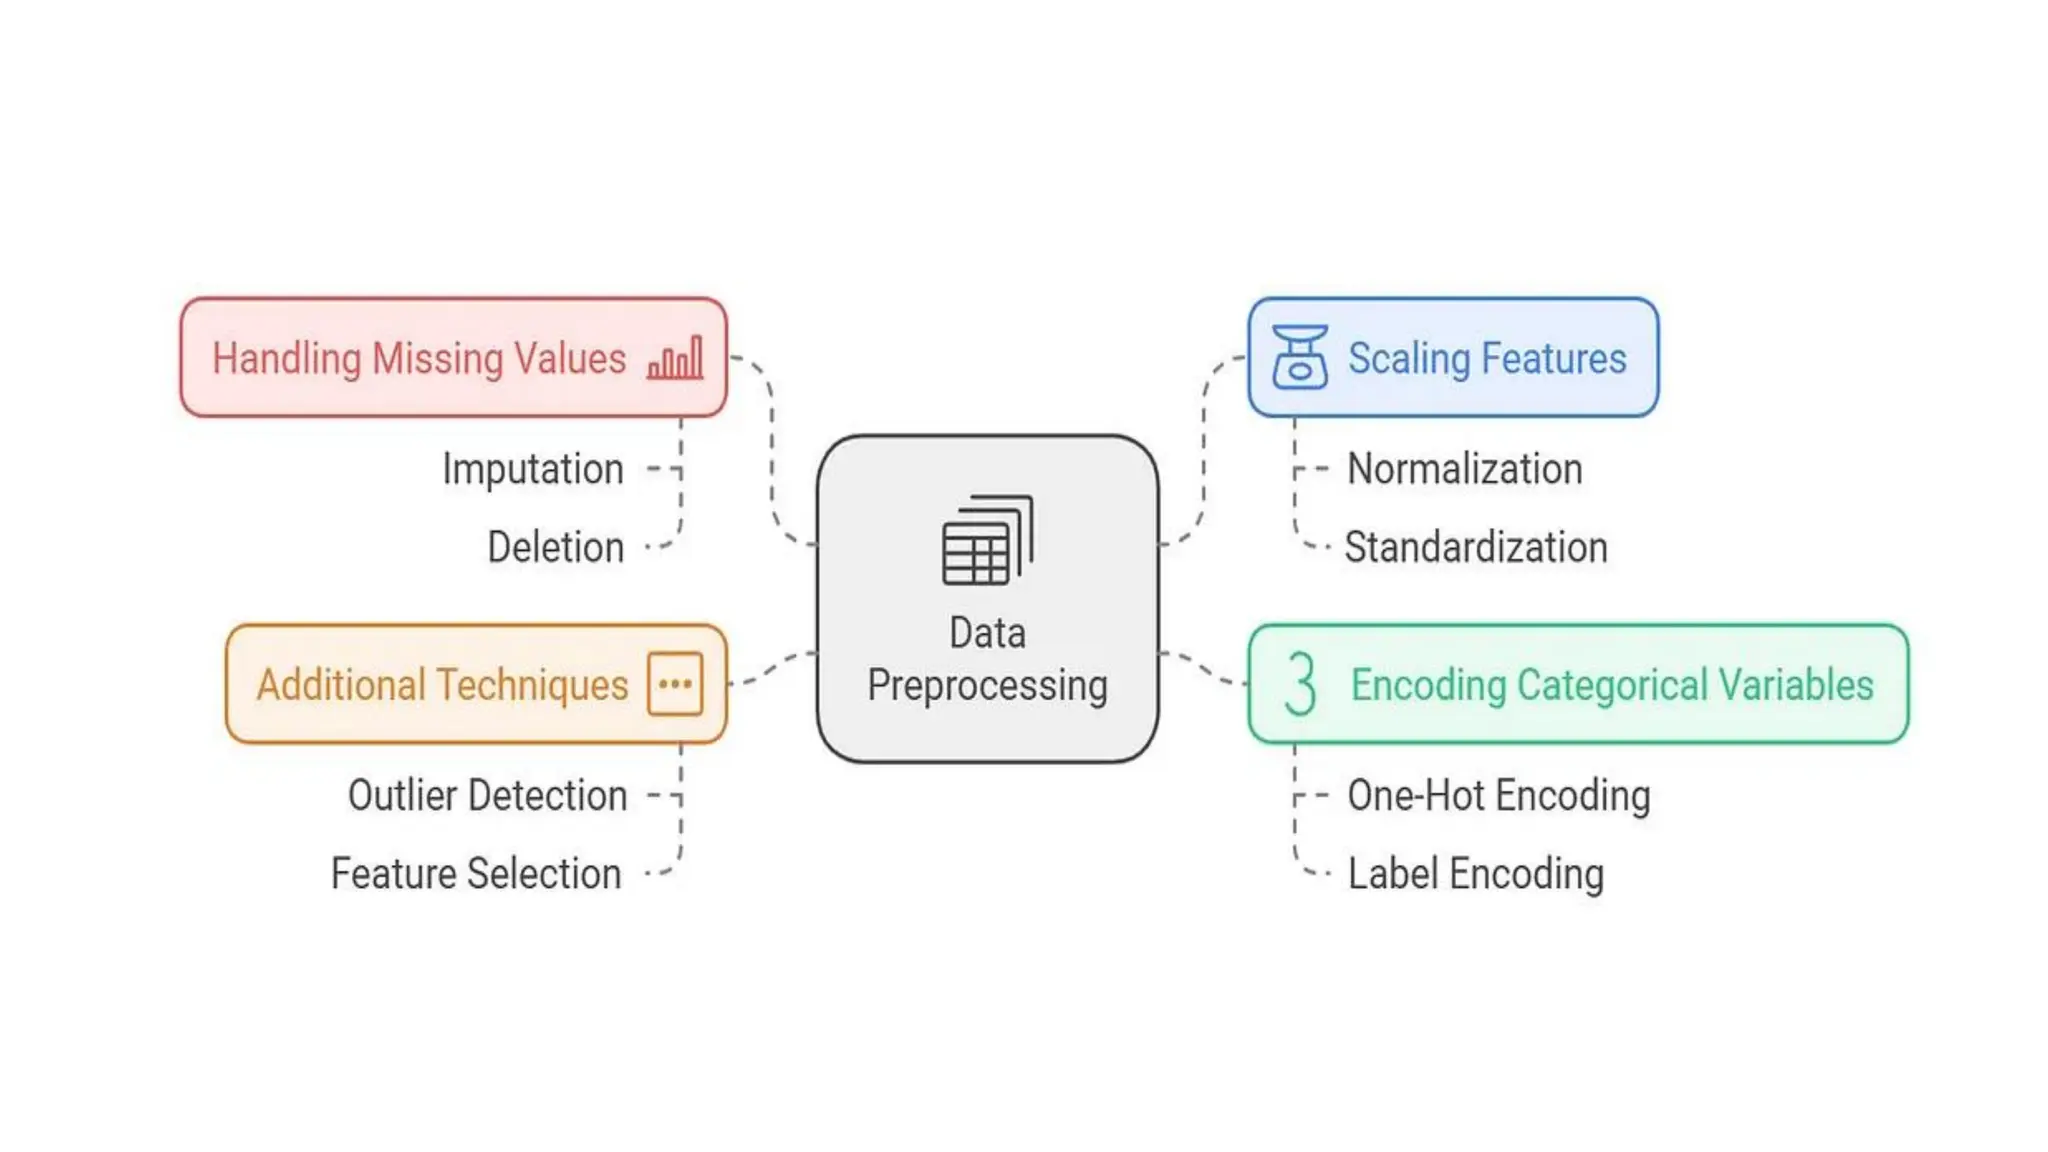
What is DataPreprocessing? Data preprocessing is a key aspect of data preparation. It refers to any processing applied to raw data to ready it for further analysis or processing tasks. Thus, data preprocessing may be defined as the process of converting raw data into a format that can be processed more efficiently and accurately in tasks such as: • Data analysis • Machine learning • Data science • AI
3.
Steps in DataPreprocessing • Step 1: Data cleaning • Handling missing values • Removing duplicates • Correcting inconsistent formats • Step 2: Data integration • Schema matching • Data deduplication
4.
• Step 3:Data transformation • Scaling and normalization • Encoding categorical variables • Feature engineering and extraction • Step 4: Data reduction • Feature selection • Principal component analysis (PCA) • Sampling methods
6.
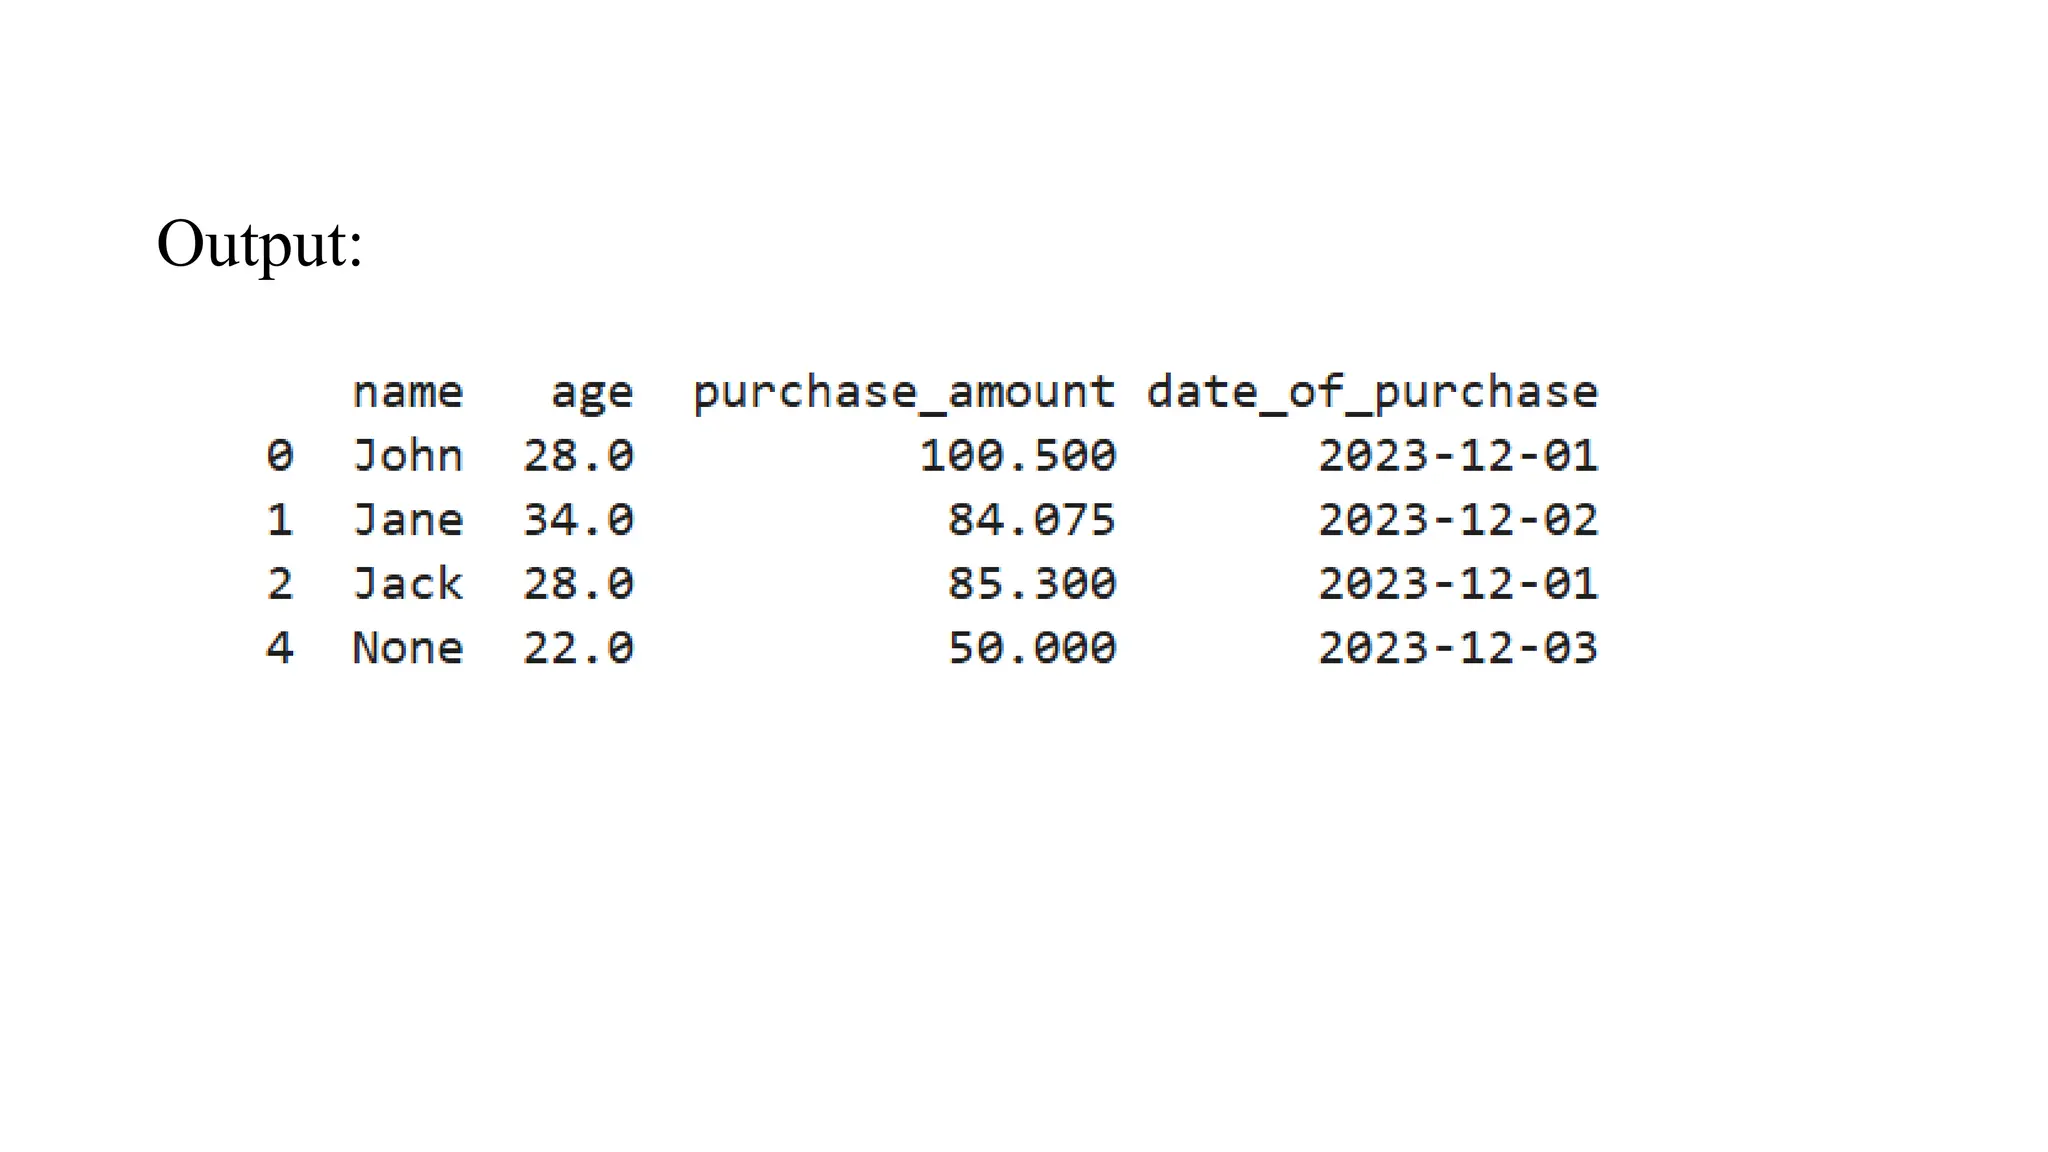
Data Cleaning Tool: HandlingMissing Values # Creating a manual dataset data = pd.DataFrame({ 'name': ['John', 'Jane', 'Jack', 'John', None], 'age': [28, 34, None, 28, 22], 'purchase_amount': [100.5, None, 85.3, 100.5, 50.0], 'date_of_purchase': ['2023/12/01', '2023/12/02', '2023/12/01', '2023/12/01', '2023/12/03'] }) # Handling missing values using mean imputation for 'age' and 'purchase_amount' imputer = SimpleImputer(strategy='mean') data[['age', 'purchase_amount']] = imputer.fit_transform(data[['age', 'purchase_amount']]) # Removing duplicate rows data = data.drop_duplicates() print(data)
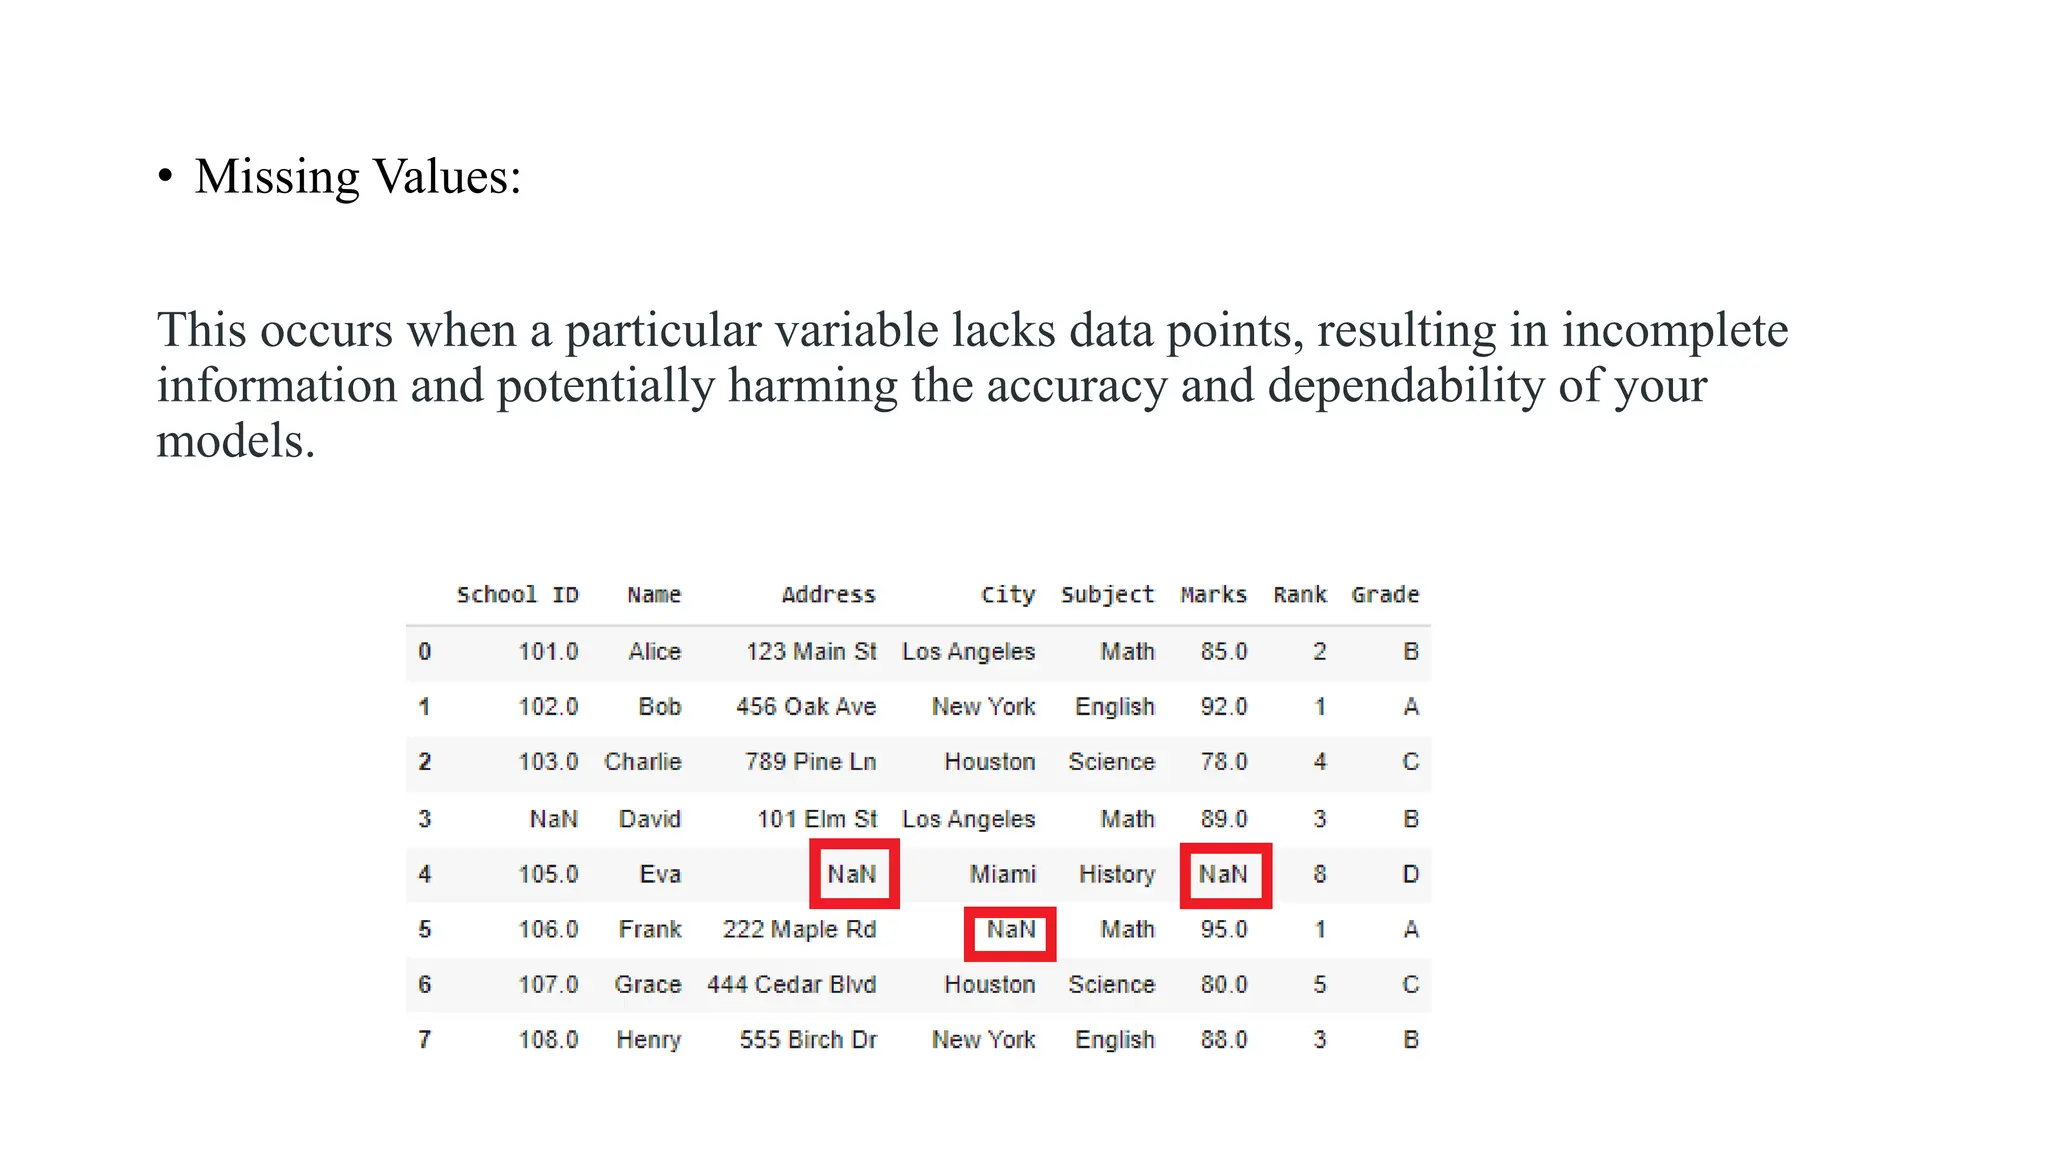
• Missing Values: Thisoccurs when a particular variable lacks data points, resulting in incomplete information and potentially harming the accuracy and dependability of your models.
9.
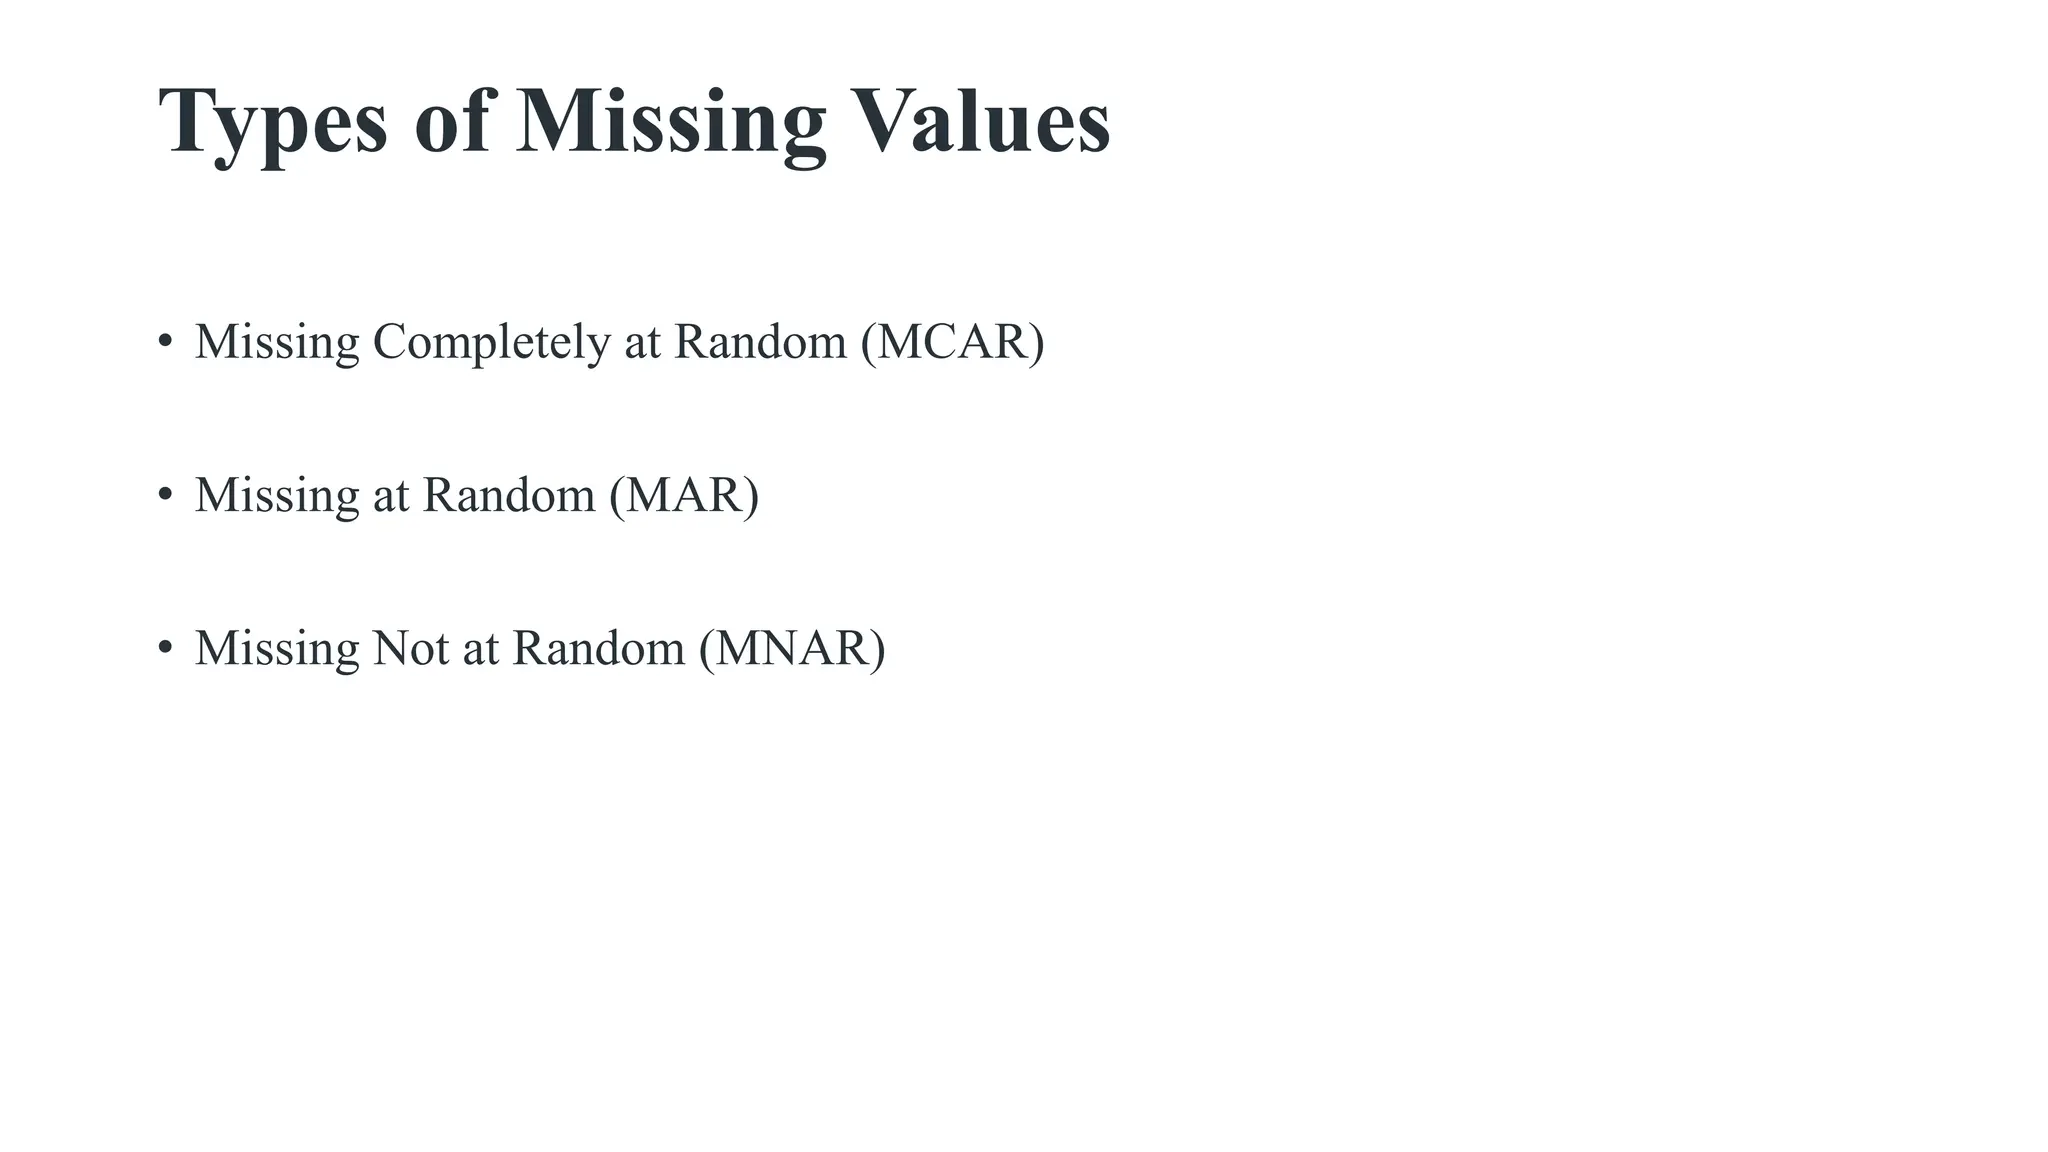
Types of MissingValues • Missing Completely at Random (MCAR) • Missing at Random (MAR) • Missing Not at Random (MNAR)
10.
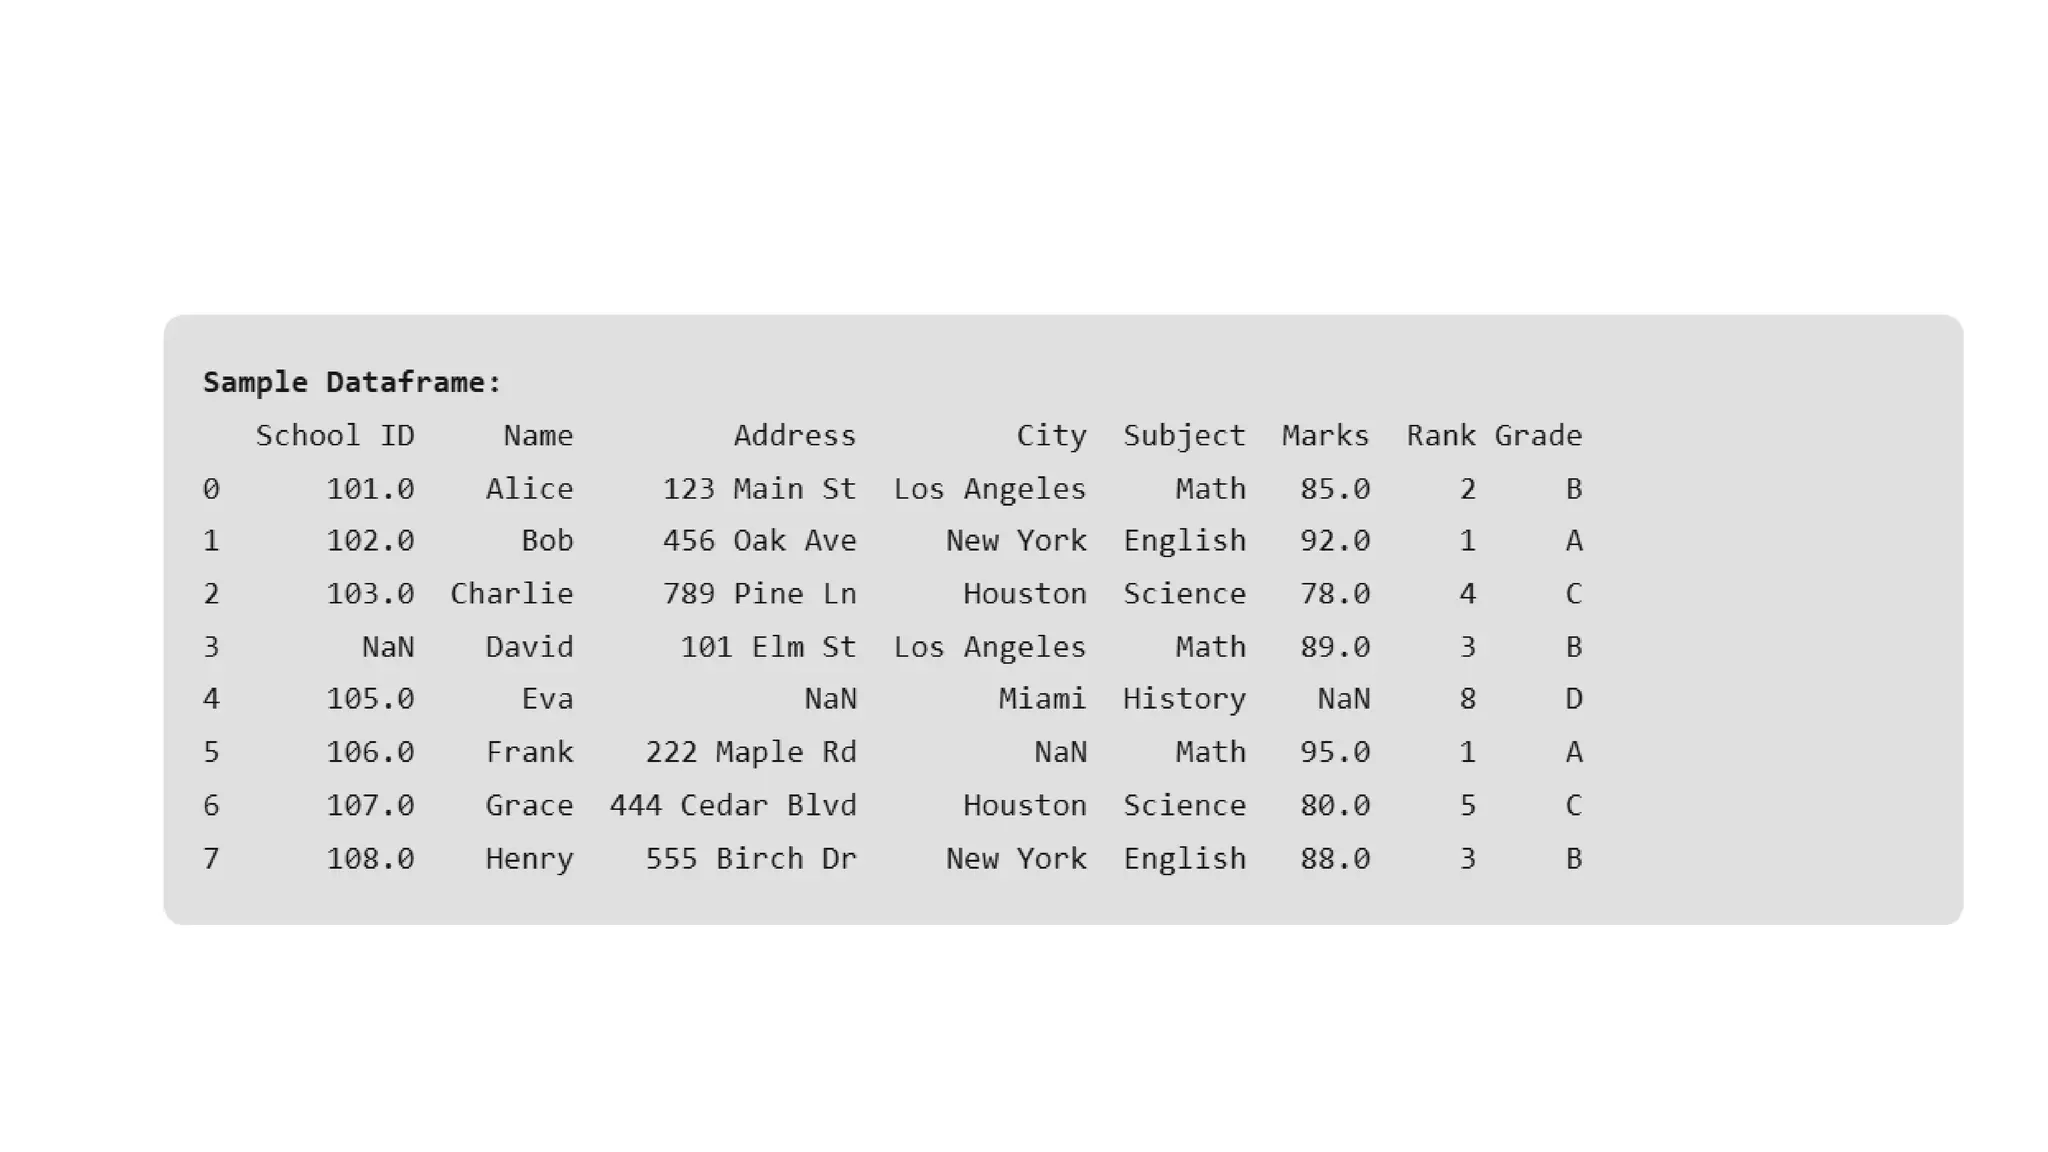
Effective Strategies forHandling Missing Values in Data Analysis import pandas as pd import numpy as np # Creating a sample DataFrame with missing values data = { 'School ID': [101, 102, 103, np.nan, 105, 106, 107, 108], 'Name': ['Alice', 'Bob', 'Charlie', 'David', 'Eva', 'Frank', 'Grace', 'Henry'], 'Address': ['123 Main St', '456 Oak Ave', '789 Pine Ln', '101 Elm St', np.nan, '222 Maple Rd', '444 Cedar Blvd', '555 Birch Dr'], 'City': ['Los Angeles', 'New York', 'Houston', 'Los Angeles', 'Miami', np.nan, 'Houston', 'New York'], 'Subject': ['Math', 'English', 'Science', 'Math', 'History', 'Math', 'Science', 'English'], 'Marks': [85, 92, 78, 89, np.nan, 95, 80, 88], 'Rank': [2, 1, 4, 3, 8, 1, 5, 3], 'Grade': ['B', 'A', 'C', 'B', 'D', 'A', 'C', 'B'] } df = pd.DataFrame(data) print("Sample DataFrame:") print(df)
12.
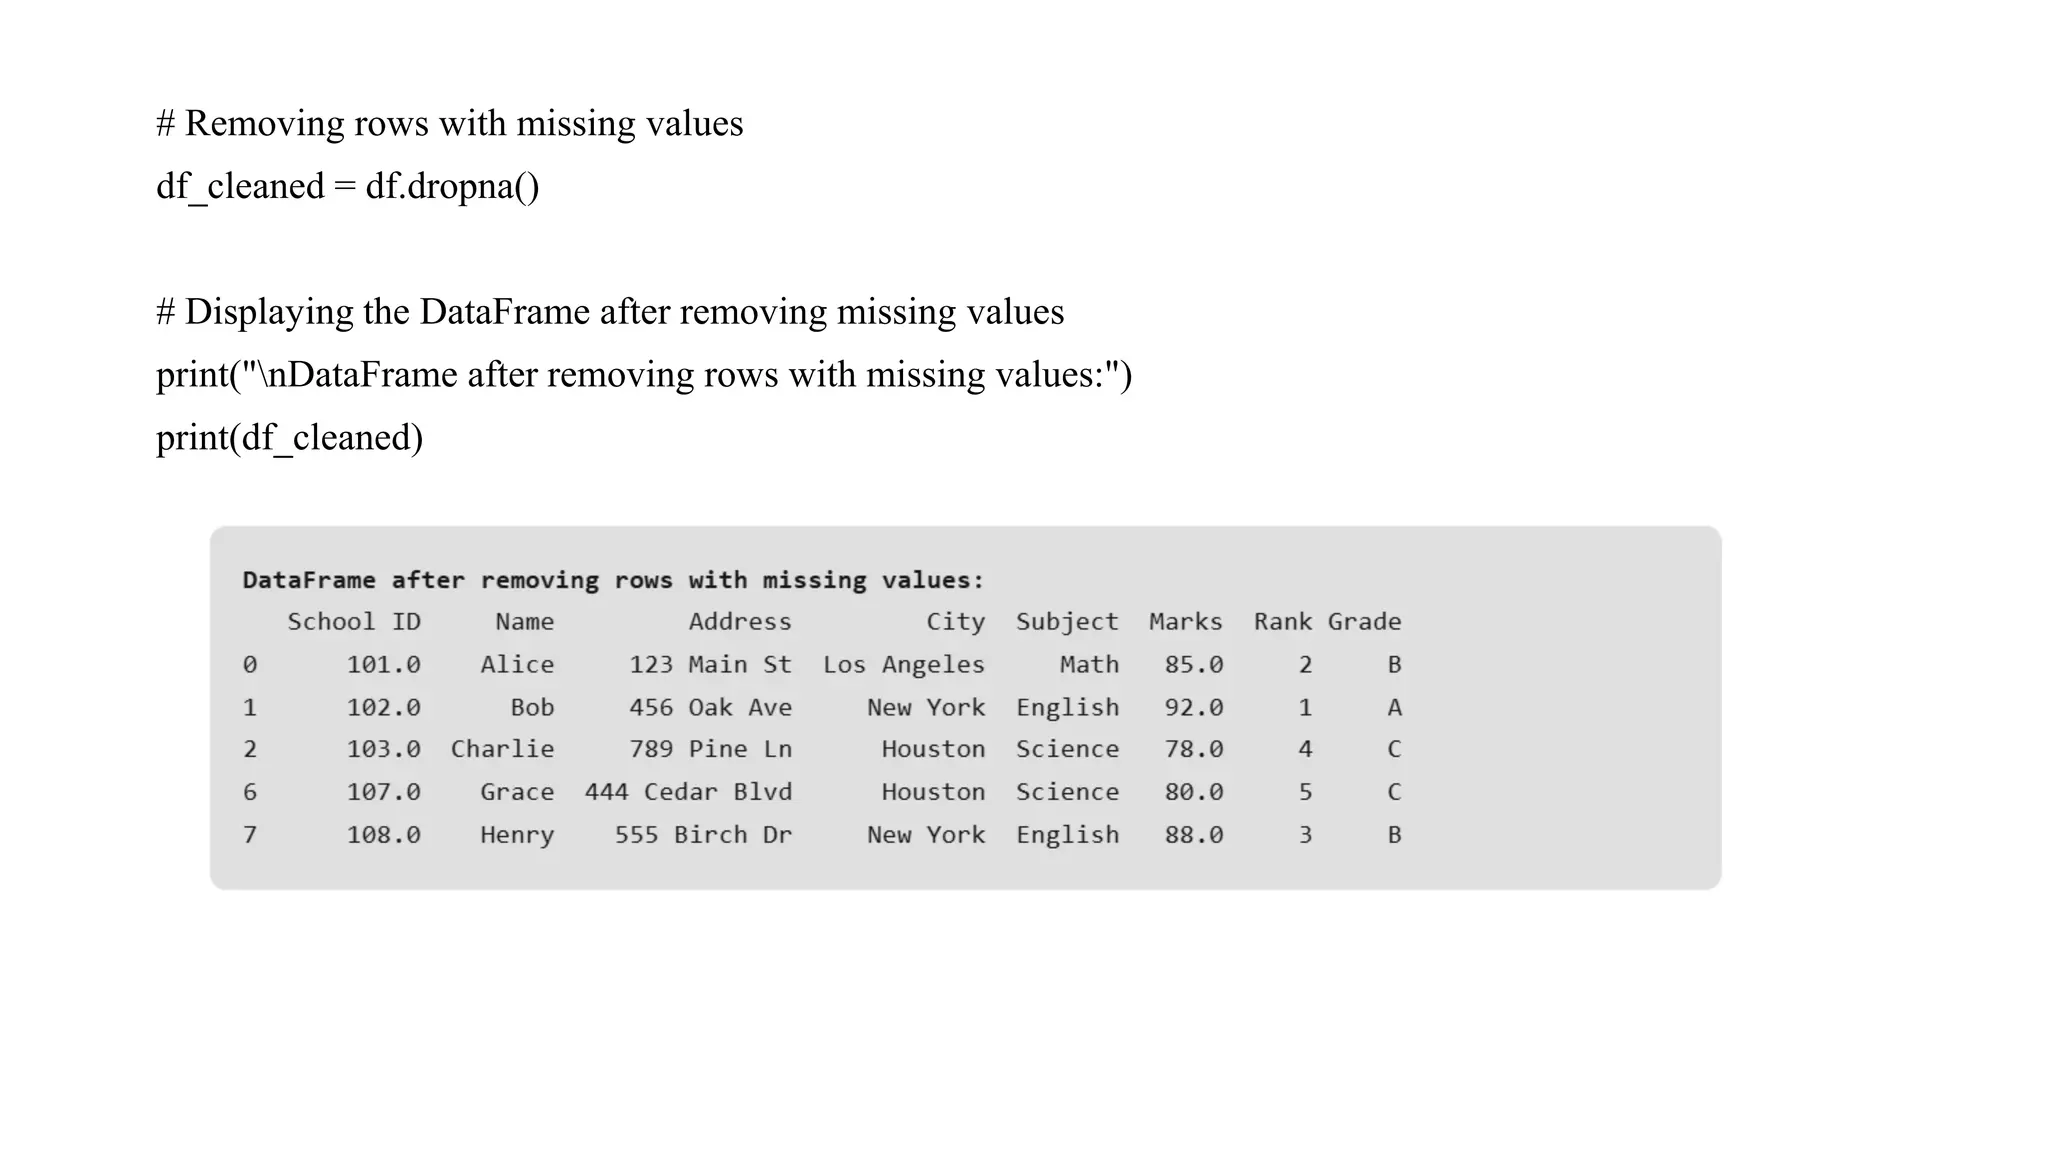
# Removing rowswith missing values df_cleaned = df.dropna() # Displaying the DataFrame after removing missing values print("nDataFrame after removing rows with missing values:") print(df_cleaned)
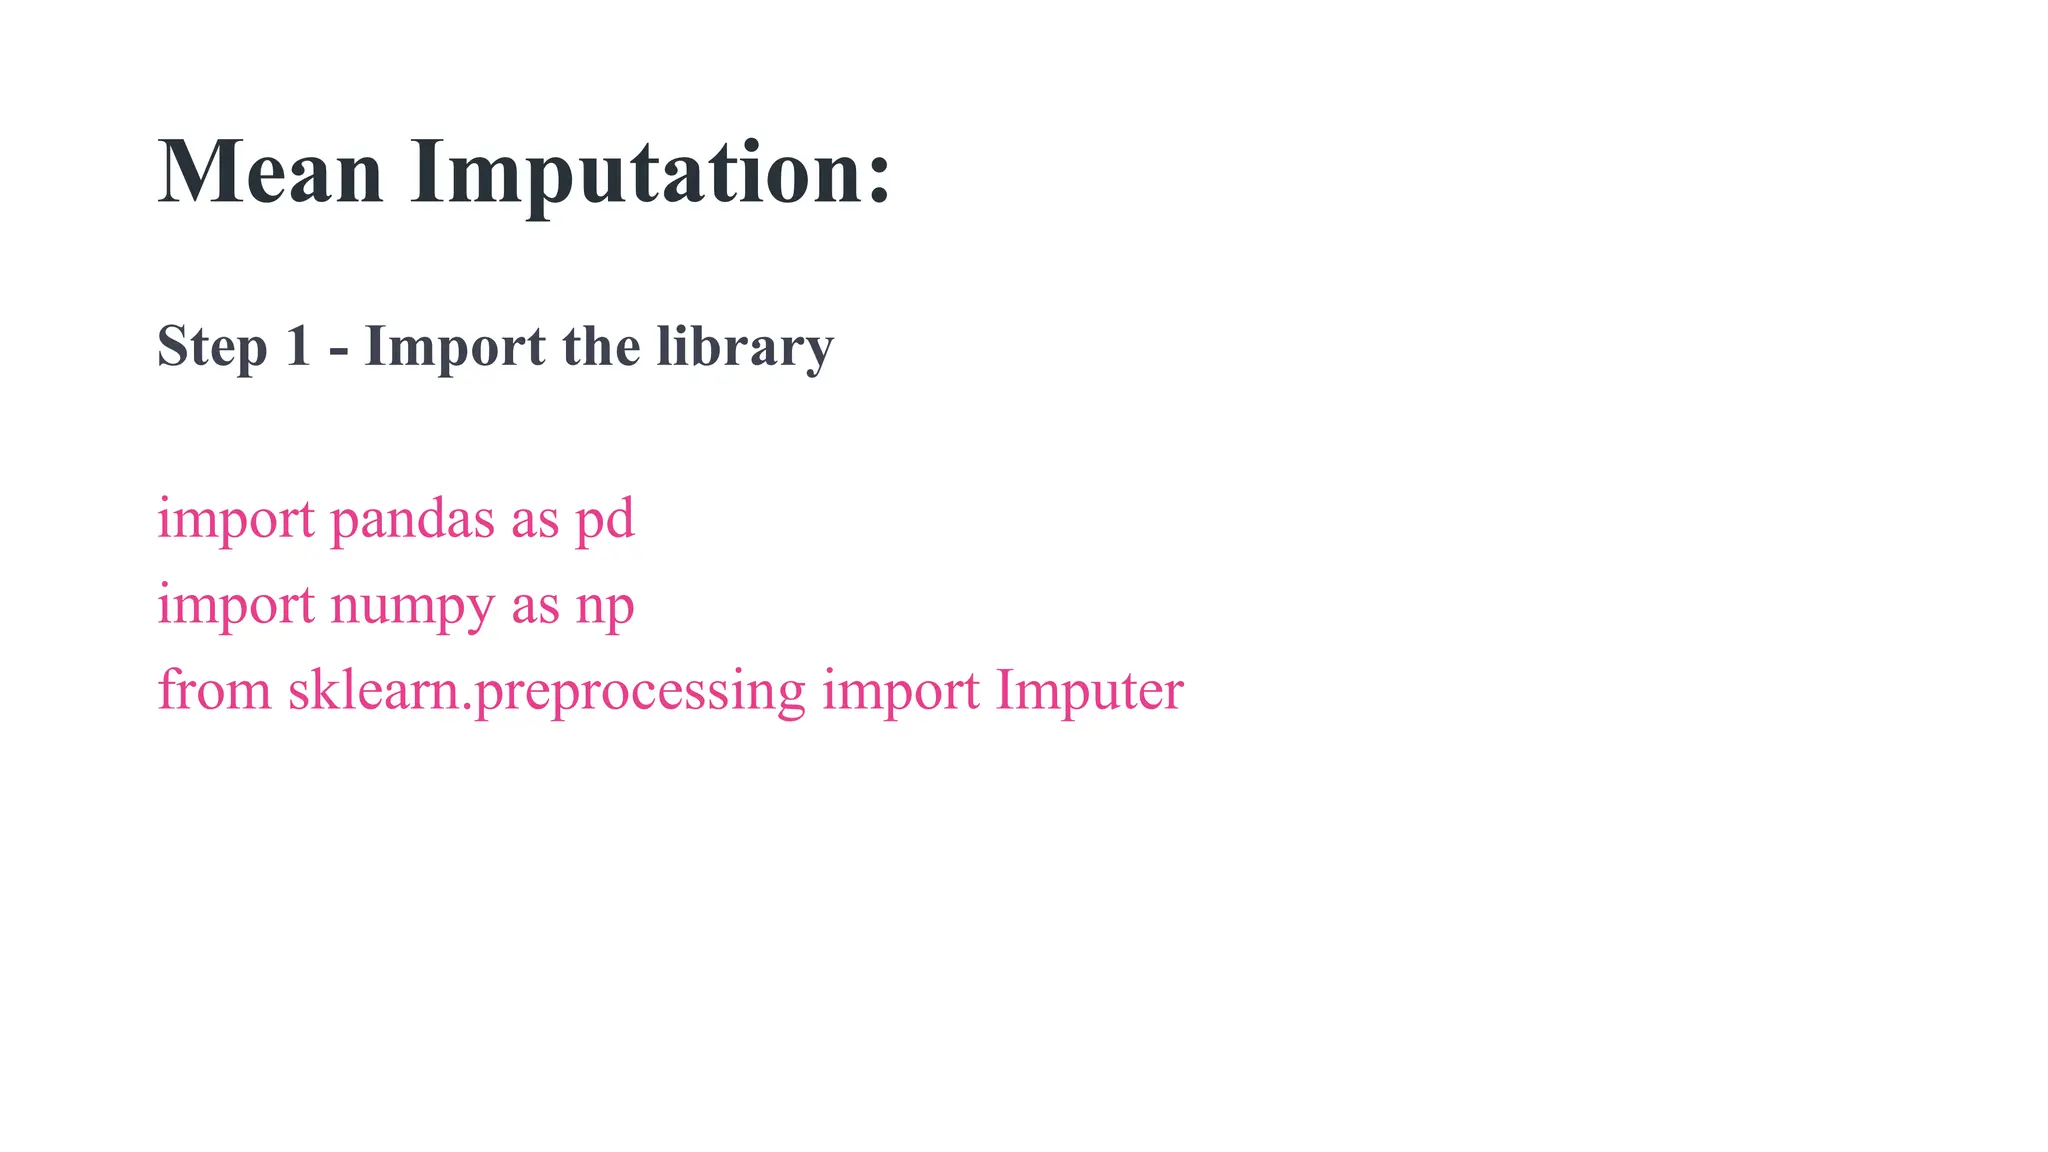
Mean Imputation: Step 1- Import the library import pandas as pd import numpy as np from sklearn.preprocessing import Imputer
15.
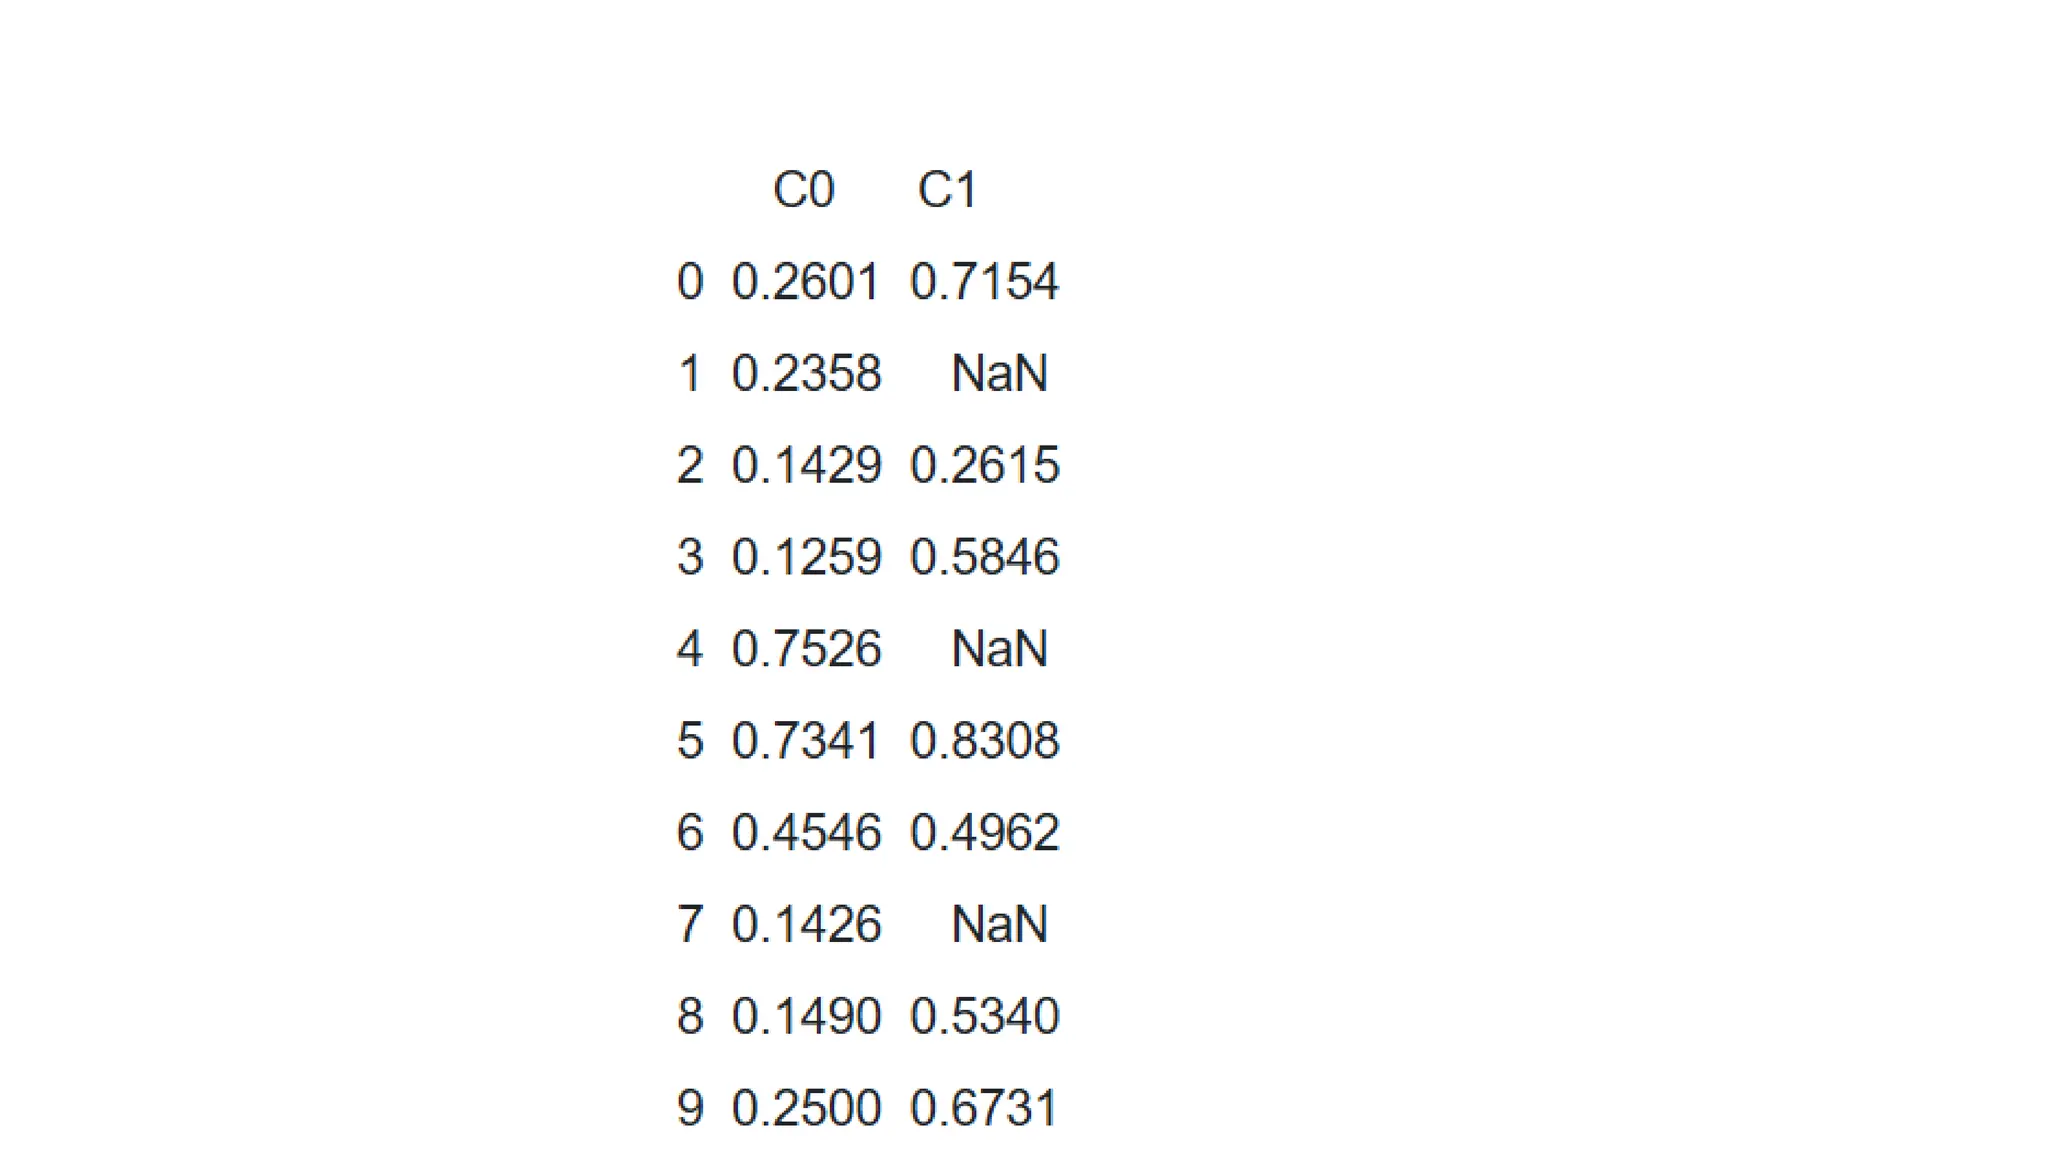
Step 2 -Setting up the Data df = pd.DataFrame() df['C0'] = [0.2601,0.2358,0.1429,0.1259,0.7526, 0.7341,0.4546,0.1426,0.1490,0.2500] df['C1'] = [0.7154,np.nan,0.2615,0.5846,np.nan, 0.8308,0.4962,np.nan,0.5340,0.6731] print(df)
16.
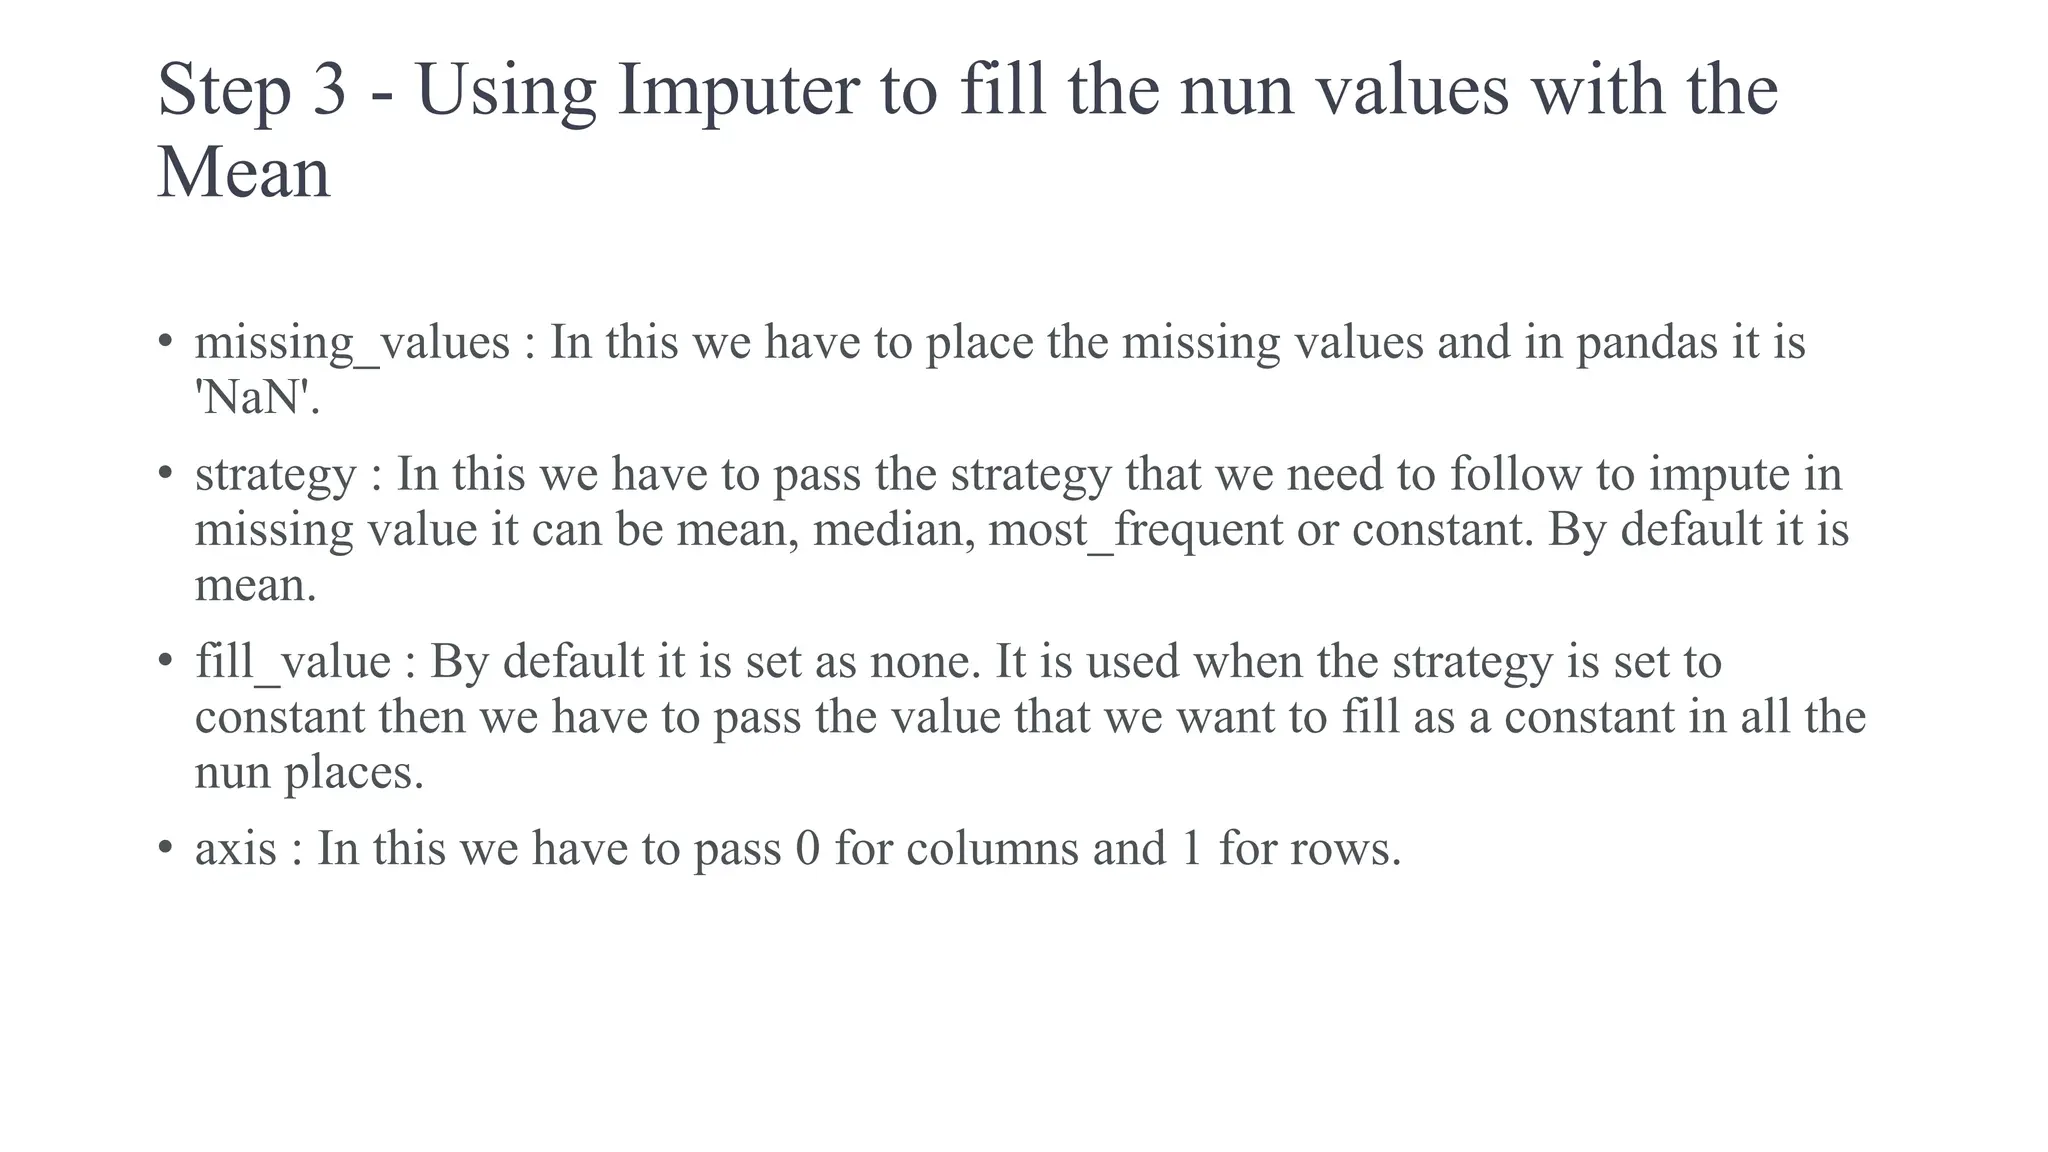
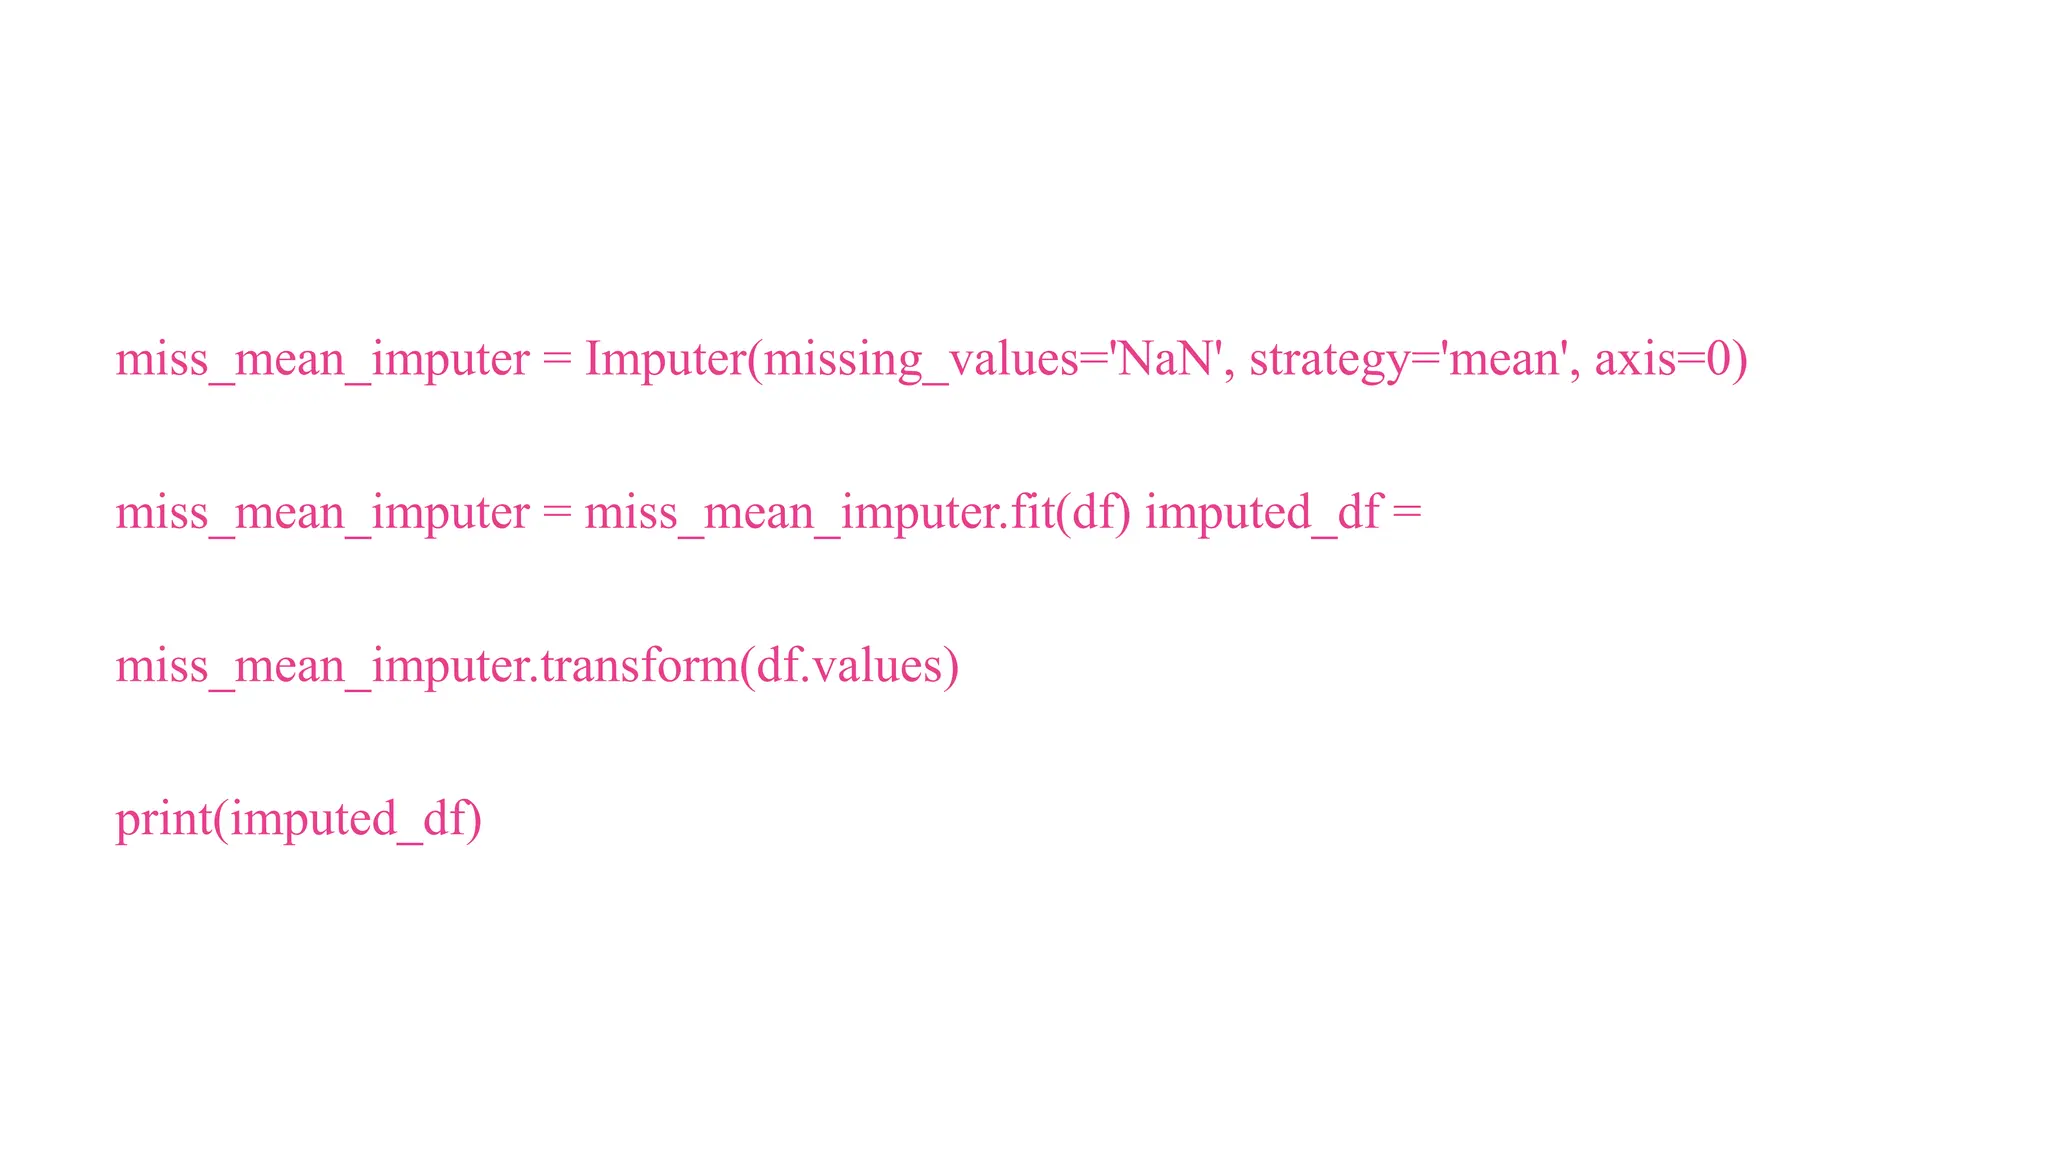
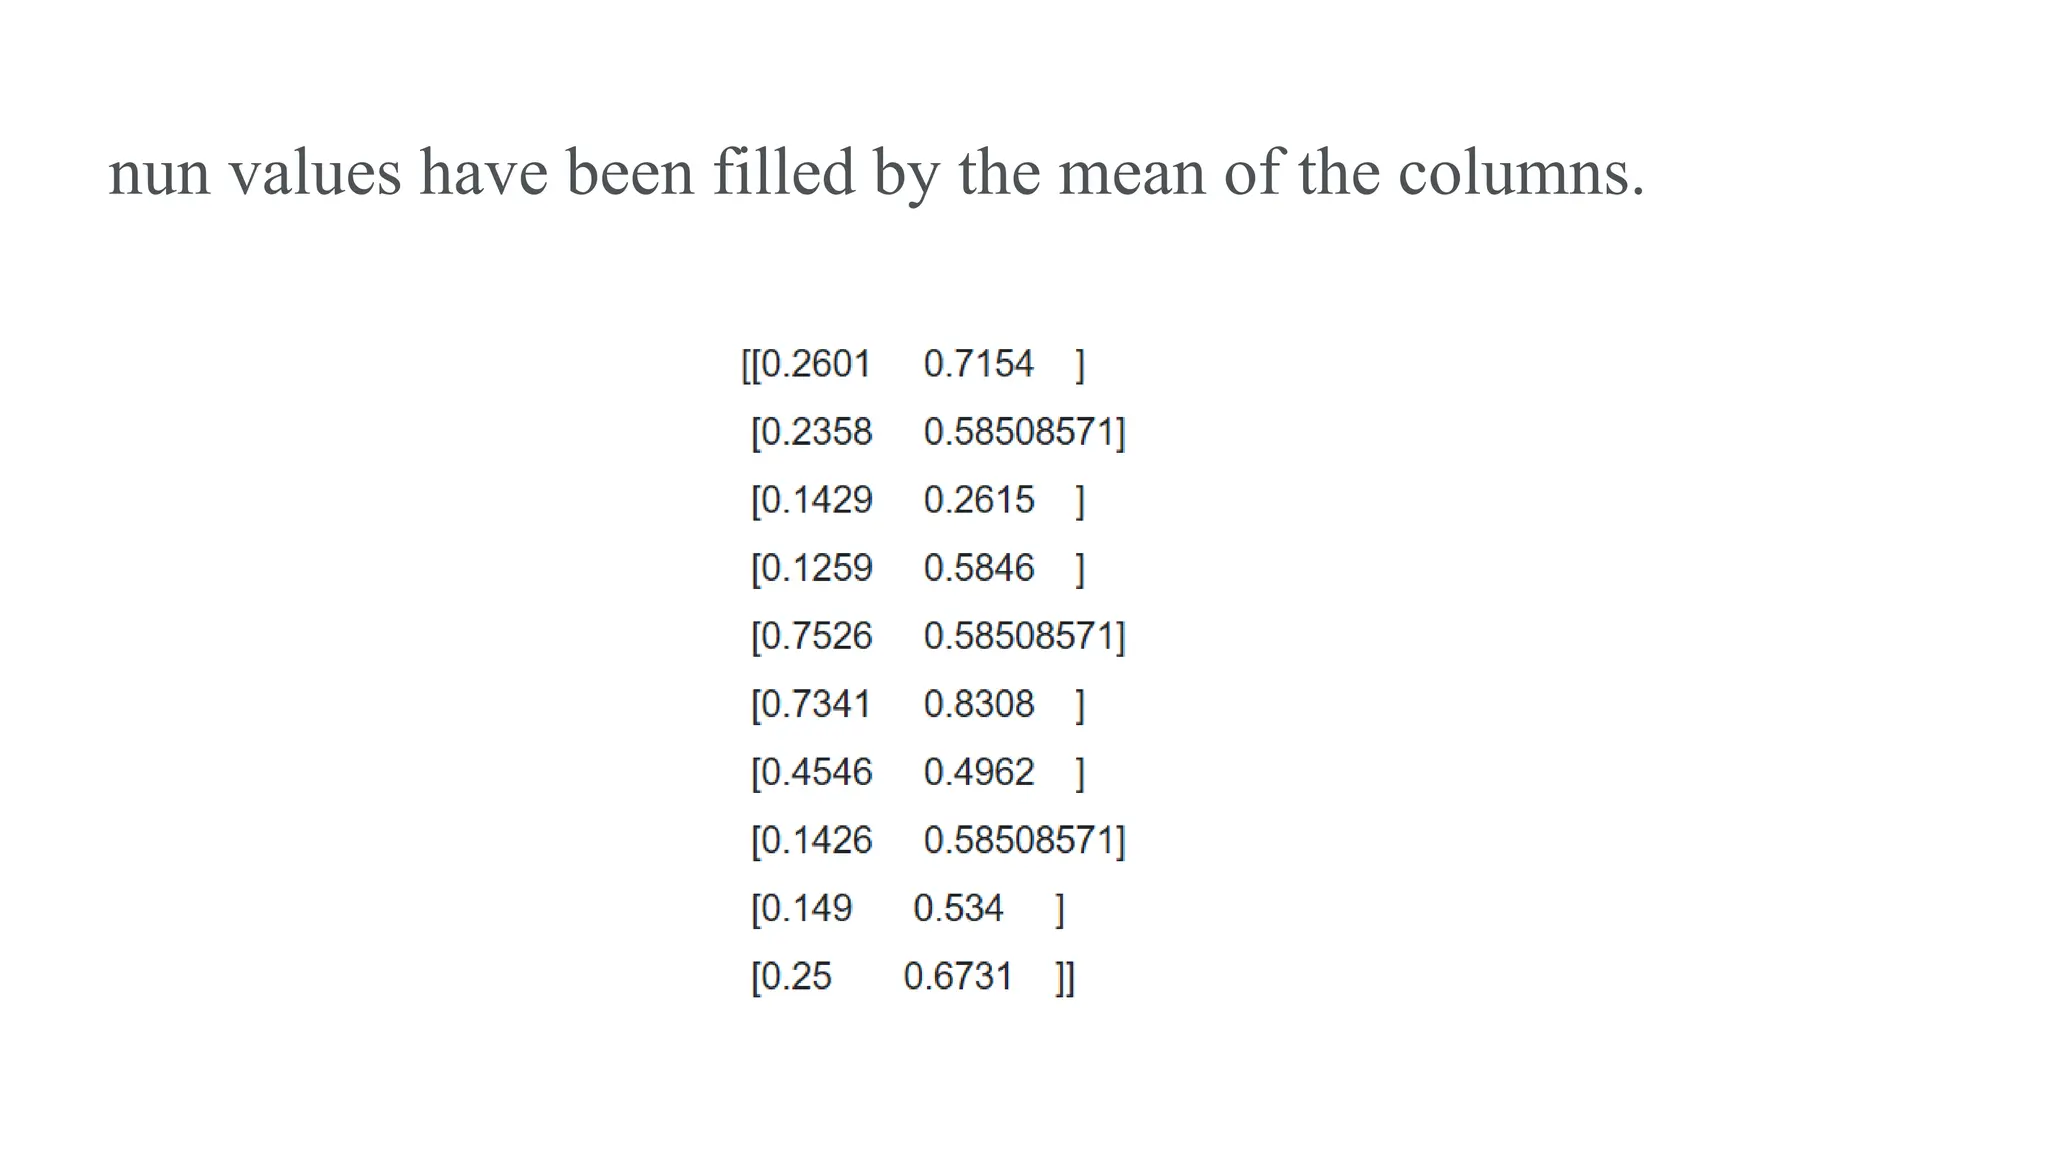
Step 3 -Using Imputer to fill the nun values with the Mean • missing_values : In this we have to place the missing values and in pandas it is 'NaN'. • strategy : In this we have to pass the strategy that we need to follow to impute in missing value it can be mean, median, most_frequent or constant. By default it is mean. • fill_value : By default it is set as none. It is used when the strategy is set to constant then we have to pass the value that we want to fill as a constant in all the nun places. • axis : In this we have to pass 0 for columns and 1 for rows.
Median Imputation: • Itis the middle value of a dataset when it is ordered from lowest to highest. • If there is an even number of values, the median is the average of the two middle values. • the mean, the median is not affected by outliers, making it a more reliable measure for skewed distributions.
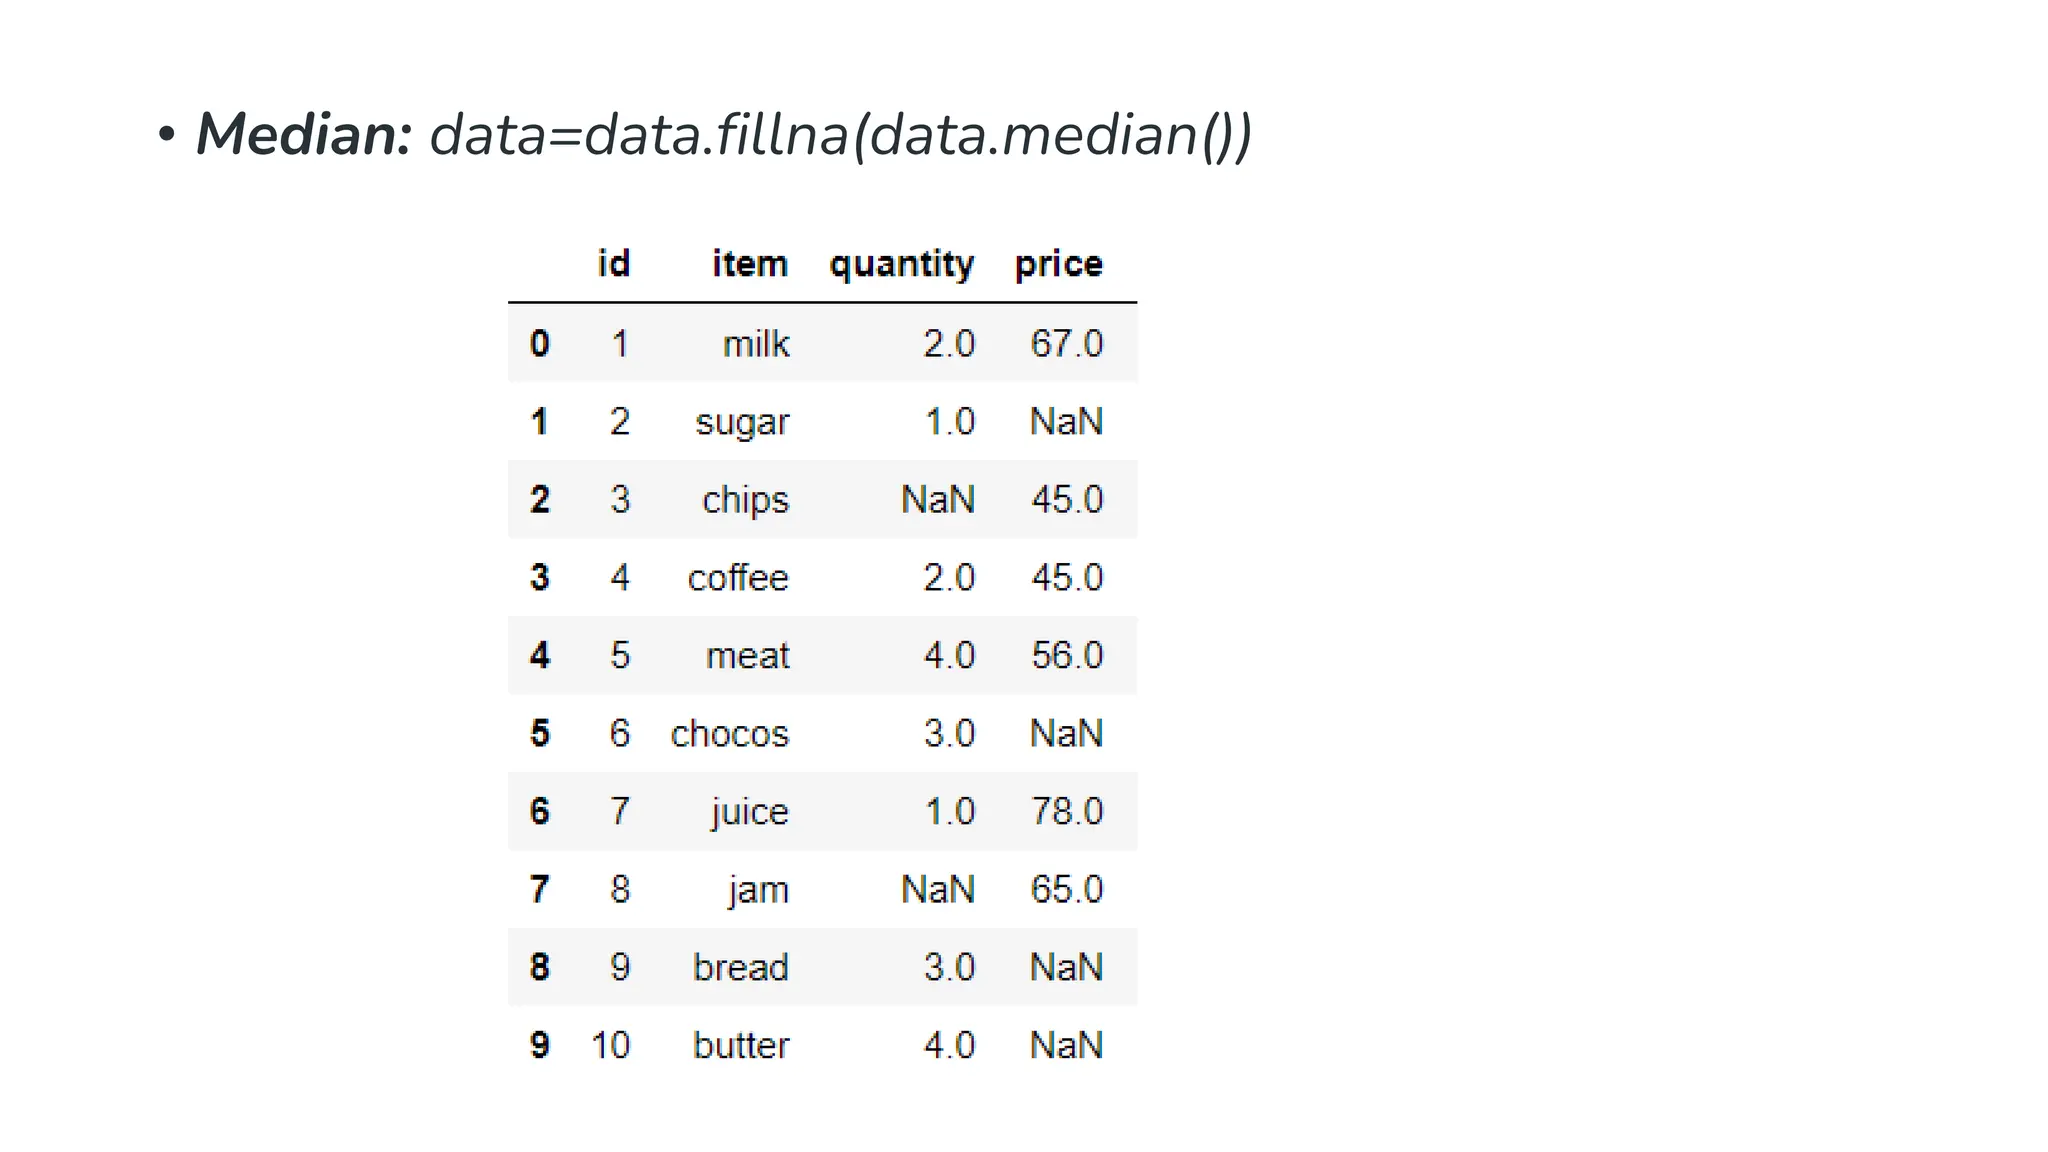
#replacing missing valuesin quantity # column with mean of that column data['quantity'] = data['quantity'].fillna(data['quantity'].mean()) # replacing missing values in price column # with median of that column data['price'] = data['price'].fillna(data['price'].median()) print(Data)
23.
Mode imputation: • Mode- The most common value from scipy import stats speed = [99,86,87,88,111,86,103,87,94,78,77,85,86] x = stats.mode(speed) print(x) #The mode() method returns a ModeResult object that contains the mode number (86), and count (how many times the mode number appeared (3)).
24.
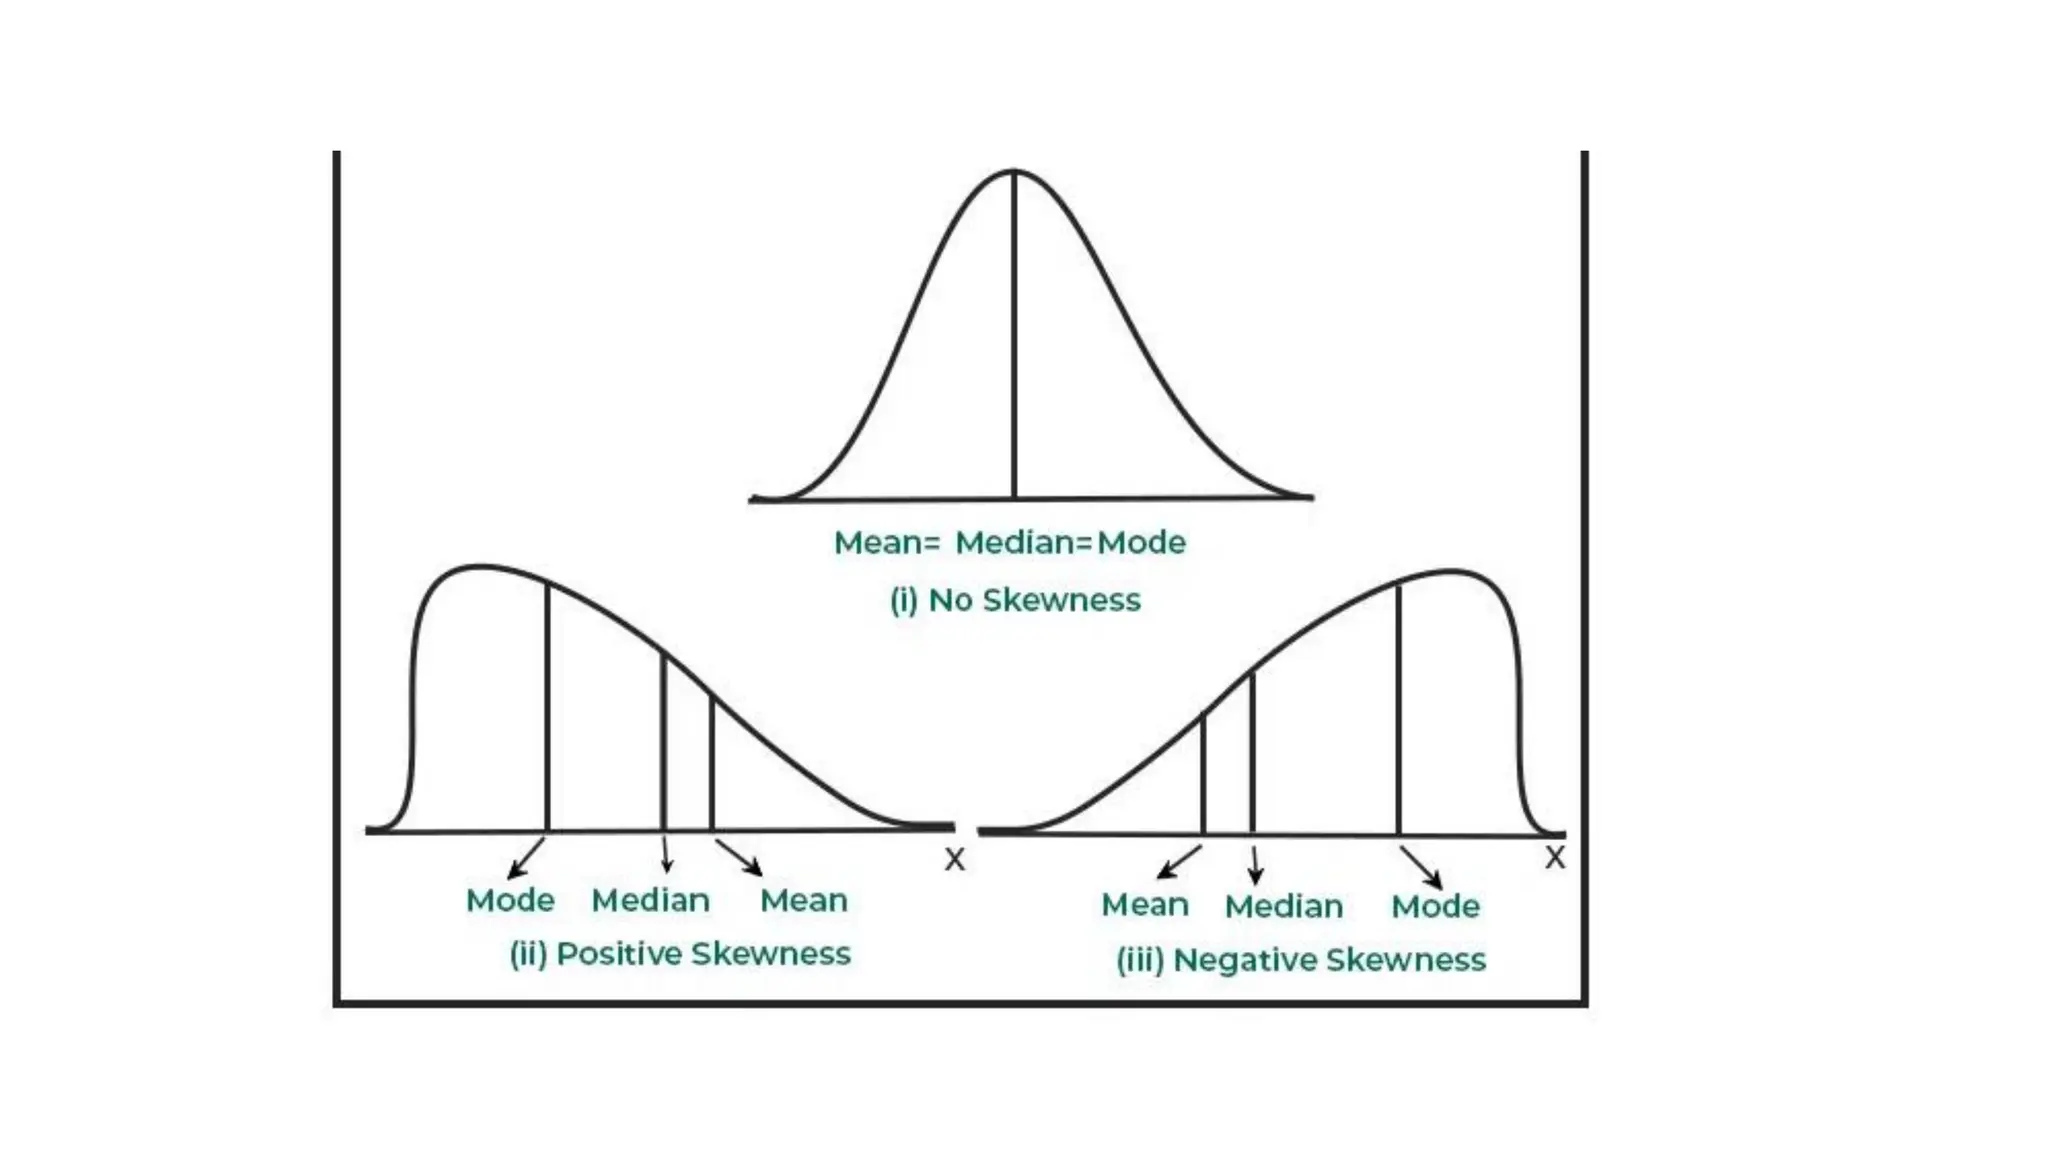
Data Skewed • Dataskewed" means that the distribution of data points in a dataset is uneven, with a noticeable concentration of values on one side of the distribution, creating a "tail" extending towards the other side, making the data appear distorted or asymmetrical when visualized on a graph
25.
• Types ofskew: • Positive skew (right skew): The tail extends towards the higher values on the right side of the graph. • Negative skew (left skew): The tail extends towards the lower values on the left side of the graph.
28.
Data Integration • Dataintegration is a process where data from many sources goes to a single centralized location, which is often a data warehouse. • The end location needs to be flexible enough to handle lots of different kinds of data at potentially large volumes. • Data integration is deal for powering analytical use cases.
29.
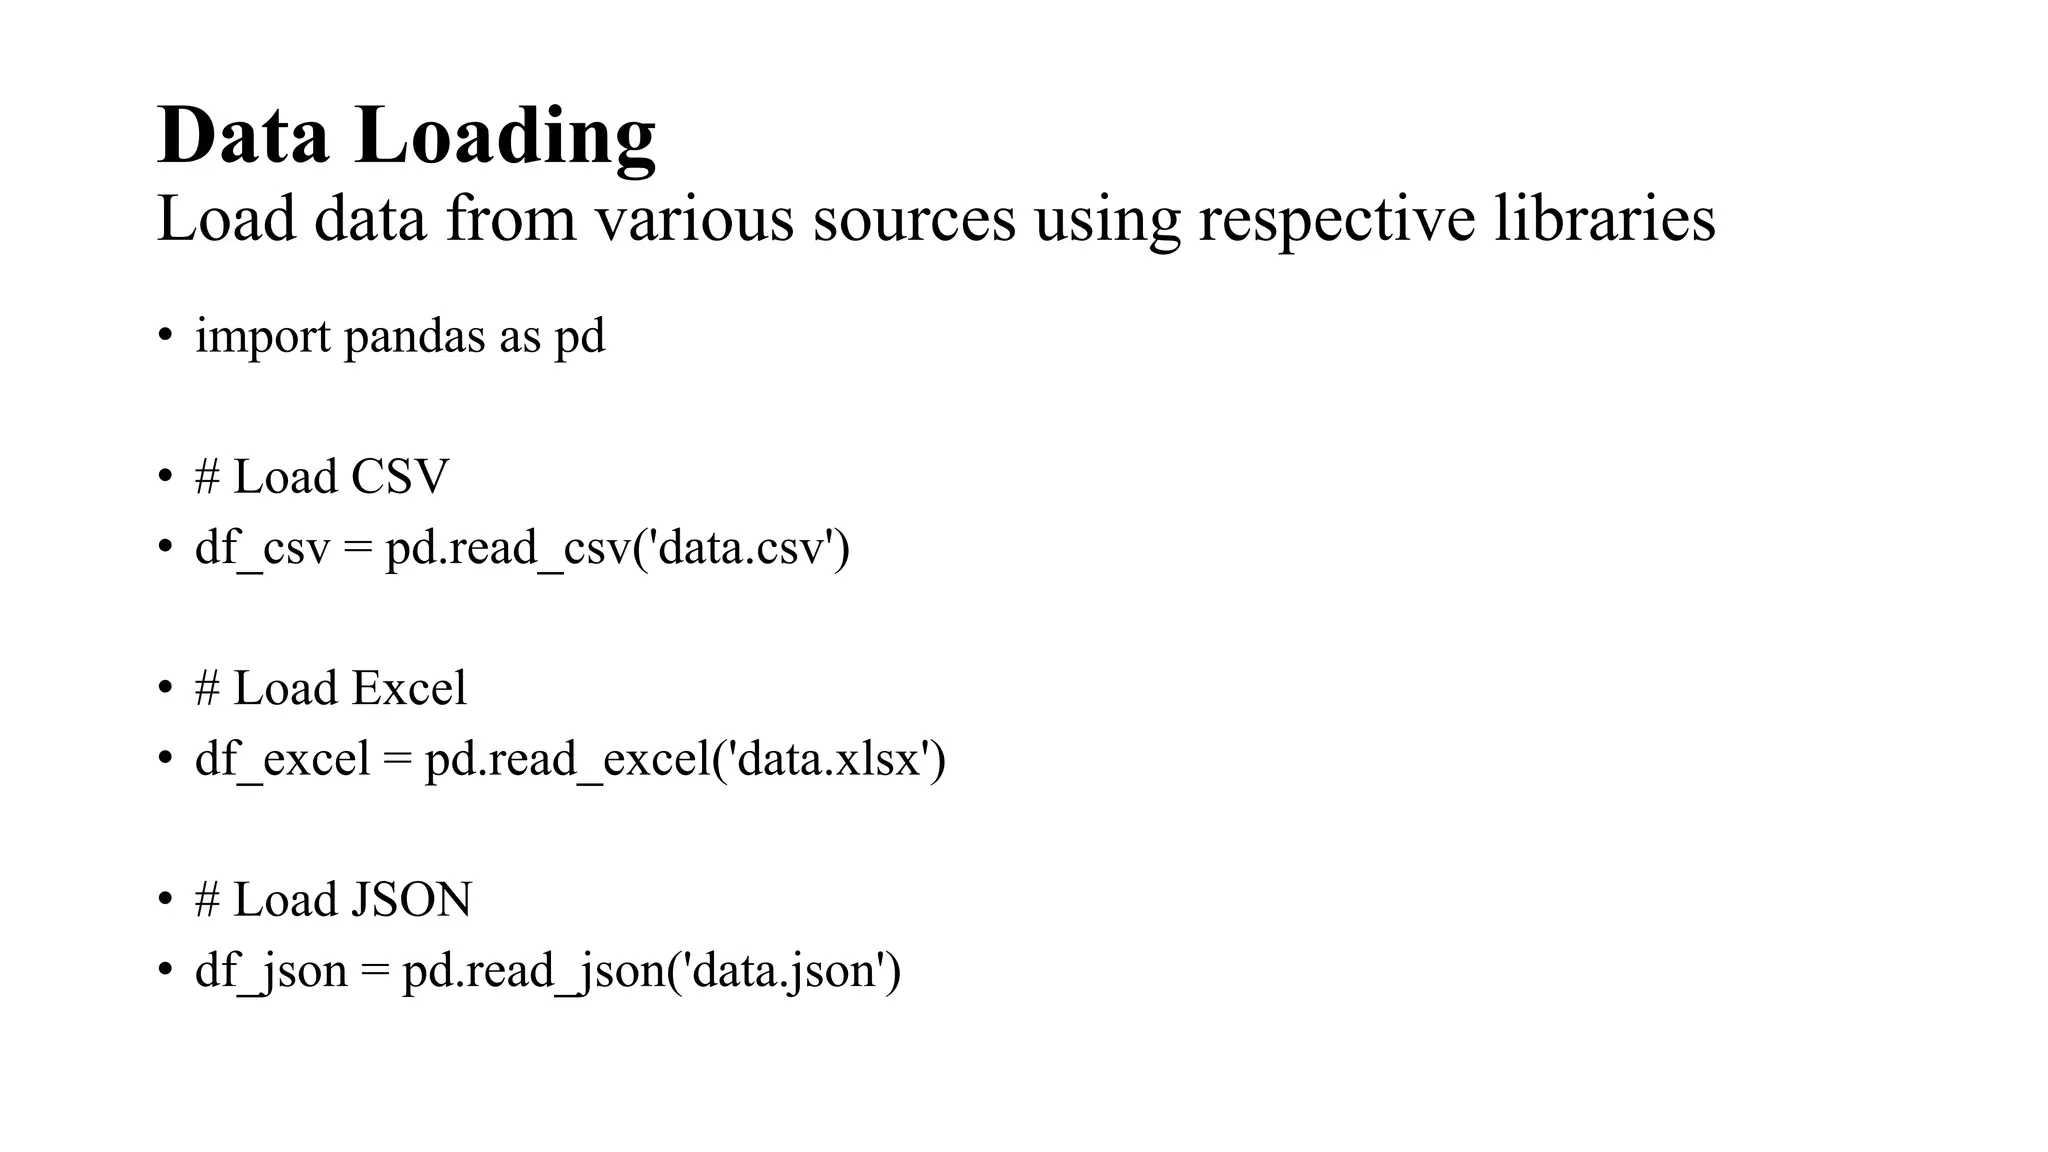
Data Loading Load datafrom various sources using respective libraries • import pandas as pd • # Load CSV • df_csv = pd.read_csv('data.csv') • # Load Excel • df_excel = pd.read_excel('data.xlsx') • # Load JSON • df_json = pd.read_json('data.json')
30.
Data Cleaning andTransformation Use Pandas or other libraries to clean and normalize the data # Drop null values • df = df.dropna() # Rename columns • df = df.rename(columns={'OldName': 'NewName'}) # Standardize formats • df['date'] = pd.to_datetime(df['date'])
31.
Combining Data • Concatenation:Stack datasets vertically. combined_df = pd.concat([df1, df2]) • Merging: Combine datasets based on a key. merged_df = pd.merge(df1, df2, on='common_key’)
Label Encoding • LabelEncoding is a technique that is used to convert categorical columns into numerical ones so that they can be fitted by machine learning models which only take numerical data. • It is an important pre-processing step in a machine-learning project.
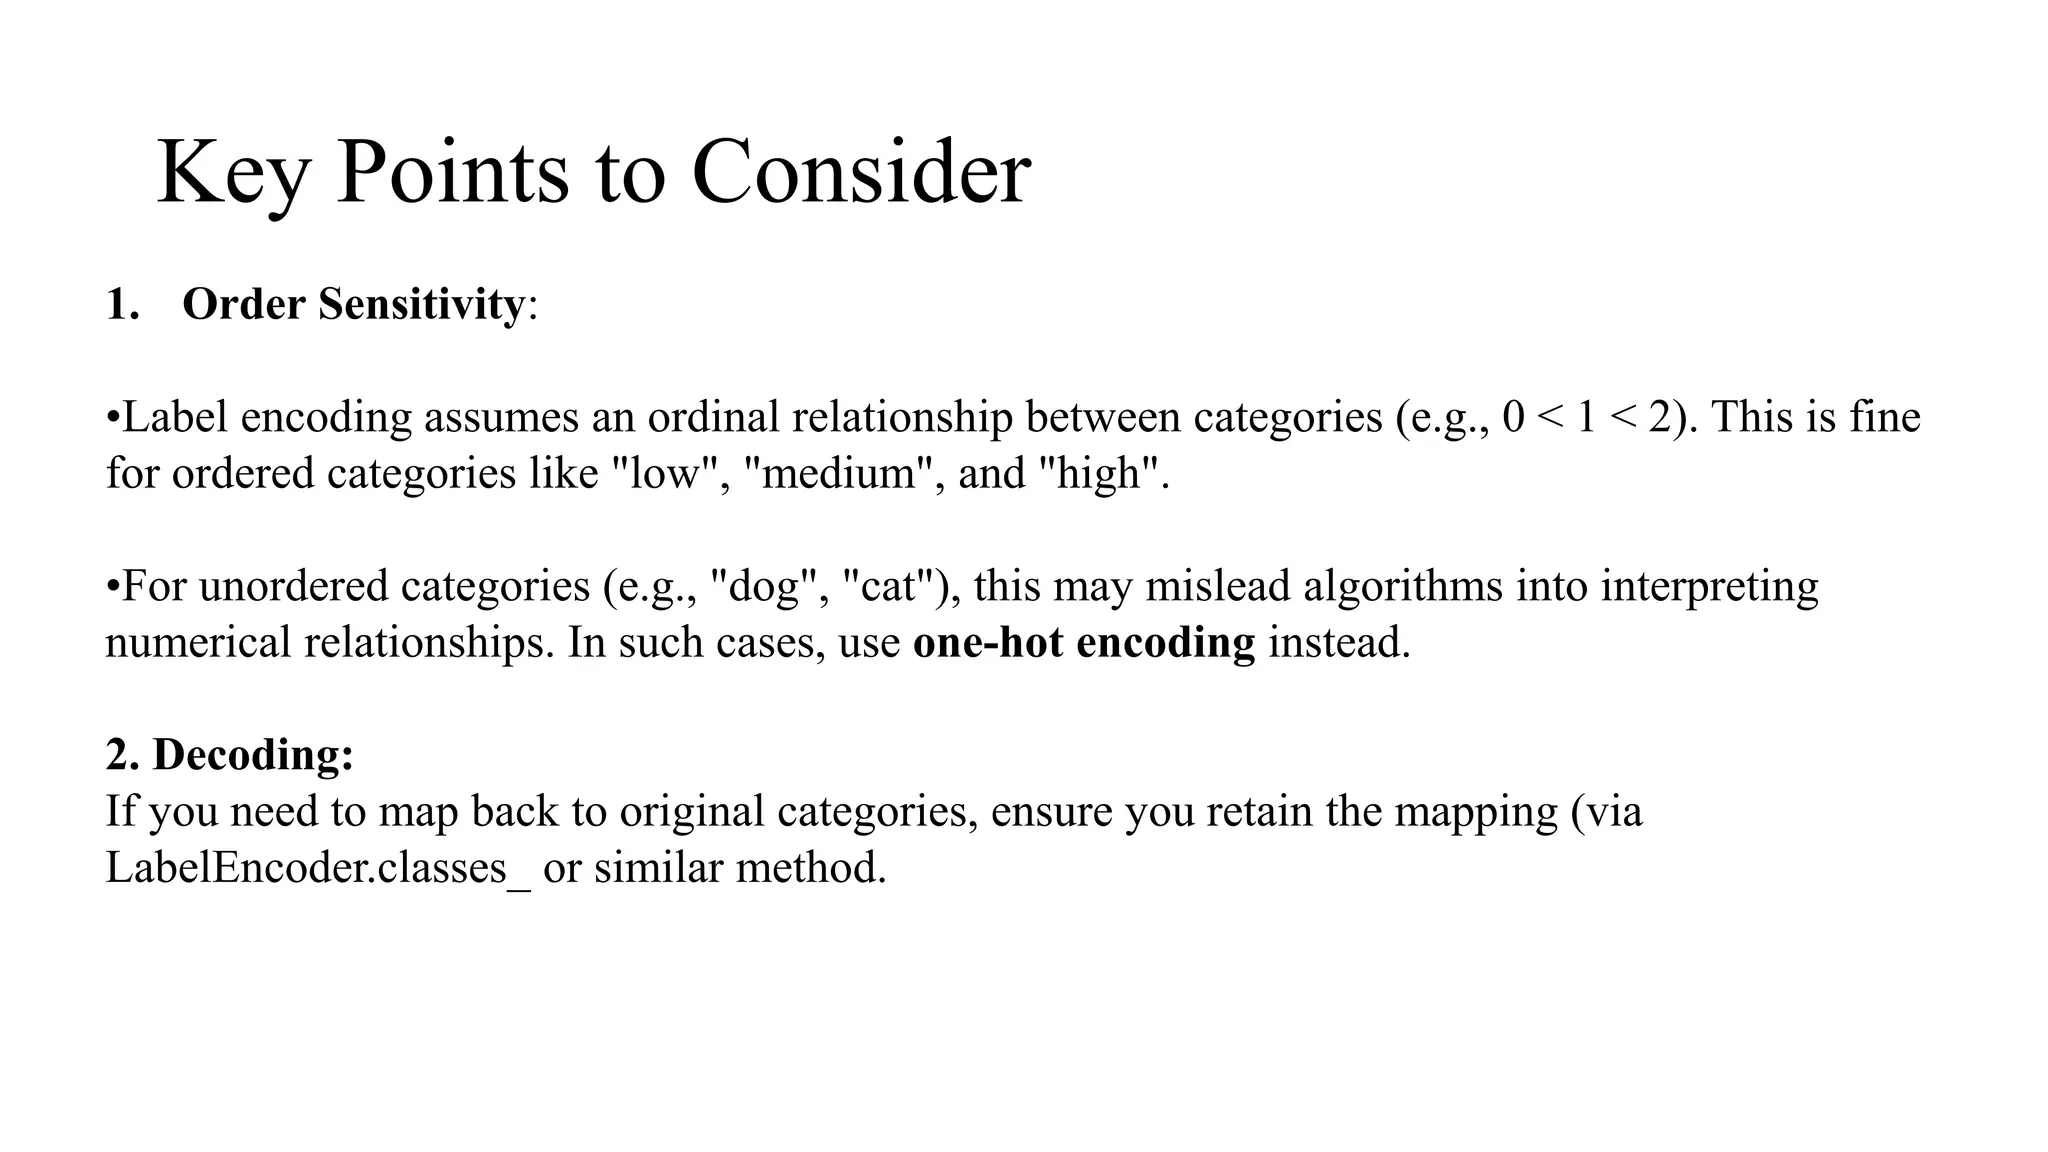
Key Points toConsider 1. Order Sensitivity: •Label encoding assumes an ordinal relationship between categories (e.g., 0 < 1 < 2). This is fine for ordered categories like "low", "medium", and "high". •For unordered categories (e.g., "dog", "cat"), this may mislead algorithms into interpreting numerical relationships. In such cases, use one-hot encoding instead. 2. Decoding: If you need to map back to original categories, ensure you retain the mapping (via LabelEncoder.classes_ or similar method.
38.
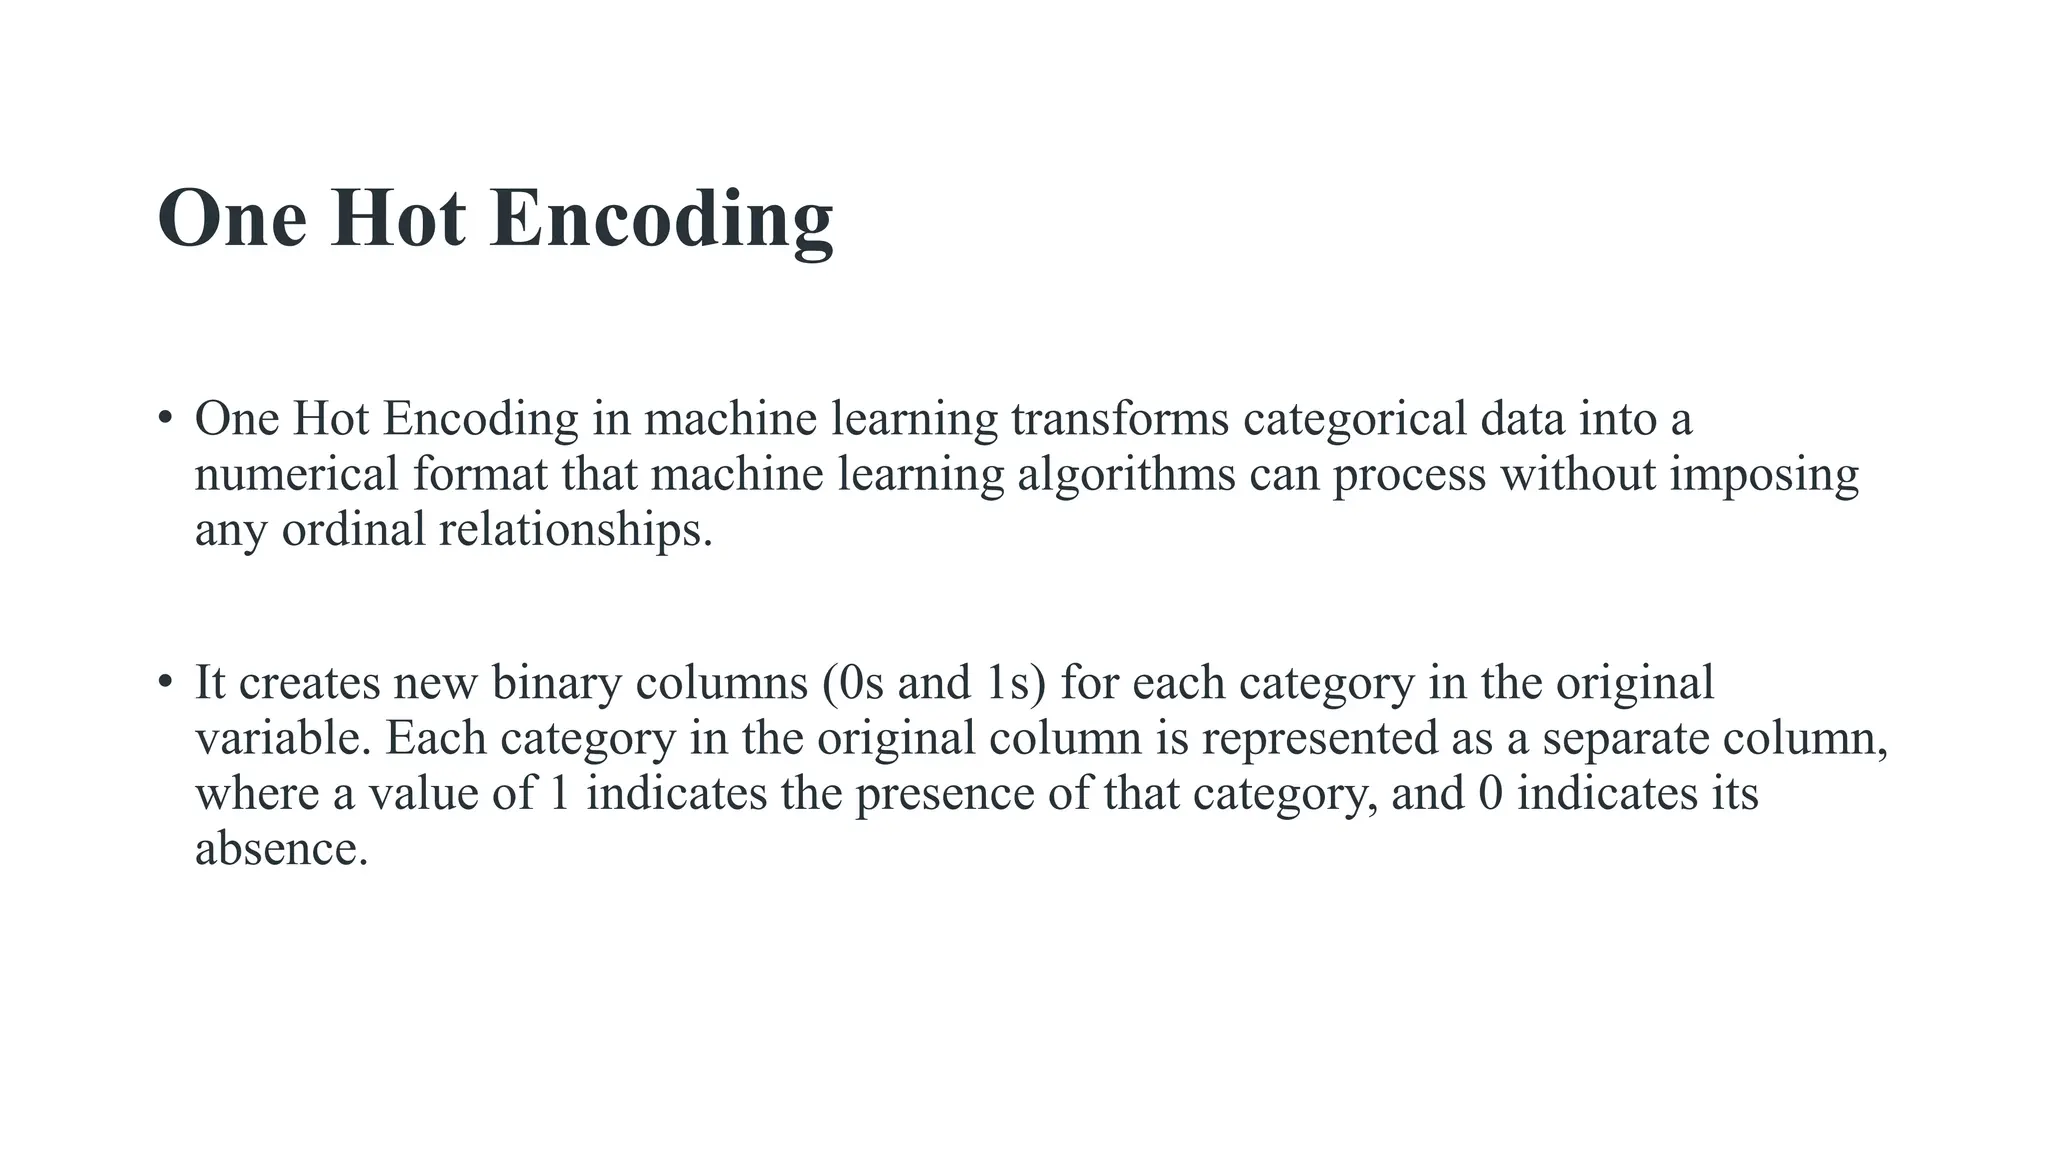
One Hot Encoding •One Hot Encoding in machine learning transforms categorical data into a numerical format that machine learning algorithms can process without imposing any ordinal relationships. • It creates new binary columns (0s and 1s) for each category in the original variable. Each category in the original column is represented as a separate column, where a value of 1 indicates the presence of that category, and 0 indicates its absence.
39.
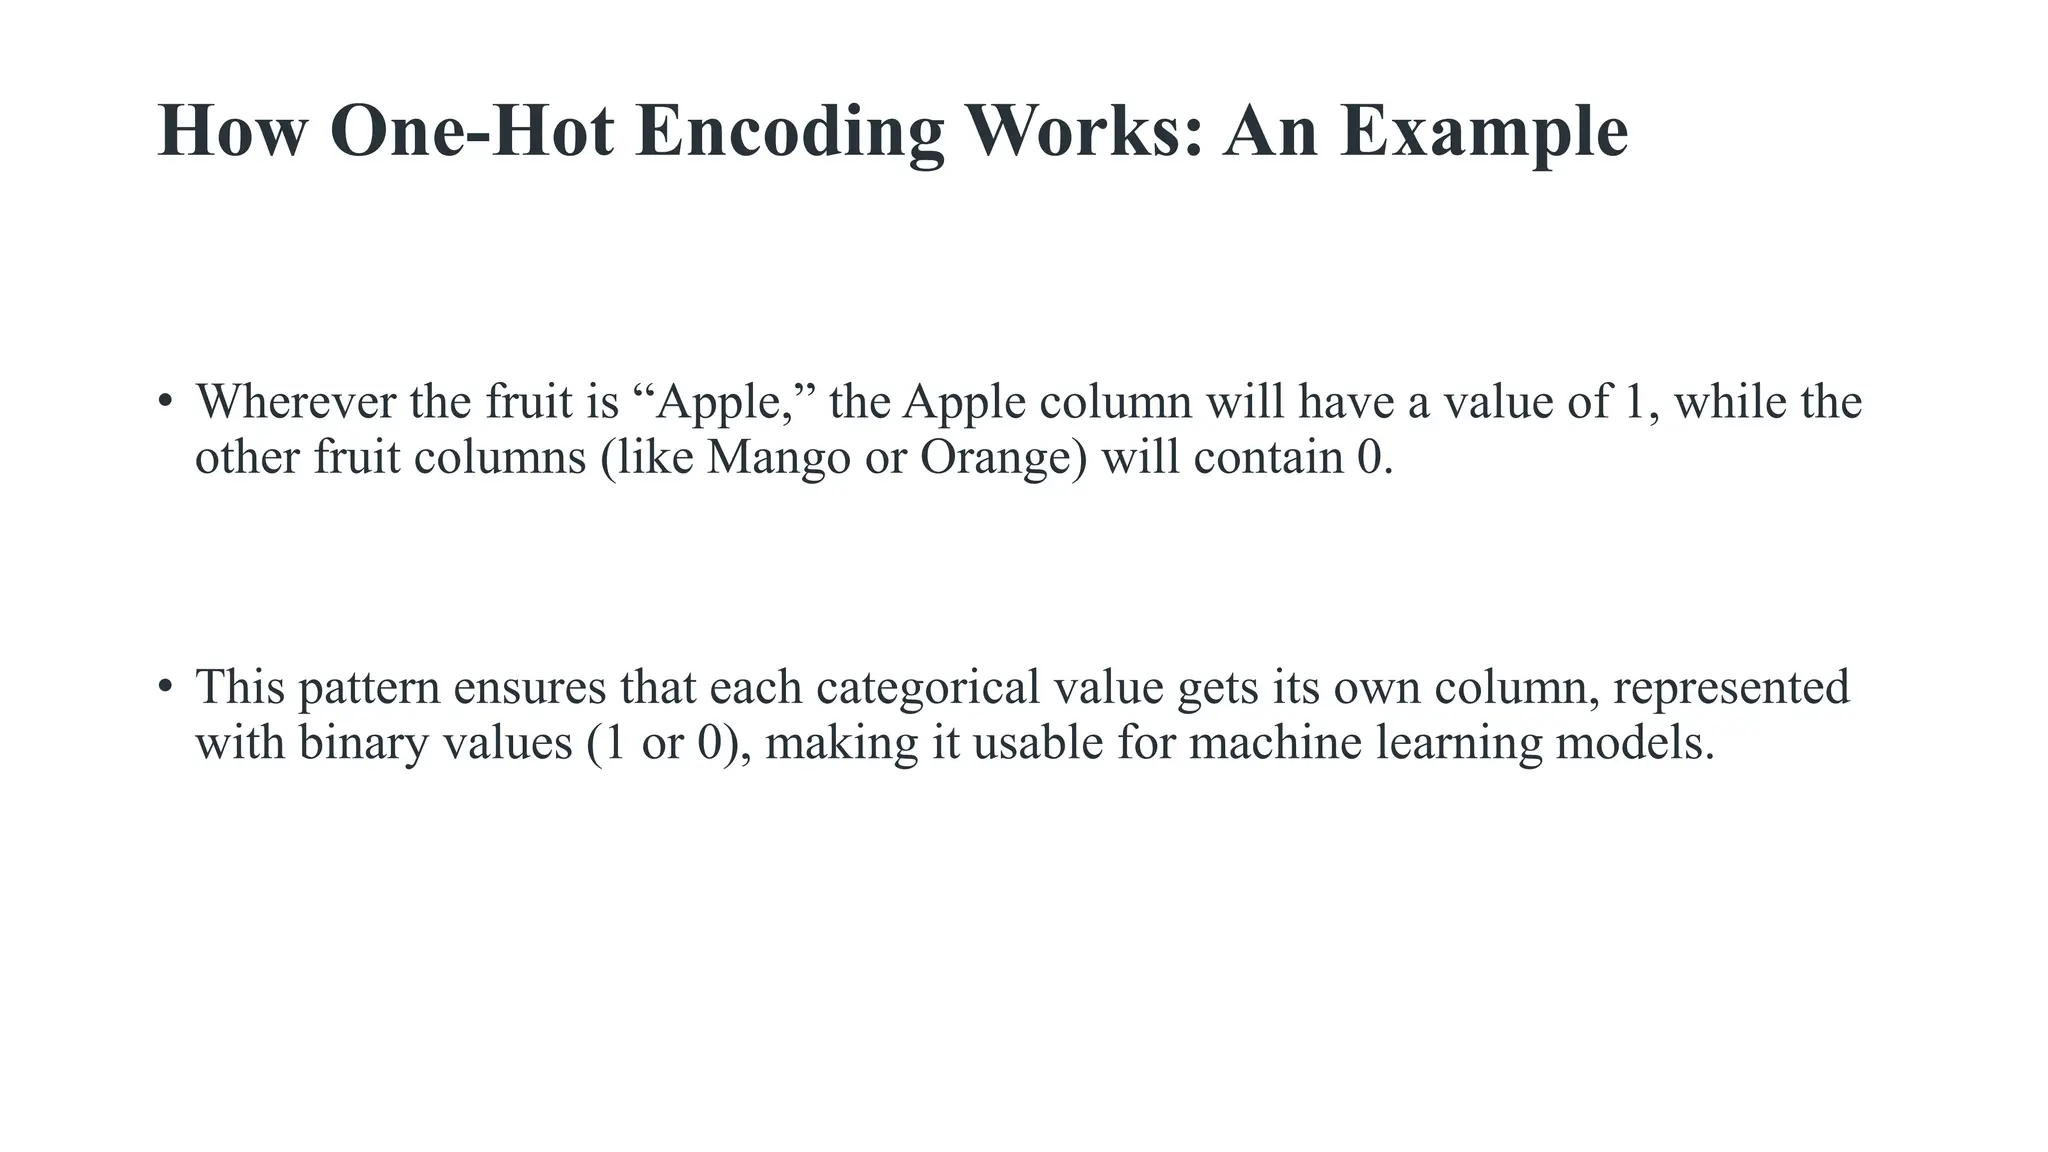
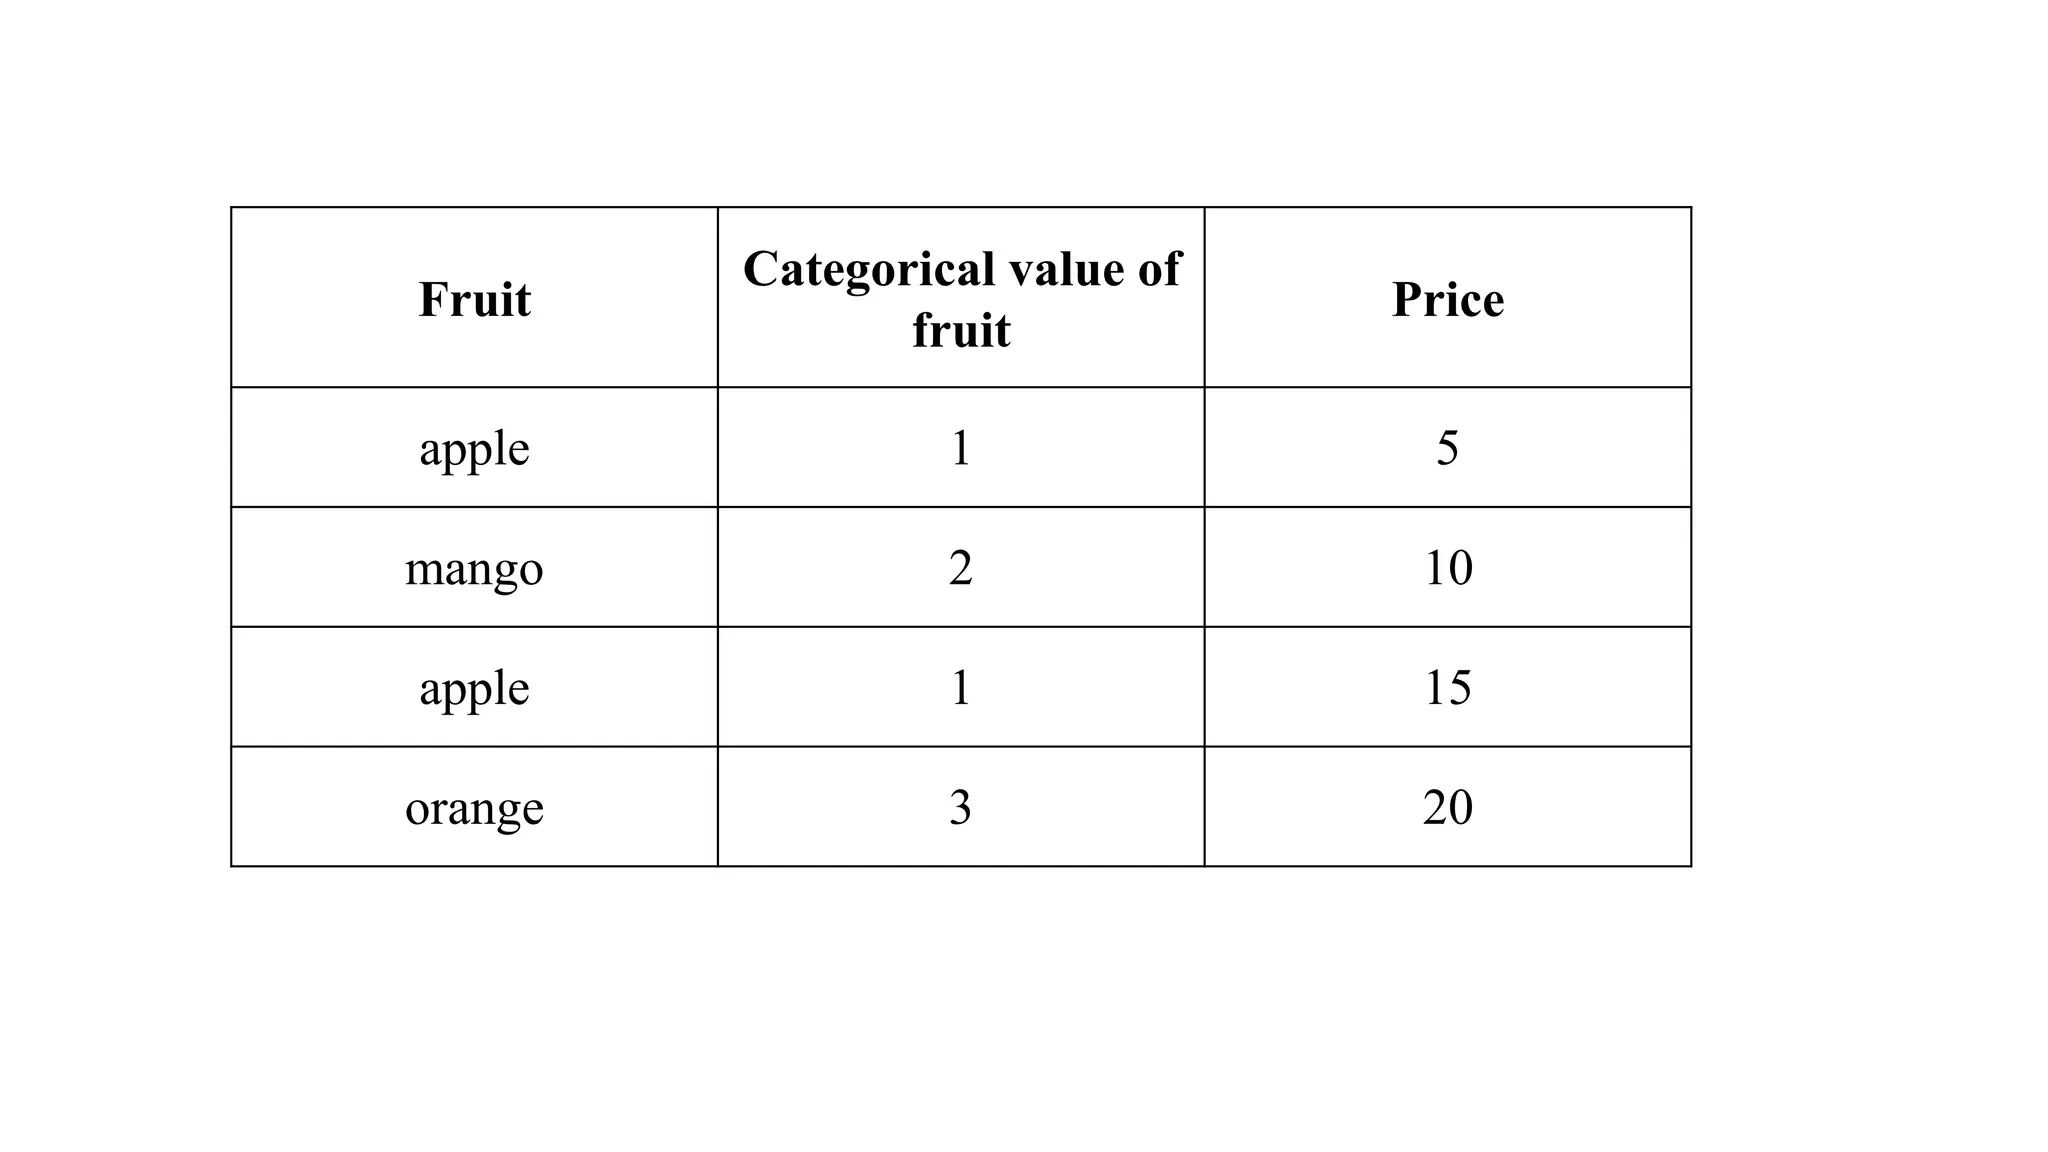
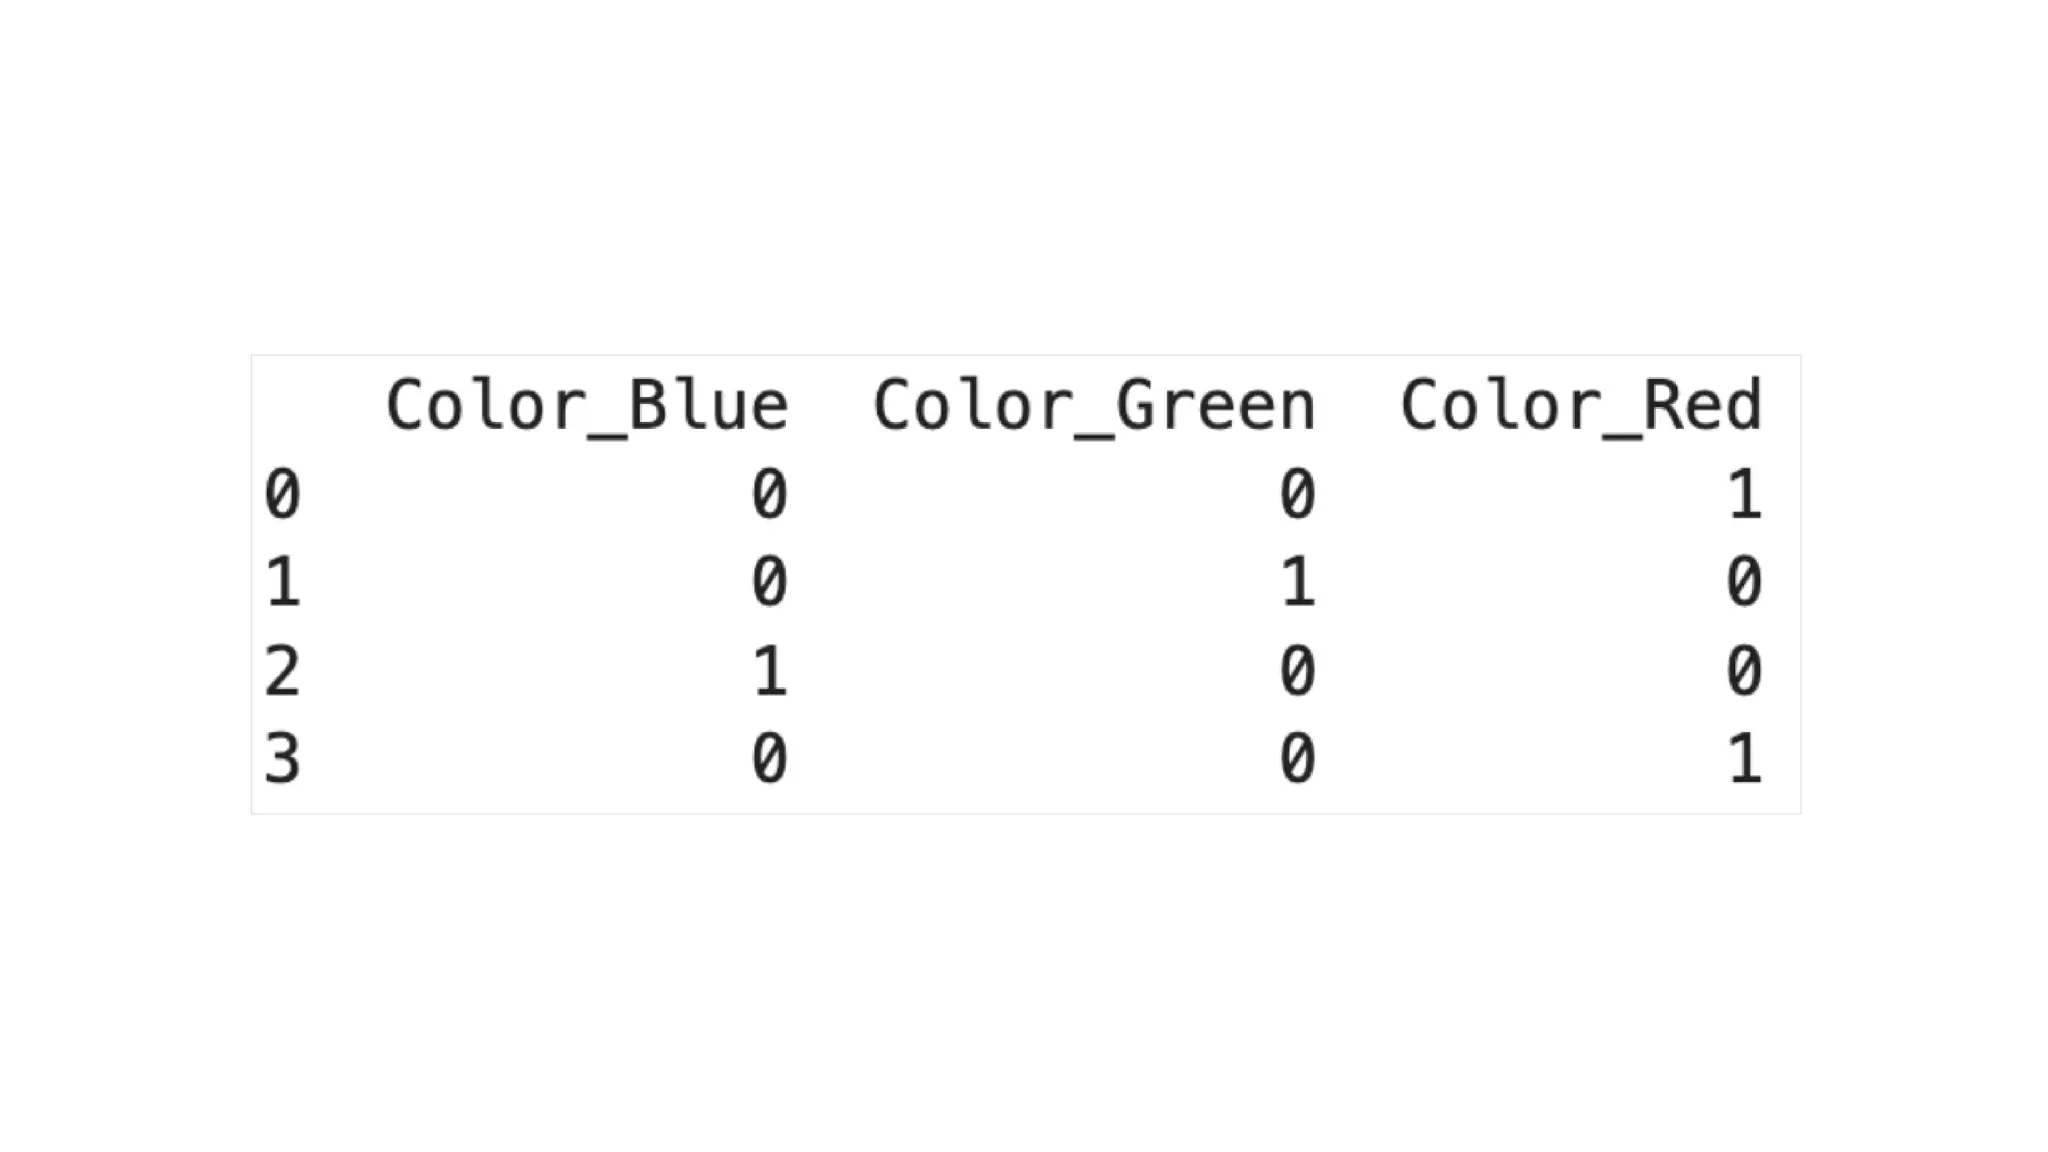
How One-Hot EncodingWorks: An Example • Wherever the fruit is “Apple,” the Apple column will have a value of 1, while the other fruit columns (like Mango or Orange) will contain 0. • This pattern ensures that each categorical value gets its own column, represented with binary values (1 or 0), making it usable for machine learning models.
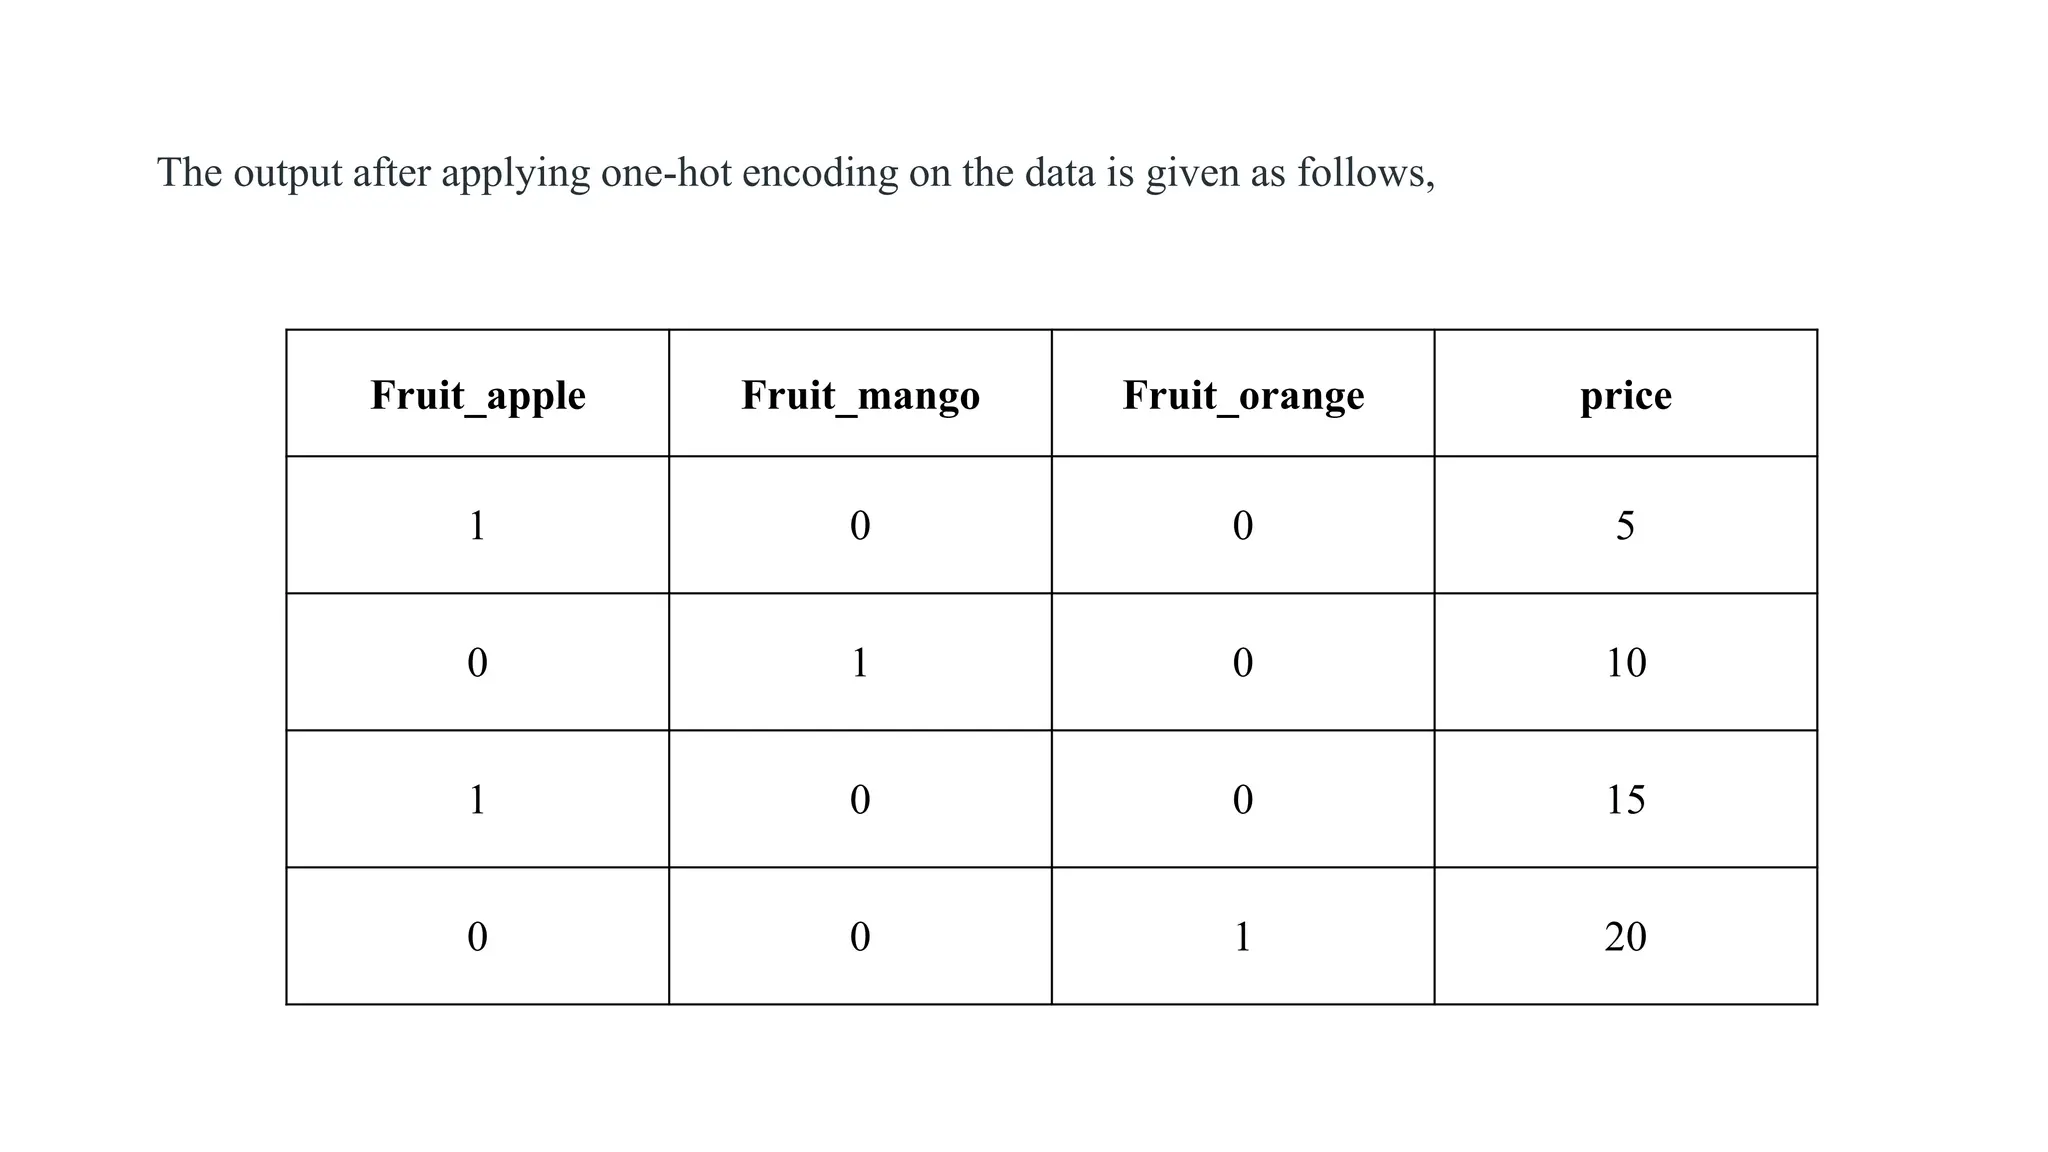
The output afterapplying one-hot encoding on the data is given as follows, Fruit_apple Fruit_mango Fruit_orange price 1 0 0 5 0 1 0 10 1 0 0 15 0 0 1 20
42.
import pandas aspd # Sample data data = {'Color': ['Red', 'Green', 'Blue', 'Red']} df = pd.DataFrame(data) # Applying one-hot encoding df_encoded = pd.get_dummies(df, dtype=int) # Displaying the encoded DataFrame print(df_encoded) Using Pandas get_dummies()
44.
from sklearn.preprocessing importOneHotEncoder import numpy as np # Creating the encoder enc = OneHotEncoder(handle_unknown='ignore') # Sample data X = [['Red'], ['Green'], ['Blue']] # Fitting the encoder to the data enc.fit(X) # Transforming new data result = enc.transform([['Red']]).toarray() # Displaying the encoded result print(result) Using Scikit-learn's OneHotEncoder
45.
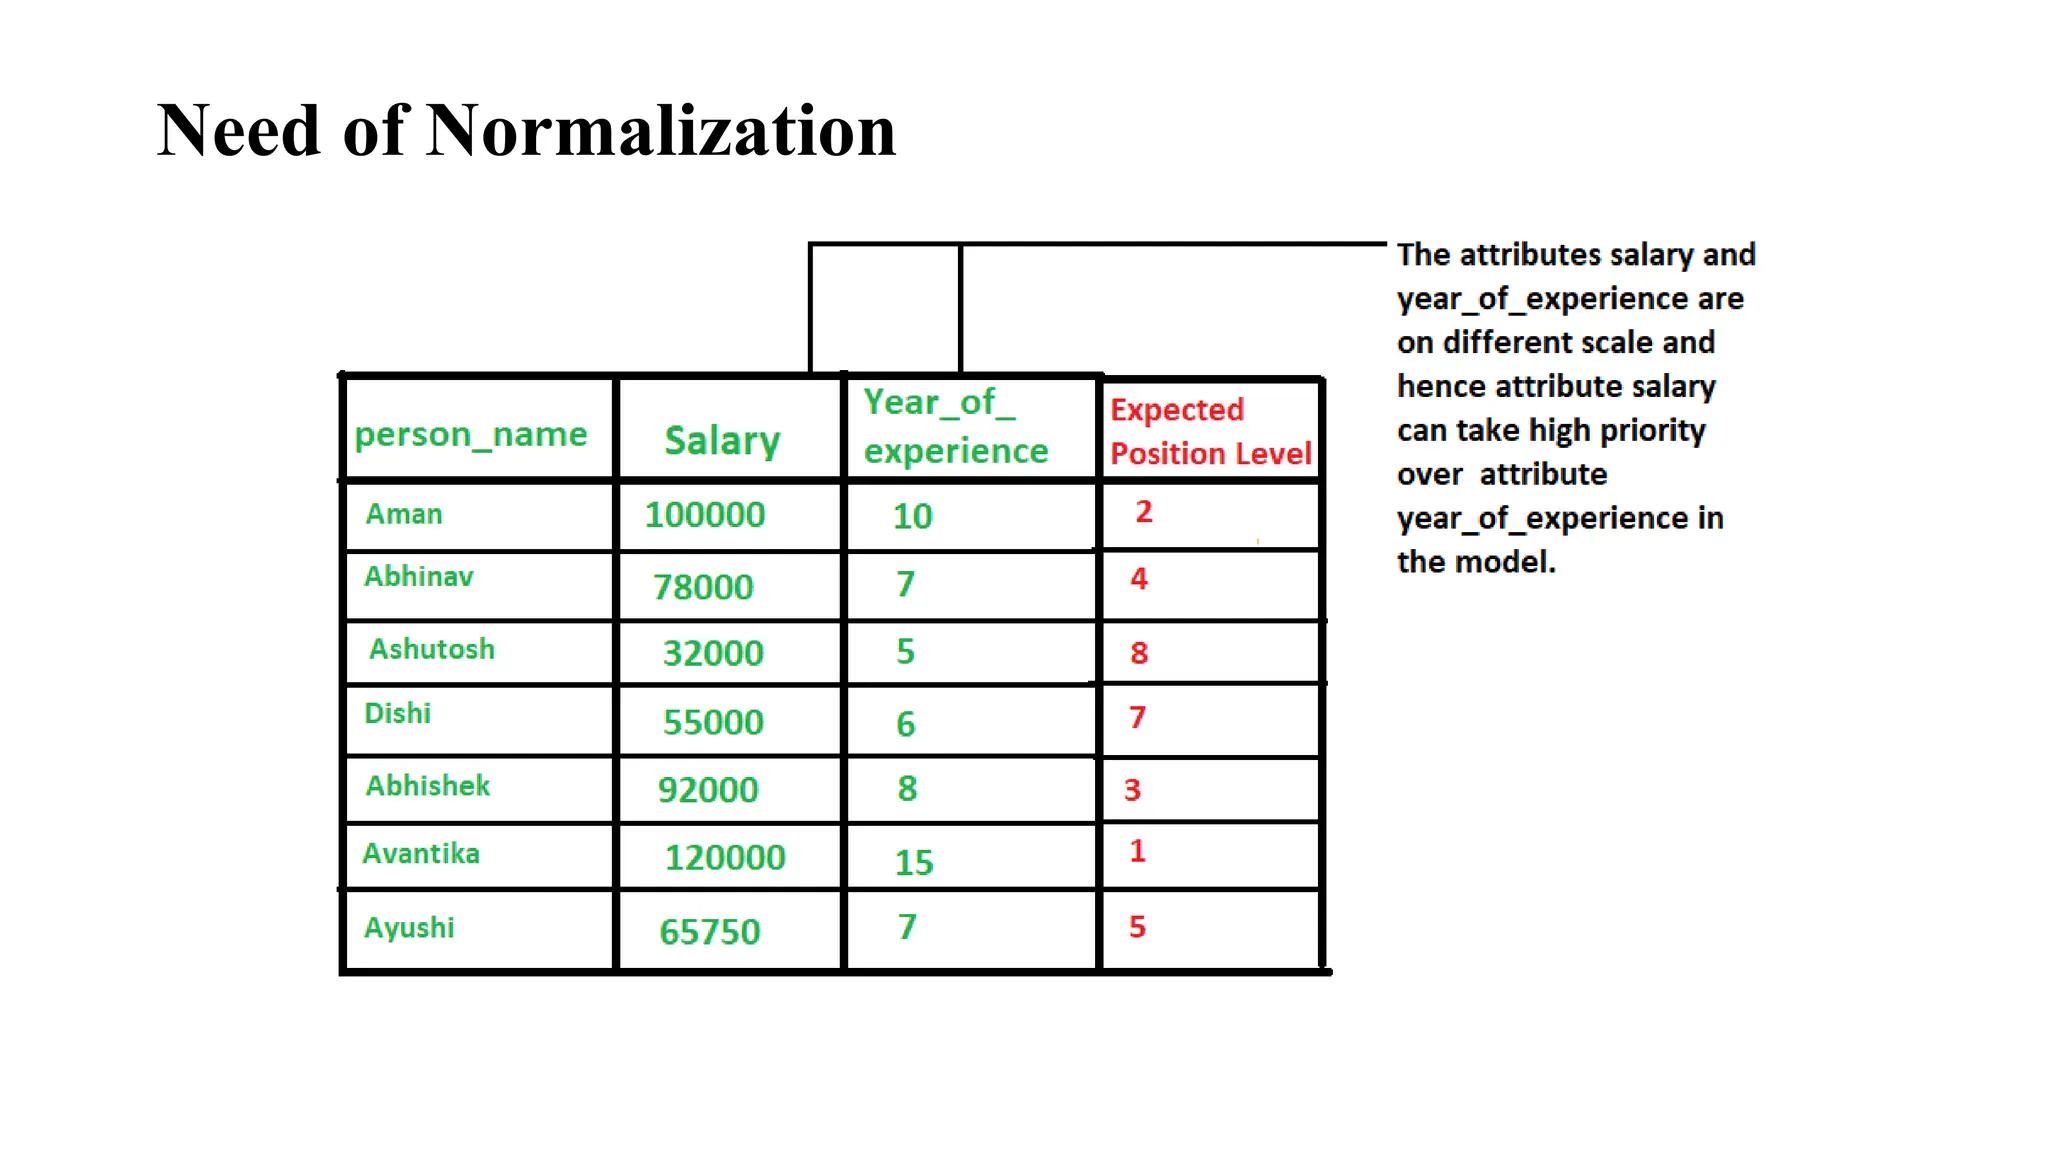
Data Normalization • Datanormalization is a technique used to transform the values of a dataset into a common scale. • This is important because many machine learning algorithms are sensitive to the scale of the input features and can produce better results when the data is normalized.
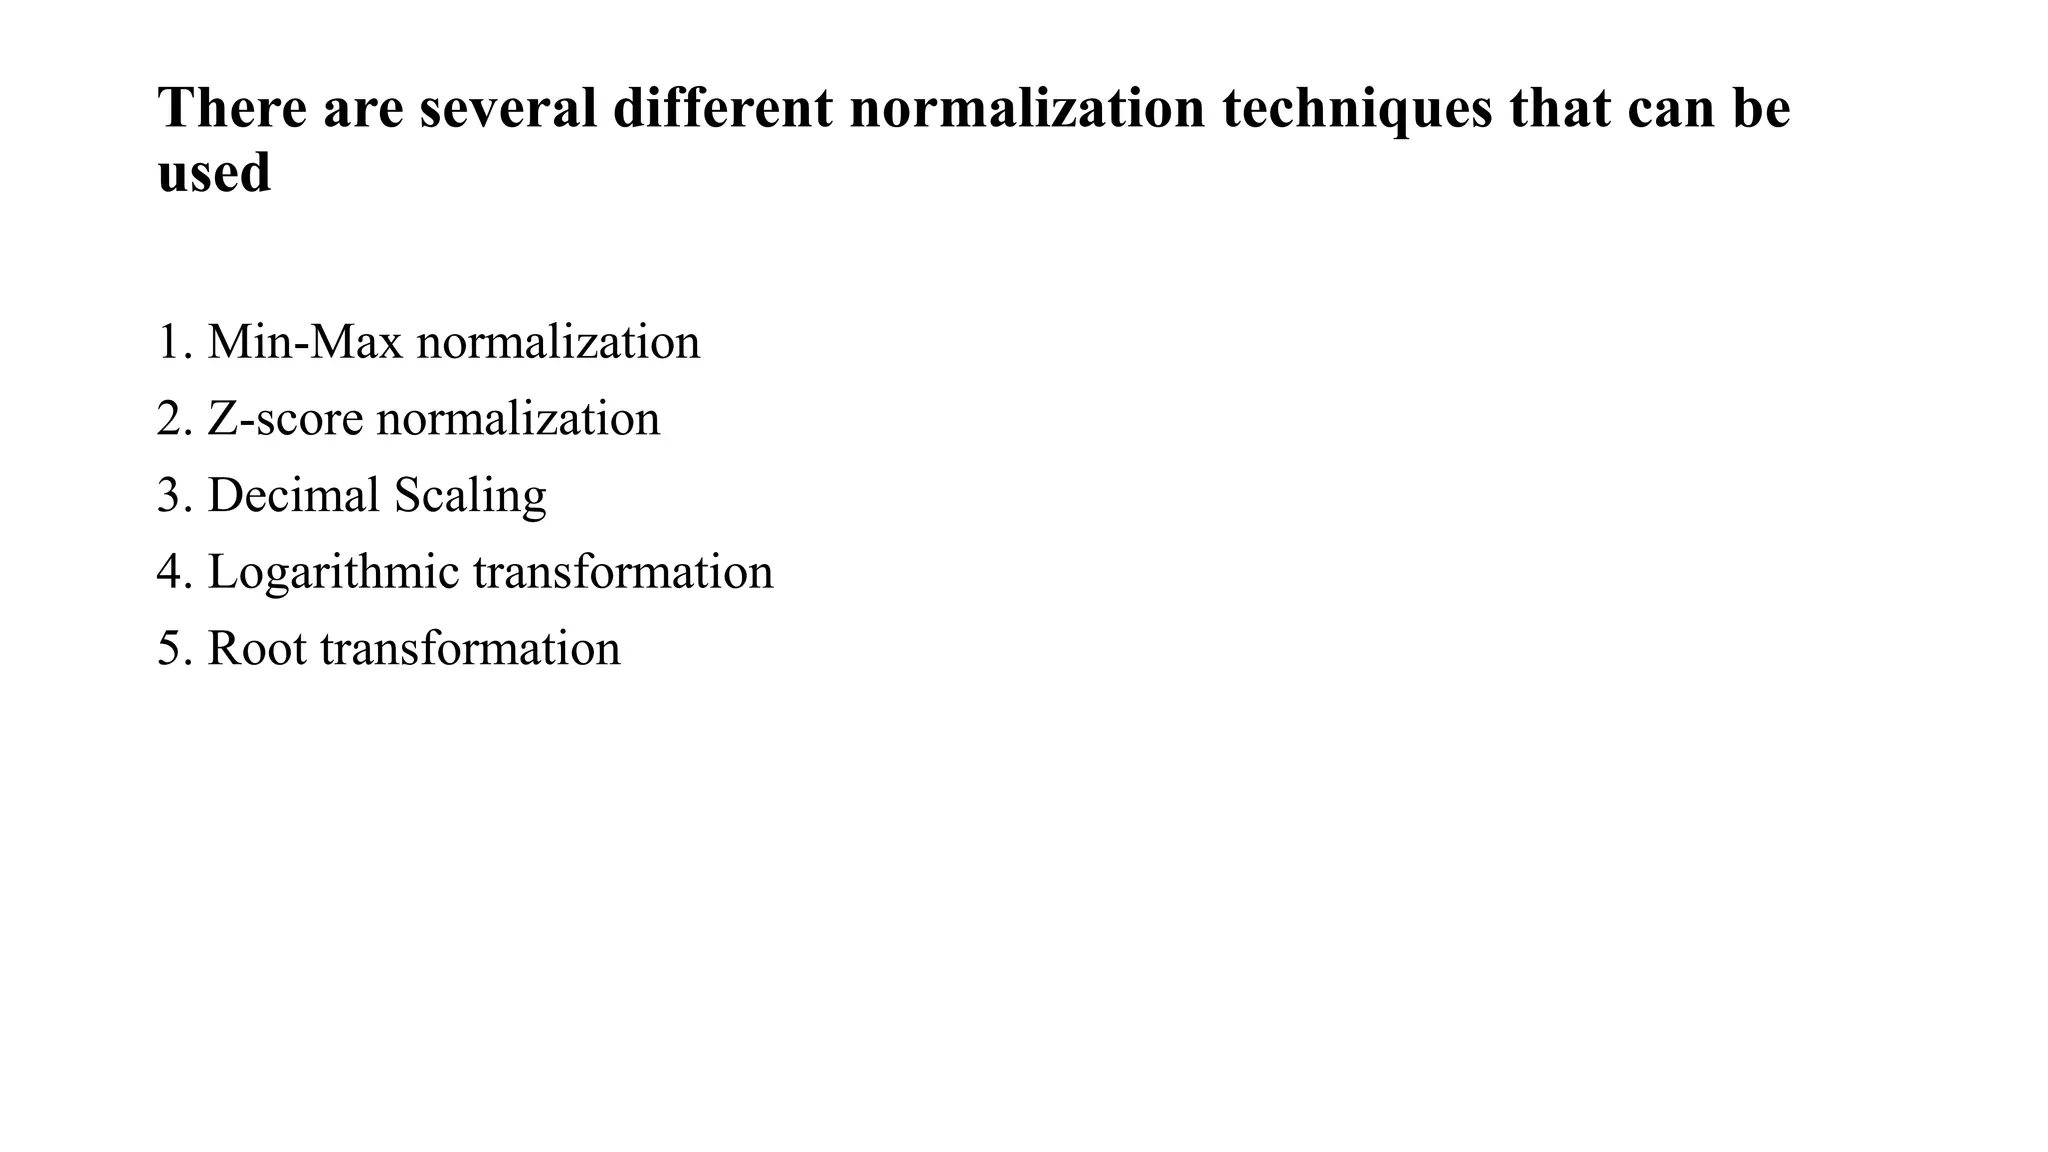
There are severaldifferent normalization techniques that can be used 1. Min-Max normalization 2. Z-score normalization 3. Decimal Scaling 4. Logarithmic transformation 5. Root transformation
48.
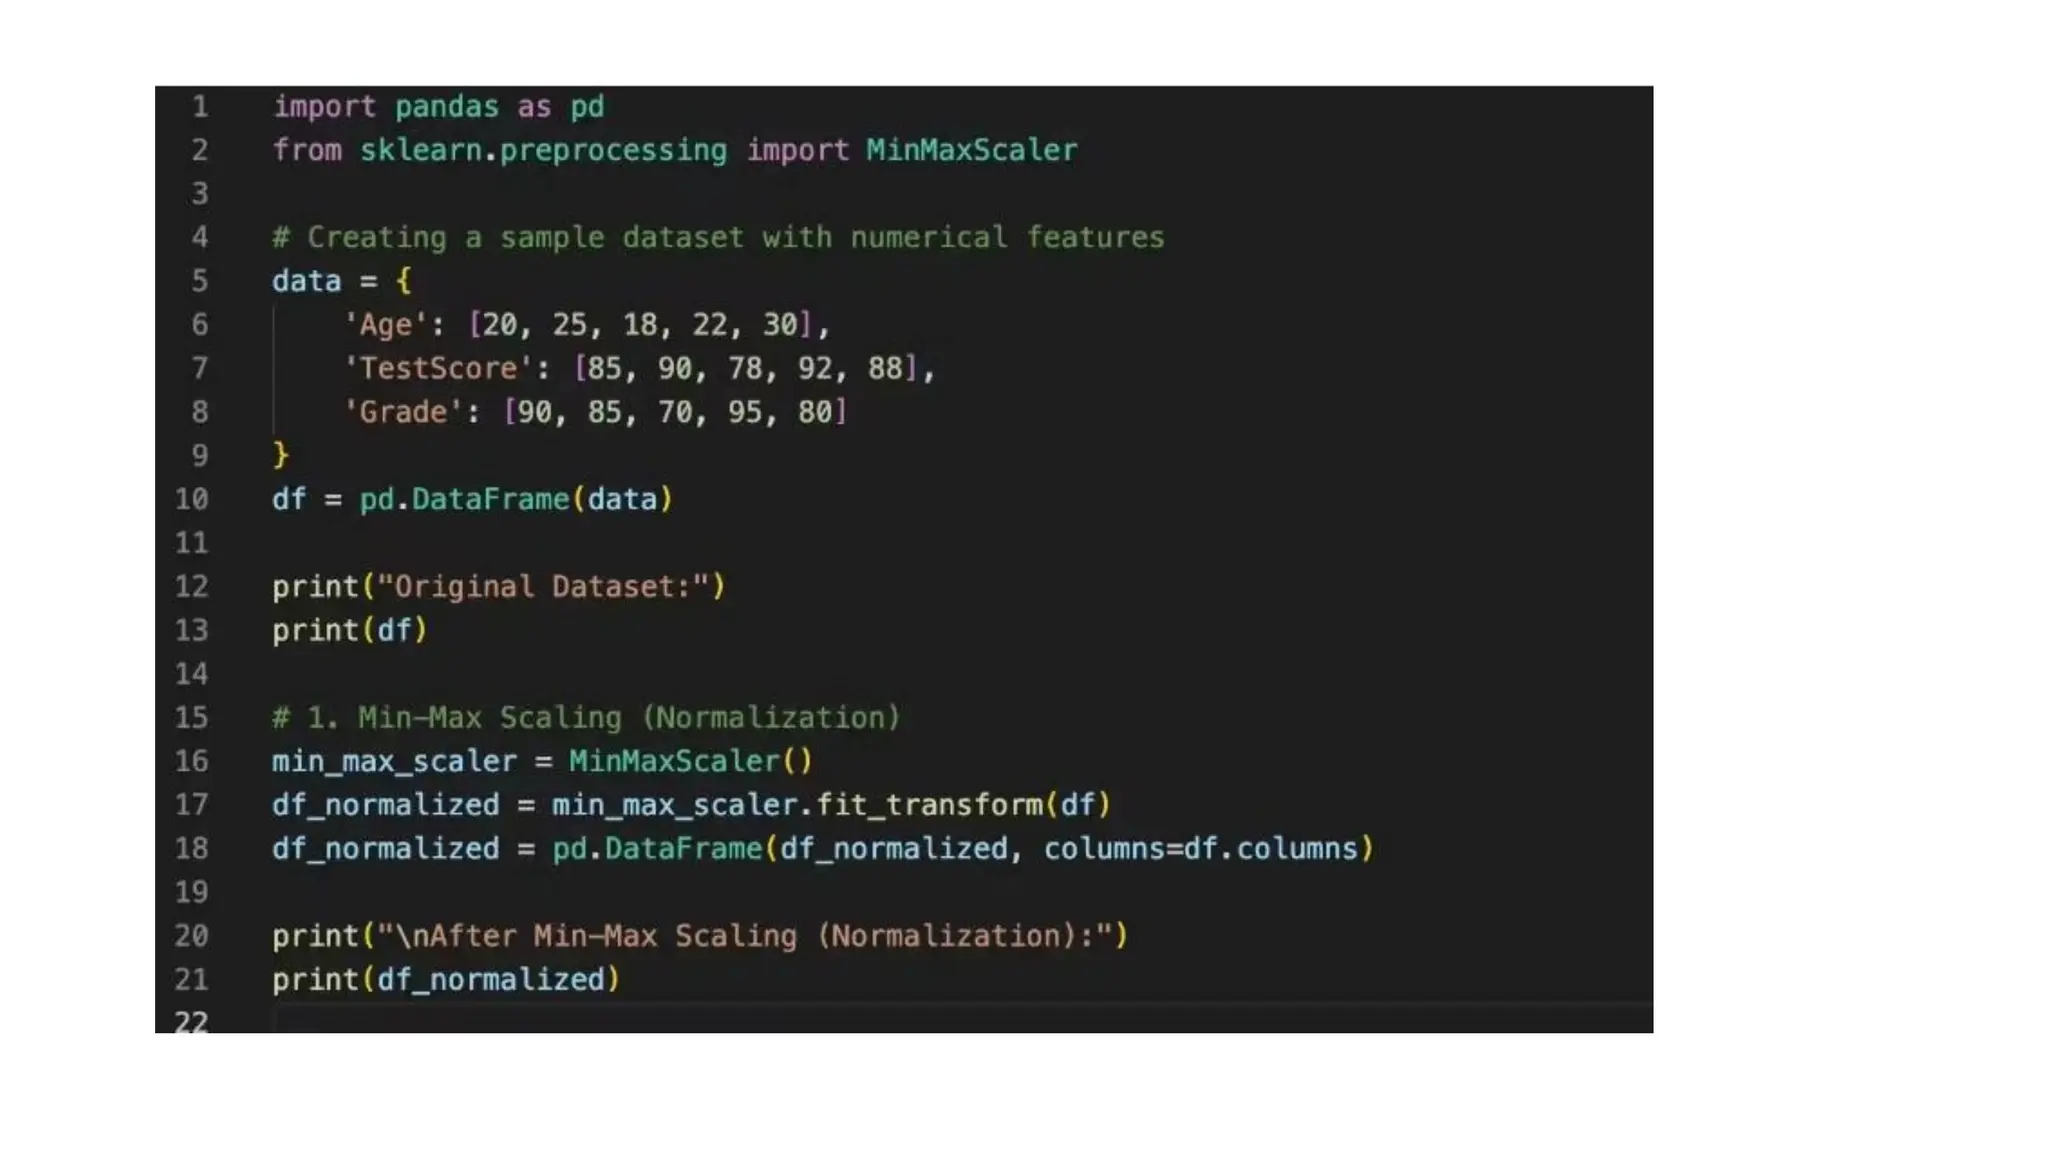
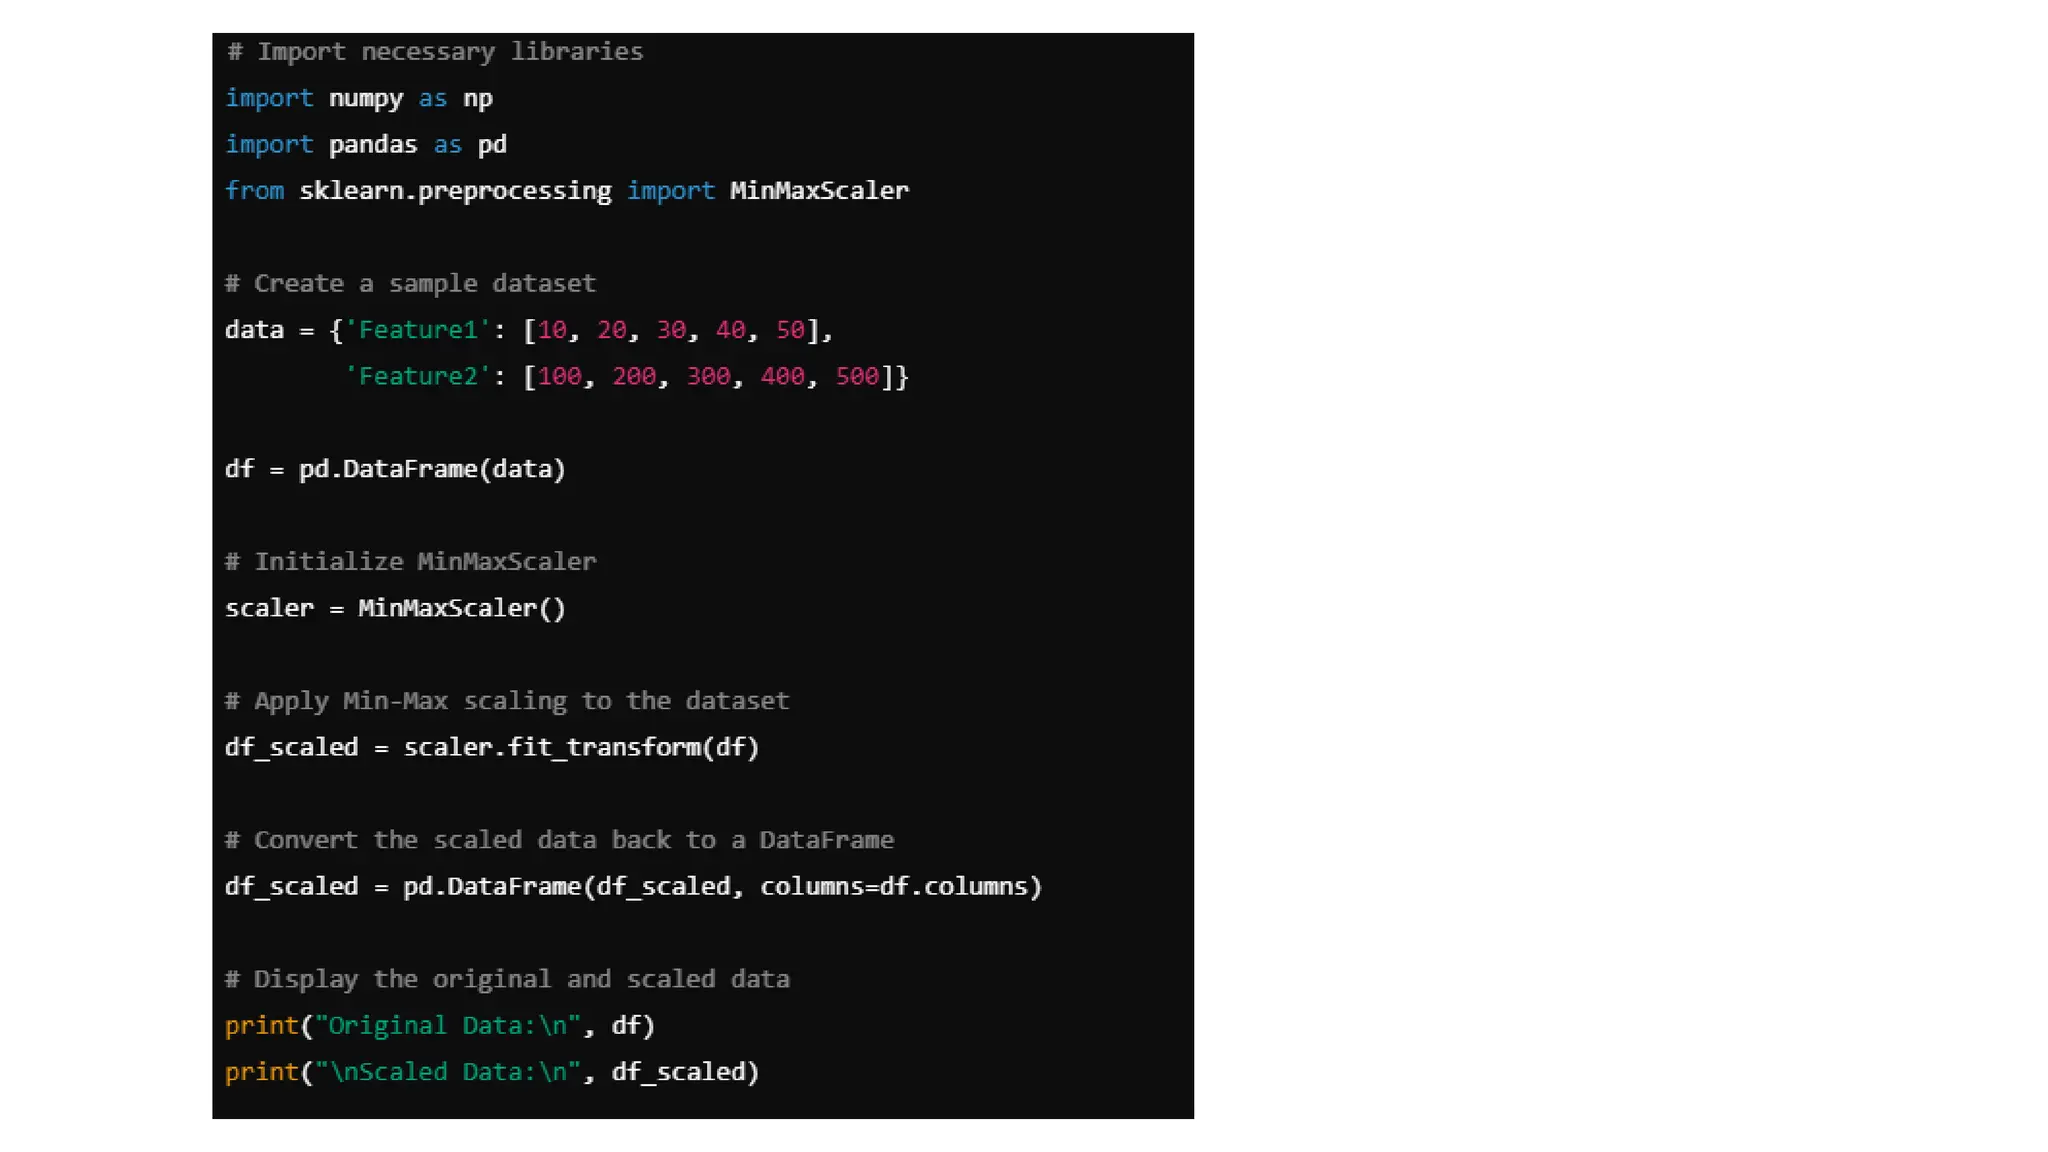
Min-Max scaling • Min-Maxscaling is a technique in data preprocessing where all values within a feature are linearly transformed to fall within a specified range, usually between 0 and 1, by calculating the proportion of each value relative to the minimum and maximum values in that feature • Essentially, it scales the data based on its relative position within the original range, making it suitable for algorithms sensitive to feature scale differences
49.
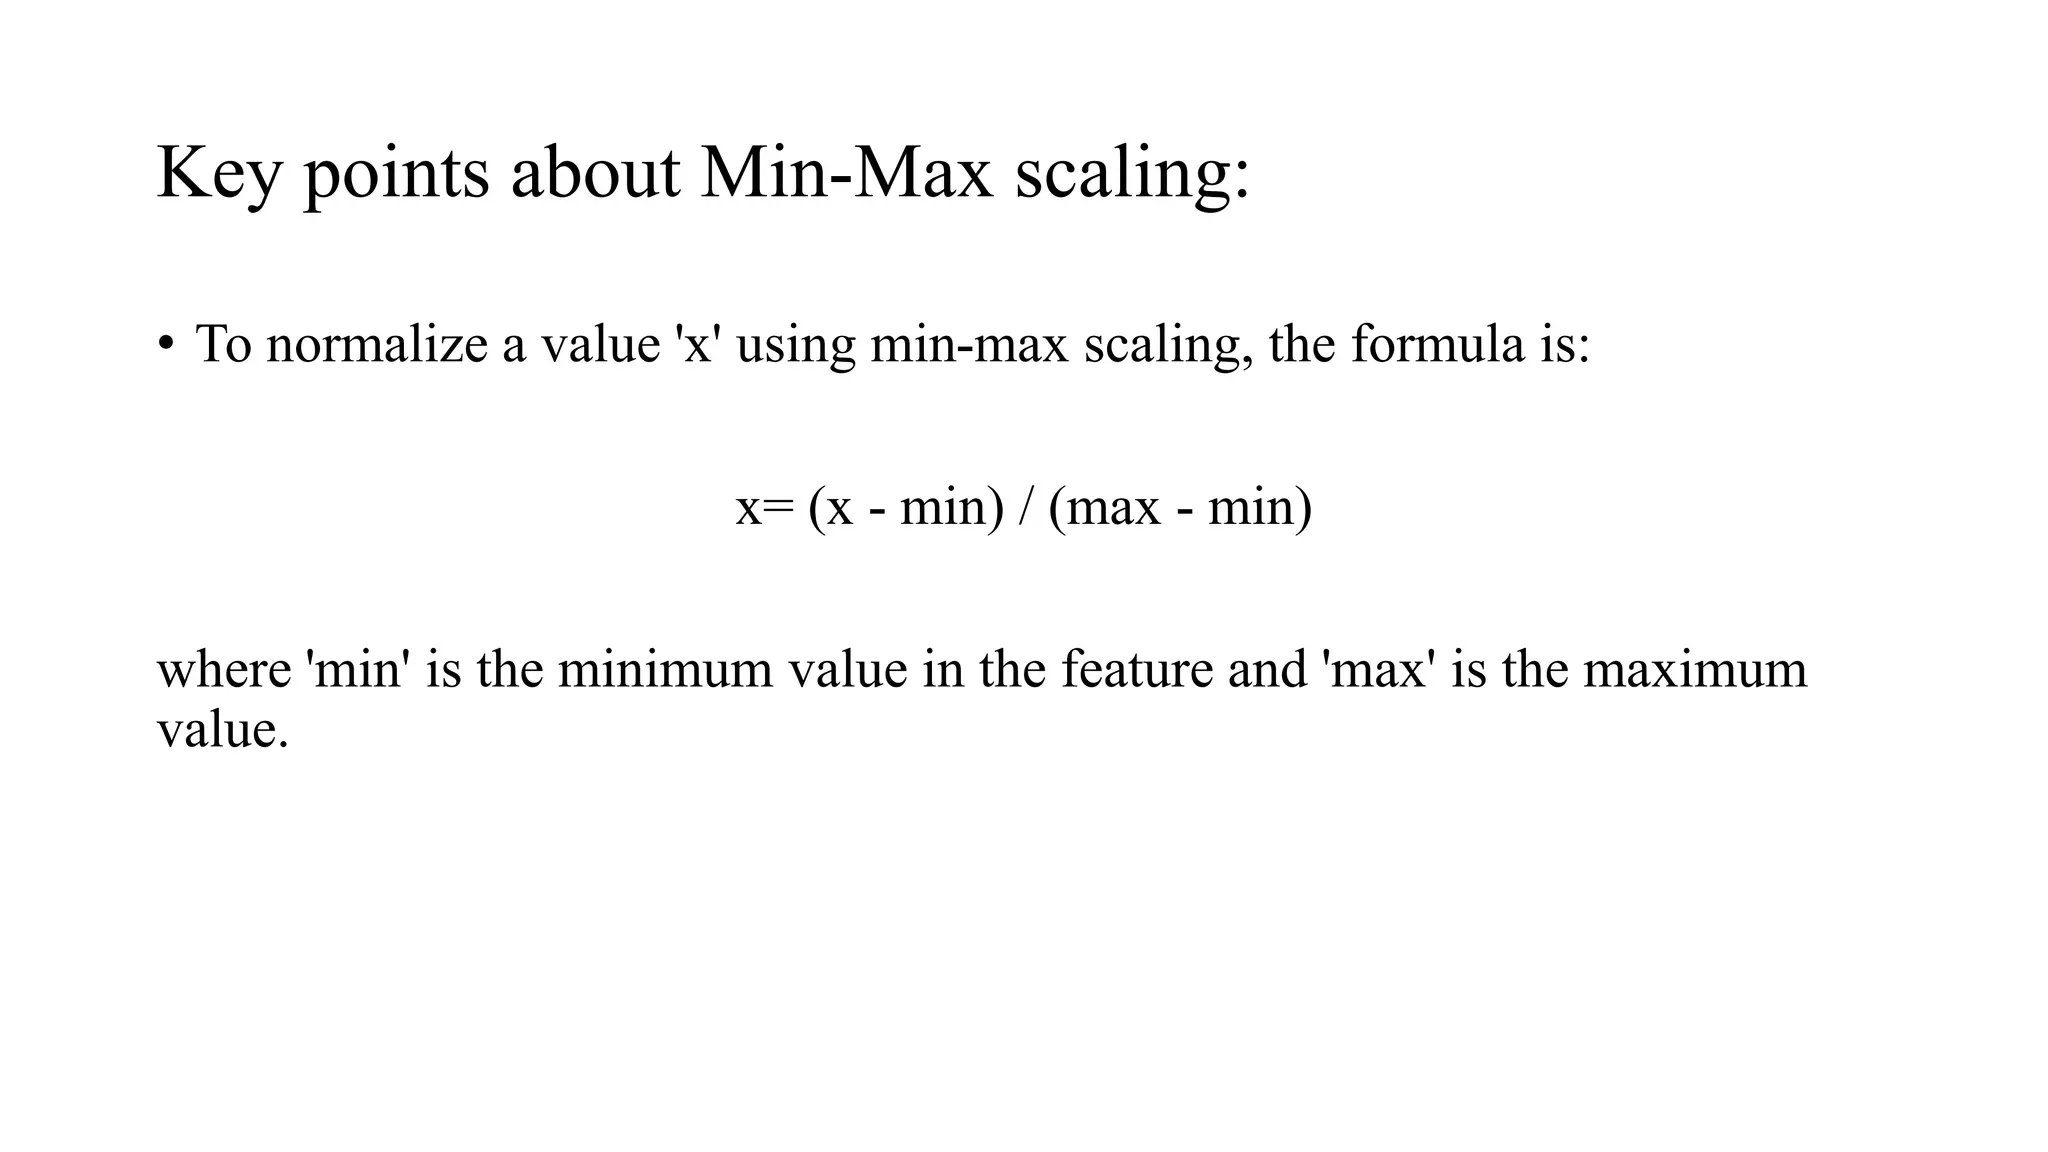
Key points aboutMin-Max scaling: • To normalize a value 'x' using min-max scaling, the formula is: x= (x - min) / (max - min) where 'min' is the minimum value in the feature and 'max' is the maximum value.
50.
When to useMin-Max scaling: • When you need to scale features to a specific range (like 0 to 1) and preserve relative relationships between data points. • When dealing with datasets where features have significantly different scales and you want to ensure no single feature dominates the analysis.
51.
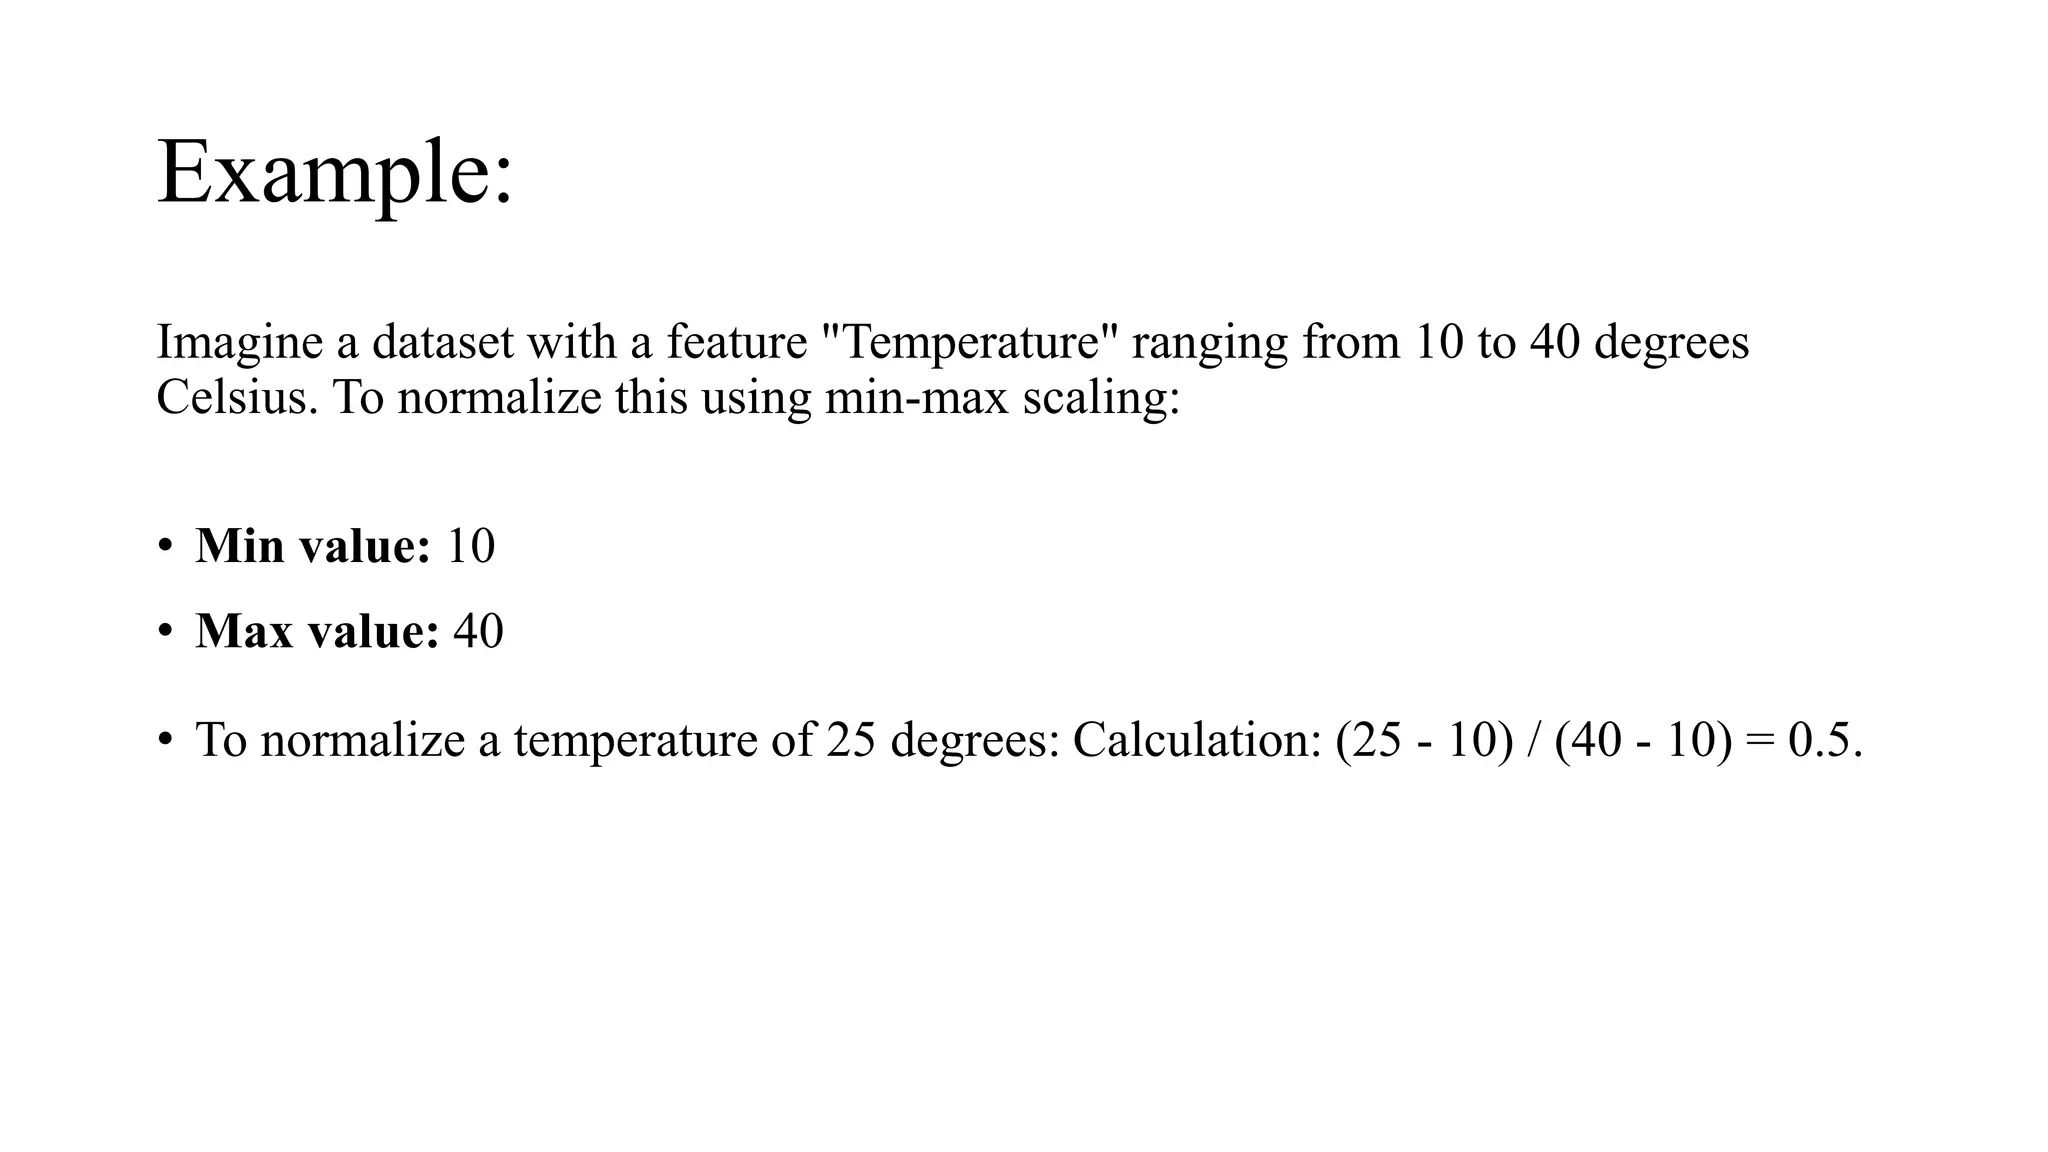
Example: Imagine a datasetwith a feature "Temperature" ranging from 10 to 40 degrees Celsius. To normalize this using min-max scaling: • Min value: 10 • Max value: 40 • To normalize a temperature of 25 degrees: Calculation: (25 - 10) / (40 - 10) = 0.5.
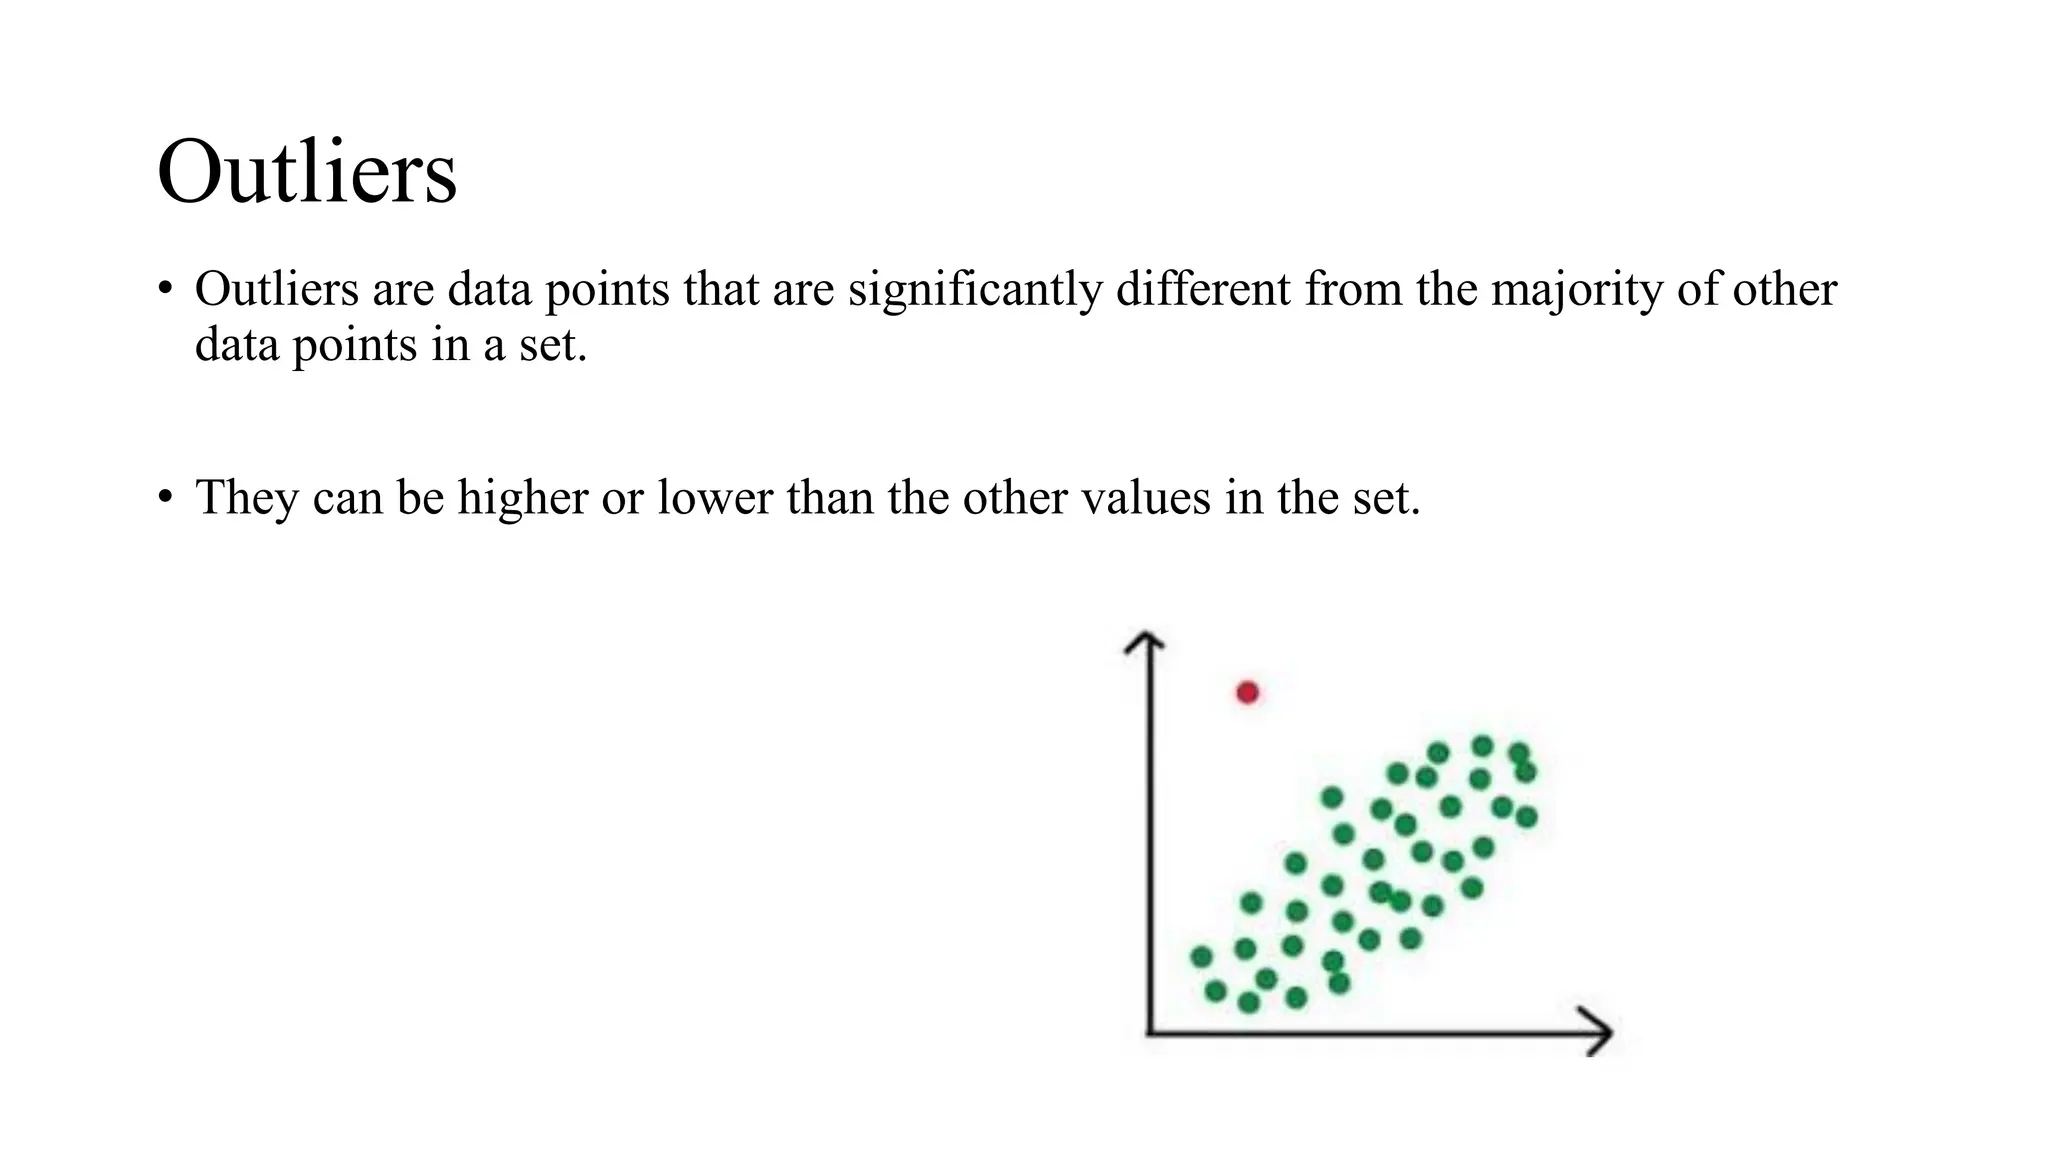
Outliers • Outliers aredata points that are significantly different from the majority of other data points in a set. • They can be higher or lower than the other values in the set.
56.
Important Questions: • Whatis data preprocessing in the context of machine learning? • Explain Data Cleaning with Python's pandas Library. • What are common data quality issues you might encounter? • How do you handle missing data within a dataset? • What is the difference between imputation and deletion of missing values? • What is one-hot encoding, and when should it be used? Explain with an example. • Write a NumPy program to compute the mean, standard deviation and the median of a given array . Sample array [0 1 2 3 4 5]
57.
1. import pandasas pd import numpy as np # Create a sample DataFrame data = { 'Age': [22, 25, 27, np.nan, 30, 35], 'Gender': ['Male', 'Female', 'Female', 'Male', 'Female', 'Male'], 'Salary': [50000, 60000, np.nan, 80000, 75000, 90000] } df = pd.DataFrame(data) # Display the original data print("Original Data:") print(df) # 1. Handling missing data Fill missing values for 'Age' column with the mean df['Age'].fillna(df['Age'].mean(), inplace=True) # Fill missing values for 'Salary' column with the median df['Salary'].fillna(df['Salary'].median(), inplace=True)
58.
# 2. Encodingcategorical data (e.g., Gender column) Convert 'Gender' column to numerical values (Male = 0, Female = 1) df['Gender'] = df['Gender'].map({'Male': 0, 'Female': 1}) # 3. Feature scaling (standardization of 'Salary' column) # Standardize the 'Salary' column using z-score normalization df['Salary'] = (df['Salary'] - df['Salary'].mean()) / df['Salary'].std() # Display the preprocessed data print("nPreprocessed Data:") print(df)
59.
2. • Handling missingvalues: import pandas as pd import numpy as np # Sample DataFrame with missing values data = {'Name': ['Alice', 'Bob', 'Charlie', 'David', 'Eve'], 'Age': [25, np.nan, 30, 22, np.nan], 'Salary': [50000, 60000, np.nan, 80000, 75000]} df = pd.DataFrame(data) # Checking for missing values print(df.isnull()) # True for NaN values
60.
• Filling MissingData # Filling missing values with the mean of the column df['Age'].fillna(df['Age'].mean(), inplace=True) df['Salary'].fillna(df['Salary'].mean(), inplace=True) print("nAfter Filling Missing Values:") print(df)
61.
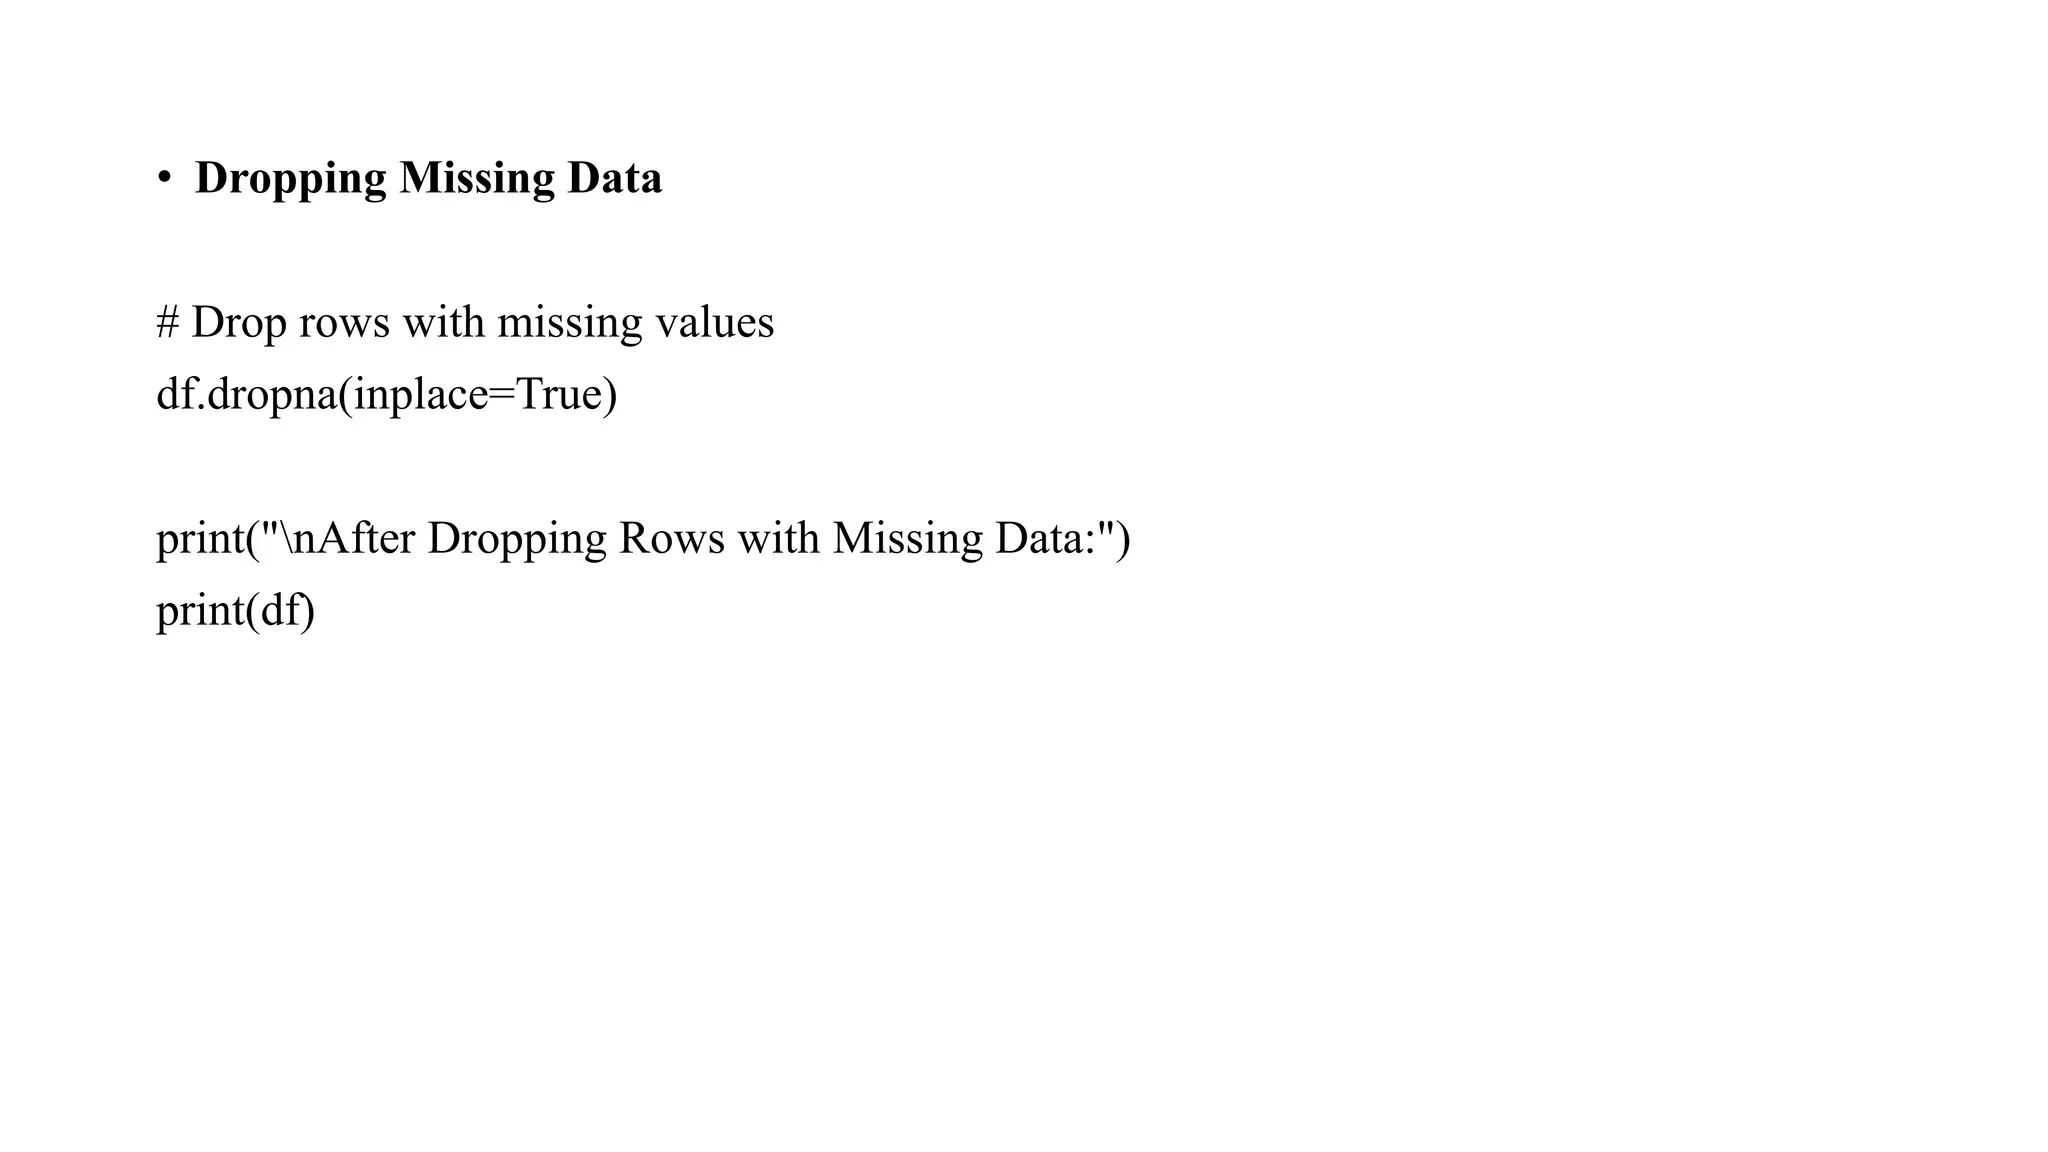
• Dropping MissingData # Drop rows with missing values df.dropna(inplace=True) print("nAfter Dropping Rows with Missing Data:") print(df)
7. import numpy asnp # Given array arr = np.array([0, 1, 2, 3, 4, 5]) # Compute mean, standard deviation, and median mean = np.mean(arr) std_dev = np.std(arr) median = np.median(arr) # Print results print("Mean:", mean) print("Standard Deviation:", std_dev) print("Median:", median)
65.
Questions: 1. How doyou calculate the mean, median, and mode using Python? 2. How do you calculate the weighted mean in Python? 3. How do you find the mode for categorical data in Python? 4. How do you identify if the data is skewed using mean and median?
66.
How do youcalculate the mean, median, and mode using Python? import numpy as np from scipy import stats # Sample data data = [10, 20, 20, 30, 40, 50, 100] # Mean mean = np.mean(data) print("Mean:", mean) # Median median = np.median(data) print("Median:", median) # Mode mode = stats.mode(data) print("Mode:", mode.mode[0], "Count:", mode.count[0])
67.
How do youcalculate the weighted mean in Python? import numpy as np # Data and weights data = [10, 20, 30, 40] weights = [1, 2, 3, 4] # Weighted mean weighted_mean = np.average(data, weights=weights) print("Weighted Mean:", weighted_mean)
68.
How do youfind the mode for categorical data in Python? from scipy import stats # Categorical data categories = ['apple', 'banana', 'apple', 'orange', 'banana', 'banana'] # Mode mode = stats.mode(categories) print("Mode:", mode.mode[0], "Count:", mode.count[0])
69.
How do youidentify if the data is skewed using mean and median? data = [10, 20, 30, 40, 100] # Right-skewed data mean = np.mean(data) median = np.median(data) if mean > median: print("The data is right-skewed.") elif mean < median: print("The data is left-skewed.") else: print("The data is symmetric.")
70.
1. Create apython code using pandas library to create binary columns for each category, where dataset data = {‘Vehicle’: [‘BUS’, ‘VAN’, ‘TRAIN’, ‘BUS’, ‘CYCLE’]} 2. Write a python code using Pandas library to delete the duplicate values. 3. Write a NumPy program to compute the mean and the median of a given array. data = [1, 2, 2, 3, 4, 5, 10] 4. Create a DataFrame where data = pd.DataFrame({ 'name': ['John', 'Jane', 'Jack', 'John', None], 'age': [28, 34, None, 28, 22], 'purchase_amount': [100.5, None, 85.3, 100.5, 50.0], 'date_of_purchase': ['2023/12/01', '2023/12/02', '2023/12/01', '2023/12/01', '2023/12/03'] }) Write a program in python using the Mean imputation method to replace the missing values.
![Data Cleaning Tool: Handling Missing Values # Creating a manual dataset data = pd.DataFrame({ 'name': ['John', 'Jane', 'Jack', 'John', None], 'age': [28, 34, None, 28, 22], 'purchase_amount': [100.5, None, 85.3, 100.5, 50.0], 'date_of_purchase': ['2023/12/01', '2023/12/02', '2023/12/01', '2023/12/01', '2023/12/03'] }) # Handling missing values using mean imputation for 'age' and 'purchase_amount' imputer = SimpleImputer(strategy='mean') data[['age', 'purchase_amount']] = imputer.fit_transform(data[['age', 'purchase_amount']]) # Removing duplicate rows data = data.drop_duplicates() print(data)](https://image.slidesharecdn.com/damodule2-250521061938-098227f1/75/Data-Analytics-Data-Preprocessing-What-is-Data-Preprocessing-6-2048.jpg)
![Effective Strategies for Handling Missing Values in Data Analysis import pandas as pd import numpy as np # Creating a sample DataFrame with missing values data = { 'School ID': [101, 102, 103, np.nan, 105, 106, 107, 108], 'Name': ['Alice', 'Bob', 'Charlie', 'David', 'Eva', 'Frank', 'Grace', 'Henry'], 'Address': ['123 Main St', '456 Oak Ave', '789 Pine Ln', '101 Elm St', np.nan, '222 Maple Rd', '444 Cedar Blvd', '555 Birch Dr'], 'City': ['Los Angeles', 'New York', 'Houston', 'Los Angeles', 'Miami', np.nan, 'Houston', 'New York'], 'Subject': ['Math', 'English', 'Science', 'Math', 'History', 'Math', 'Science', 'English'], 'Marks': [85, 92, 78, 89, np.nan, 95, 80, 88], 'Rank': [2, 1, 4, 3, 8, 1, 5, 3], 'Grade': ['B', 'A', 'C', 'B', 'D', 'A', 'C', 'B'] } df = pd.DataFrame(data) print("Sample DataFrame:") print(df)](https://image.slidesharecdn.com/damodule2-250521061938-098227f1/75/Data-Analytics-Data-Preprocessing-What-is-Data-Preprocessing-10-2048.jpg)
![Step 2 - Setting up the Data df = pd.DataFrame() df['C0'] = [0.2601,0.2358,0.1429,0.1259,0.7526, 0.7341,0.4546,0.1426,0.1490,0.2500] df['C1'] = [0.7154,np.nan,0.2615,0.5846,np.nan, 0.8308,0.4962,np.nan,0.5340,0.6731] print(df)](https://image.slidesharecdn.com/damodule2-250521061938-098227f1/75/Data-Analytics-Data-Preprocessing-What-is-Data-Preprocessing-15-2048.jpg)
![#replacing missing values in quantity # column with mean of that column data['quantity'] = data['quantity'].fillna(data['quantity'].mean()) # replacing missing values in price column # with median of that column data['price'] = data['price'].fillna(data['price'].median()) print(Data)](https://image.slidesharecdn.com/damodule2-250521061938-098227f1/75/Data-Analytics-Data-Preprocessing-What-is-Data-Preprocessing-22-2048.jpg)
![Mode imputation: • Mode - The most common value from scipy import stats speed = [99,86,87,88,111,86,103,87,94,78,77,85,86] x = stats.mode(speed) print(x) #The mode() method returns a ModeResult object that contains the mode number (86), and count (how many times the mode number appeared (3)).](https://image.slidesharecdn.com/damodule2-250521061938-098227f1/75/Data-Analytics-Data-Preprocessing-What-is-Data-Preprocessing-23-2048.jpg)
![Data Cleaning and Transformation Use Pandas or other libraries to clean and normalize the data # Drop null values • df = df.dropna() # Rename columns • df = df.rename(columns={'OldName': 'NewName'}) # Standardize formats • df['date'] = pd.to_datetime(df['date'])](https://image.slidesharecdn.com/damodule2-250521061938-098227f1/75/Data-Analytics-Data-Preprocessing-What-is-Data-Preprocessing-30-2048.jpg)
![Combining Data • Concatenation: Stack datasets vertically. combined_df = pd.concat([df1, df2]) • Merging: Combine datasets based on a key. merged_df = pd.merge(df1, df2, on='common_key’)](https://image.slidesharecdn.com/damodule2-250521061938-098227f1/75/Data-Analytics-Data-Preprocessing-What-is-Data-Preprocessing-31-2048.jpg)
![Steps for Label Encoding Using sklearn.preprocessing.LabelEncoder from sklearn.preprocessing import LabelEncoder # Sample categorical data categories = ['cat', 'dog', 'mouse', 'dog', 'cat', 'mouse'] # Initialize LabelEncoder encoder = LabelEncoder() # Fit and transform the data encoded_labels = encoder.fit_transform(categories) print(encoded_labels) # Output: [0 1 2 1 0 2] # Get the mapping print(encoder.classes_) # Output: ['cat' 'dog' 'mouse'] # Decode back to original categories decoded_labels = encoder.inverse_transform(encoded_labels) print(decoded_labels) # Output: ['cat' 'dog' 'mouse' 'dog' 'cat' 'mouse']](https://image.slidesharecdn.com/damodule2-250521061938-098227f1/75/Data-Analytics-Data-Preprocessing-What-is-Data-Preprocessing-35-2048.jpg)
![import pandas as pd # Sample categorical data categories = ['cat', 'dog', 'mouse', 'dog', 'cat', 'mouse'] # Encode labels encoded_labels, uniques = pd.factorize(categories) print(encoded_labels) # Output: [0 1 2 1 0 2] print(uniques) # Output: Index(['cat', 'dog', 'mouse'], dtype='object') Using pandas.factorize](https://image.slidesharecdn.com/damodule2-250521061938-098227f1/75/Data-Analytics-Data-Preprocessing-What-is-Data-Preprocessing-36-2048.jpg)
![import pandas as pd # Sample data data = {'Color': ['Red', 'Green', 'Blue', 'Red']} df = pd.DataFrame(data) # Applying one-hot encoding df_encoded = pd.get_dummies(df, dtype=int) # Displaying the encoded DataFrame print(df_encoded) Using Pandas get_dummies()](https://image.slidesharecdn.com/damodule2-250521061938-098227f1/75/Data-Analytics-Data-Preprocessing-What-is-Data-Preprocessing-42-2048.jpg)
![from sklearn.preprocessing import OneHotEncoder import numpy as np # Creating the encoder enc = OneHotEncoder(handle_unknown='ignore') # Sample data X = [['Red'], ['Green'], ['Blue']] # Fitting the encoder to the data enc.fit(X) # Transforming new data result = enc.transform([['Red']]).toarray() # Displaying the encoded result print(result) Using Scikit-learn's OneHotEncoder](https://image.slidesharecdn.com/damodule2-250521061938-098227f1/75/Data-Analytics-Data-Preprocessing-What-is-Data-Preprocessing-44-2048.jpg)

![Important Questions: • What is data preprocessing in the context of machine learning? • Explain Data Cleaning with Python's pandas Library. • What are common data quality issues you might encounter? • How do you handle missing data within a dataset? • What is the difference between imputation and deletion of missing values? • What is one-hot encoding, and when should it be used? Explain with an example. • Write a NumPy program to compute the mean, standard deviation and the median of a given array . Sample array [0 1 2 3 4 5]](https://image.slidesharecdn.com/damodule2-250521061938-098227f1/75/Data-Analytics-Data-Preprocessing-What-is-Data-Preprocessing-56-2048.jpg)
![1. import pandas as pd import numpy as np # Create a sample DataFrame data = { 'Age': [22, 25, 27, np.nan, 30, 35], 'Gender': ['Male', 'Female', 'Female', 'Male', 'Female', 'Male'], 'Salary': [50000, 60000, np.nan, 80000, 75000, 90000] } df = pd.DataFrame(data) # Display the original data print("Original Data:") print(df) # 1. Handling missing data Fill missing values for 'Age' column with the mean df['Age'].fillna(df['Age'].mean(), inplace=True) # Fill missing values for 'Salary' column with the median df['Salary'].fillna(df['Salary'].median(), inplace=True)](https://image.slidesharecdn.com/damodule2-250521061938-098227f1/75/Data-Analytics-Data-Preprocessing-What-is-Data-Preprocessing-57-2048.jpg)
![# 2. Encoding categorical data (e.g., Gender column) Convert 'Gender' column to numerical values (Male = 0, Female = 1) df['Gender'] = df['Gender'].map({'Male': 0, 'Female': 1}) # 3. Feature scaling (standardization of 'Salary' column) # Standardize the 'Salary' column using z-score normalization df['Salary'] = (df['Salary'] - df['Salary'].mean()) / df['Salary'].std() # Display the preprocessed data print("nPreprocessed Data:") print(df)](https://image.slidesharecdn.com/damodule2-250521061938-098227f1/75/Data-Analytics-Data-Preprocessing-What-is-Data-Preprocessing-58-2048.jpg)
![2. • Handling missing values: import pandas as pd import numpy as np # Sample DataFrame with missing values data = {'Name': ['Alice', 'Bob', 'Charlie', 'David', 'Eve'], 'Age': [25, np.nan, 30, 22, np.nan], 'Salary': [50000, 60000, np.nan, 80000, 75000]} df = pd.DataFrame(data) # Checking for missing values print(df.isnull()) # True for NaN values](https://image.slidesharecdn.com/damodule2-250521061938-098227f1/75/Data-Analytics-Data-Preprocessing-What-is-Data-Preprocessing-59-2048.jpg)
![• Filling Missing Data # Filling missing values with the mean of the column df['Age'].fillna(df['Age'].mean(), inplace=True) df['Salary'].fillna(df['Salary'].mean(), inplace=True) print("nAfter Filling Missing Values:") print(df)](https://image.slidesharecdn.com/damodule2-250521061938-098227f1/75/Data-Analytics-Data-Preprocessing-What-is-Data-Preprocessing-60-2048.jpg)
![• Removing Duplicates # Sample DataFrame with duplicates data = {'Name': ['Alice', 'Bob', 'Charlie', 'Bob', 'Alice'], 'Age': [25, 30, 35, 30, 25], 'Salary': [50000, 60000, 70000, 60000, 50000]} df = pd.DataFrame(data) # Removing duplicate rows df.drop_duplicates(inplace=True) print("nAfter Removing Duplicates:") print(df)](https://image.slidesharecdn.com/damodule2-250521061938-098227f1/75/Data-Analytics-Data-Preprocessing-What-is-Data-Preprocessing-62-2048.jpg)
![6. import pandas as pd # Sample data data = pd.DataFrame({'Size': ['S', 'M', 'M', 'L', 'S', 'L']}) # One-hot encoding one_hot_encoded = pd.get_dummies(data, columns=['Size']) print(one_hot_encoded)](https://image.slidesharecdn.com/damodule2-250521061938-098227f1/75/Data-Analytics-Data-Preprocessing-What-is-Data-Preprocessing-63-2048.jpg)
![7. import numpy as np # Given array arr = np.array([0, 1, 2, 3, 4, 5]) # Compute mean, standard deviation, and median mean = np.mean(arr) std_dev = np.std(arr) median = np.median(arr) # Print results print("Mean:", mean) print("Standard Deviation:", std_dev) print("Median:", median)](https://image.slidesharecdn.com/damodule2-250521061938-098227f1/75/Data-Analytics-Data-Preprocessing-What-is-Data-Preprocessing-64-2048.jpg)
![How do you calculate the mean, median, and mode using Python? import numpy as np from scipy import stats # Sample data data = [10, 20, 20, 30, 40, 50, 100] # Mean mean = np.mean(data) print("Mean:", mean) # Median median = np.median(data) print("Median:", median) # Mode mode = stats.mode(data) print("Mode:", mode.mode[0], "Count:", mode.count[0])](https://image.slidesharecdn.com/damodule2-250521061938-098227f1/75/Data-Analytics-Data-Preprocessing-What-is-Data-Preprocessing-66-2048.jpg)
![How do you calculate the weighted mean in Python? import numpy as np # Data and weights data = [10, 20, 30, 40] weights = [1, 2, 3, 4] # Weighted mean weighted_mean = np.average(data, weights=weights) print("Weighted Mean:", weighted_mean)](https://image.slidesharecdn.com/damodule2-250521061938-098227f1/75/Data-Analytics-Data-Preprocessing-What-is-Data-Preprocessing-67-2048.jpg)
![How do you find the mode for categorical data in Python? from scipy import stats # Categorical data categories = ['apple', 'banana', 'apple', 'orange', 'banana', 'banana'] # Mode mode = stats.mode(categories) print("Mode:", mode.mode[0], "Count:", mode.count[0])](https://image.slidesharecdn.com/damodule2-250521061938-098227f1/75/Data-Analytics-Data-Preprocessing-What-is-Data-Preprocessing-68-2048.jpg)
![How do you identify if the data is skewed using mean and median? data = [10, 20, 30, 40, 100] # Right-skewed data mean = np.mean(data) median = np.median(data) if mean > median: print("The data is right-skewed.") elif mean < median: print("The data is left-skewed.") else: print("The data is symmetric.")](https://image.slidesharecdn.com/damodule2-250521061938-098227f1/75/Data-Analytics-Data-Preprocessing-What-is-Data-Preprocessing-69-2048.jpg)
![1. Create a python code using pandas library to create binary columns for each category, where dataset data = {‘Vehicle’: [‘BUS’, ‘VAN’, ‘TRAIN’, ‘BUS’, ‘CYCLE’]} 2. Write a python code using Pandas library to delete the duplicate values. 3. Write a NumPy program to compute the mean and the median of a given array. data = [1, 2, 2, 3, 4, 5, 10] 4. Create a DataFrame where data = pd.DataFrame({ 'name': ['John', 'Jane', 'Jack', 'John', None], 'age': [28, 34, None, 28, 22], 'purchase_amount': [100.5, None, 85.3, 100.5, 50.0], 'date_of_purchase': ['2023/12/01', '2023/12/02', '2023/12/01', '2023/12/01', '2023/12/03'] }) Write a program in python using the Mean imputation method to replace the missing values.](https://image.slidesharecdn.com/damodule2-250521061938-098227f1/75/Data-Analytics-Data-Preprocessing-What-is-Data-Preprocessing-70-2048.jpg)