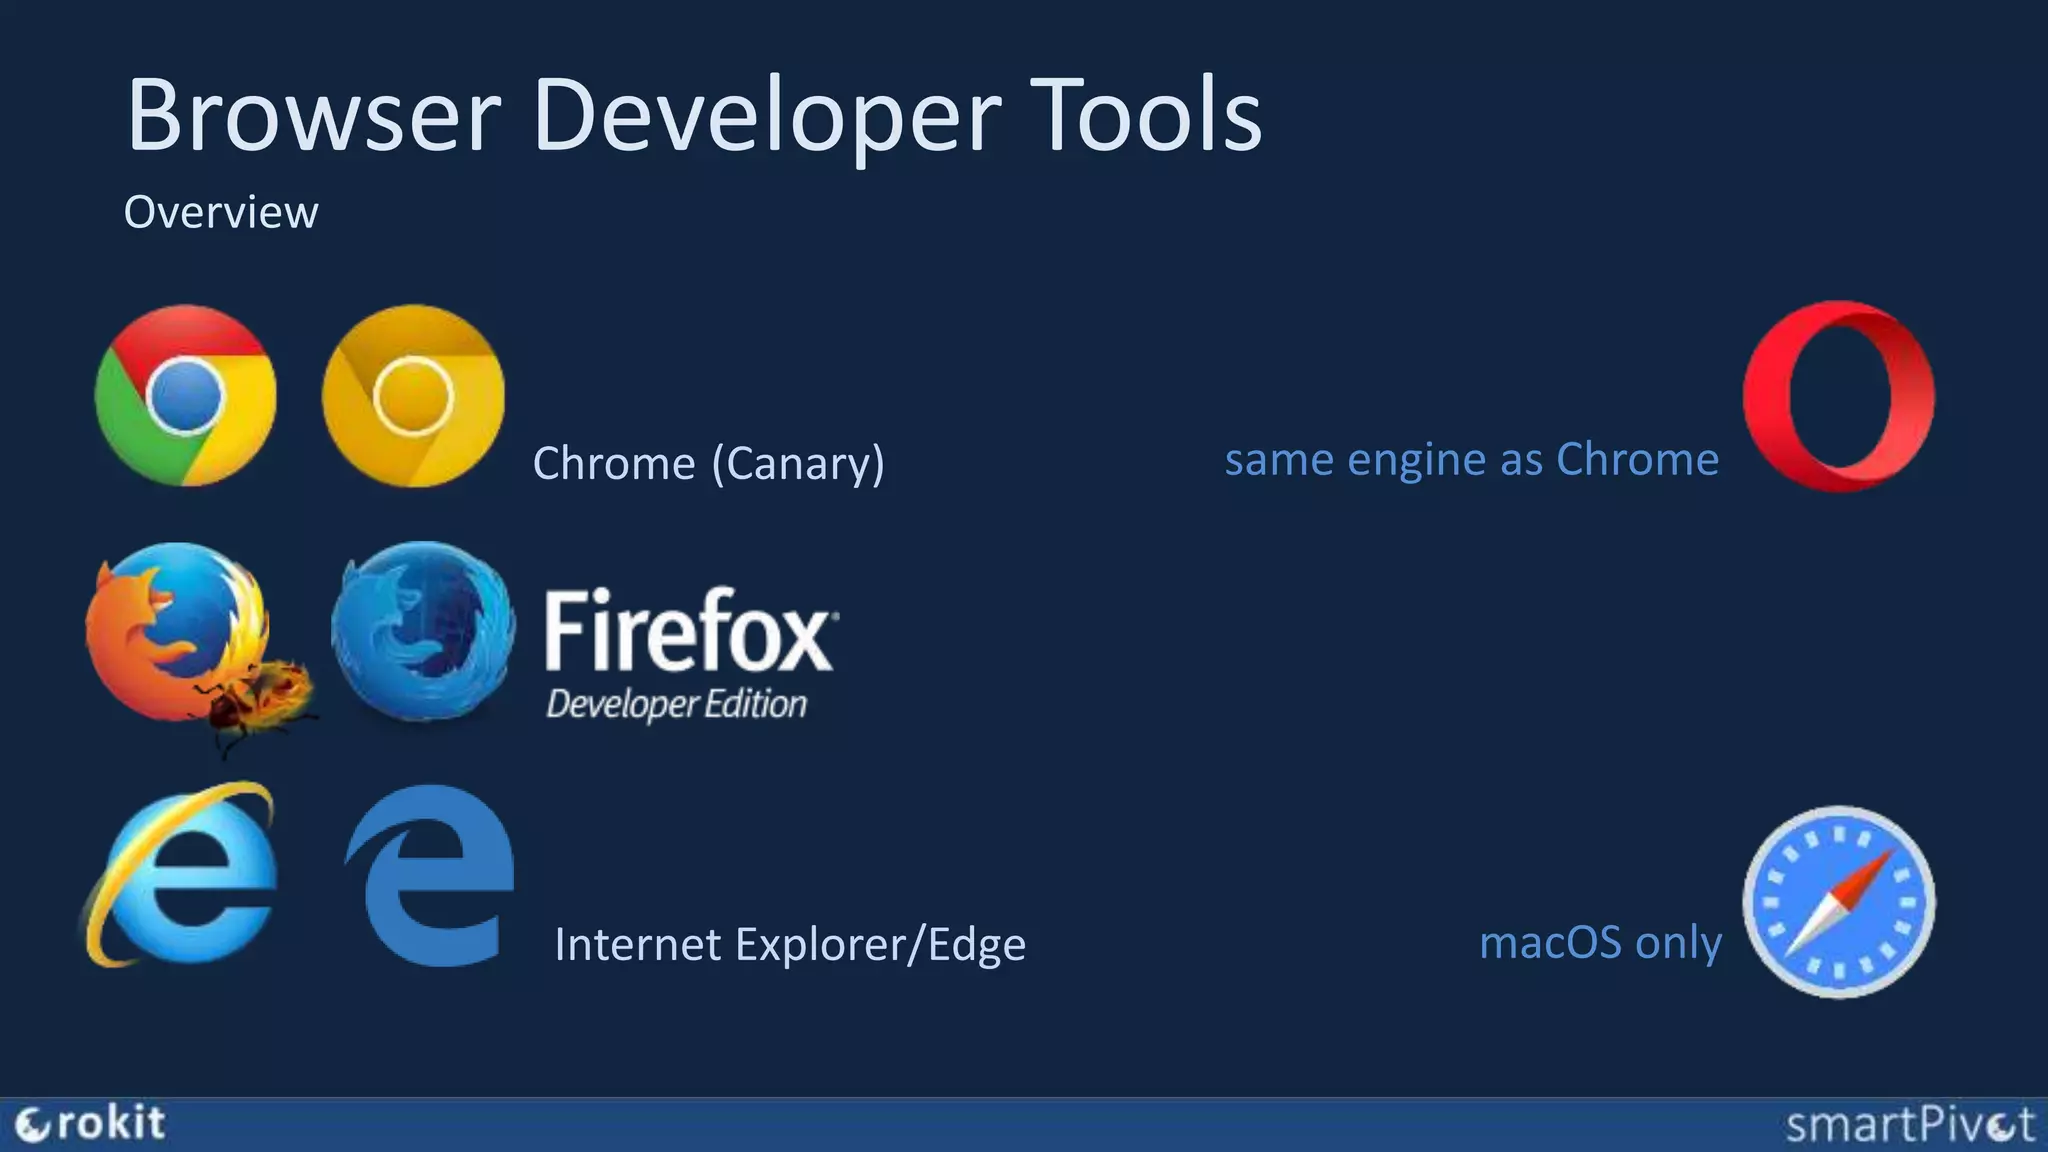
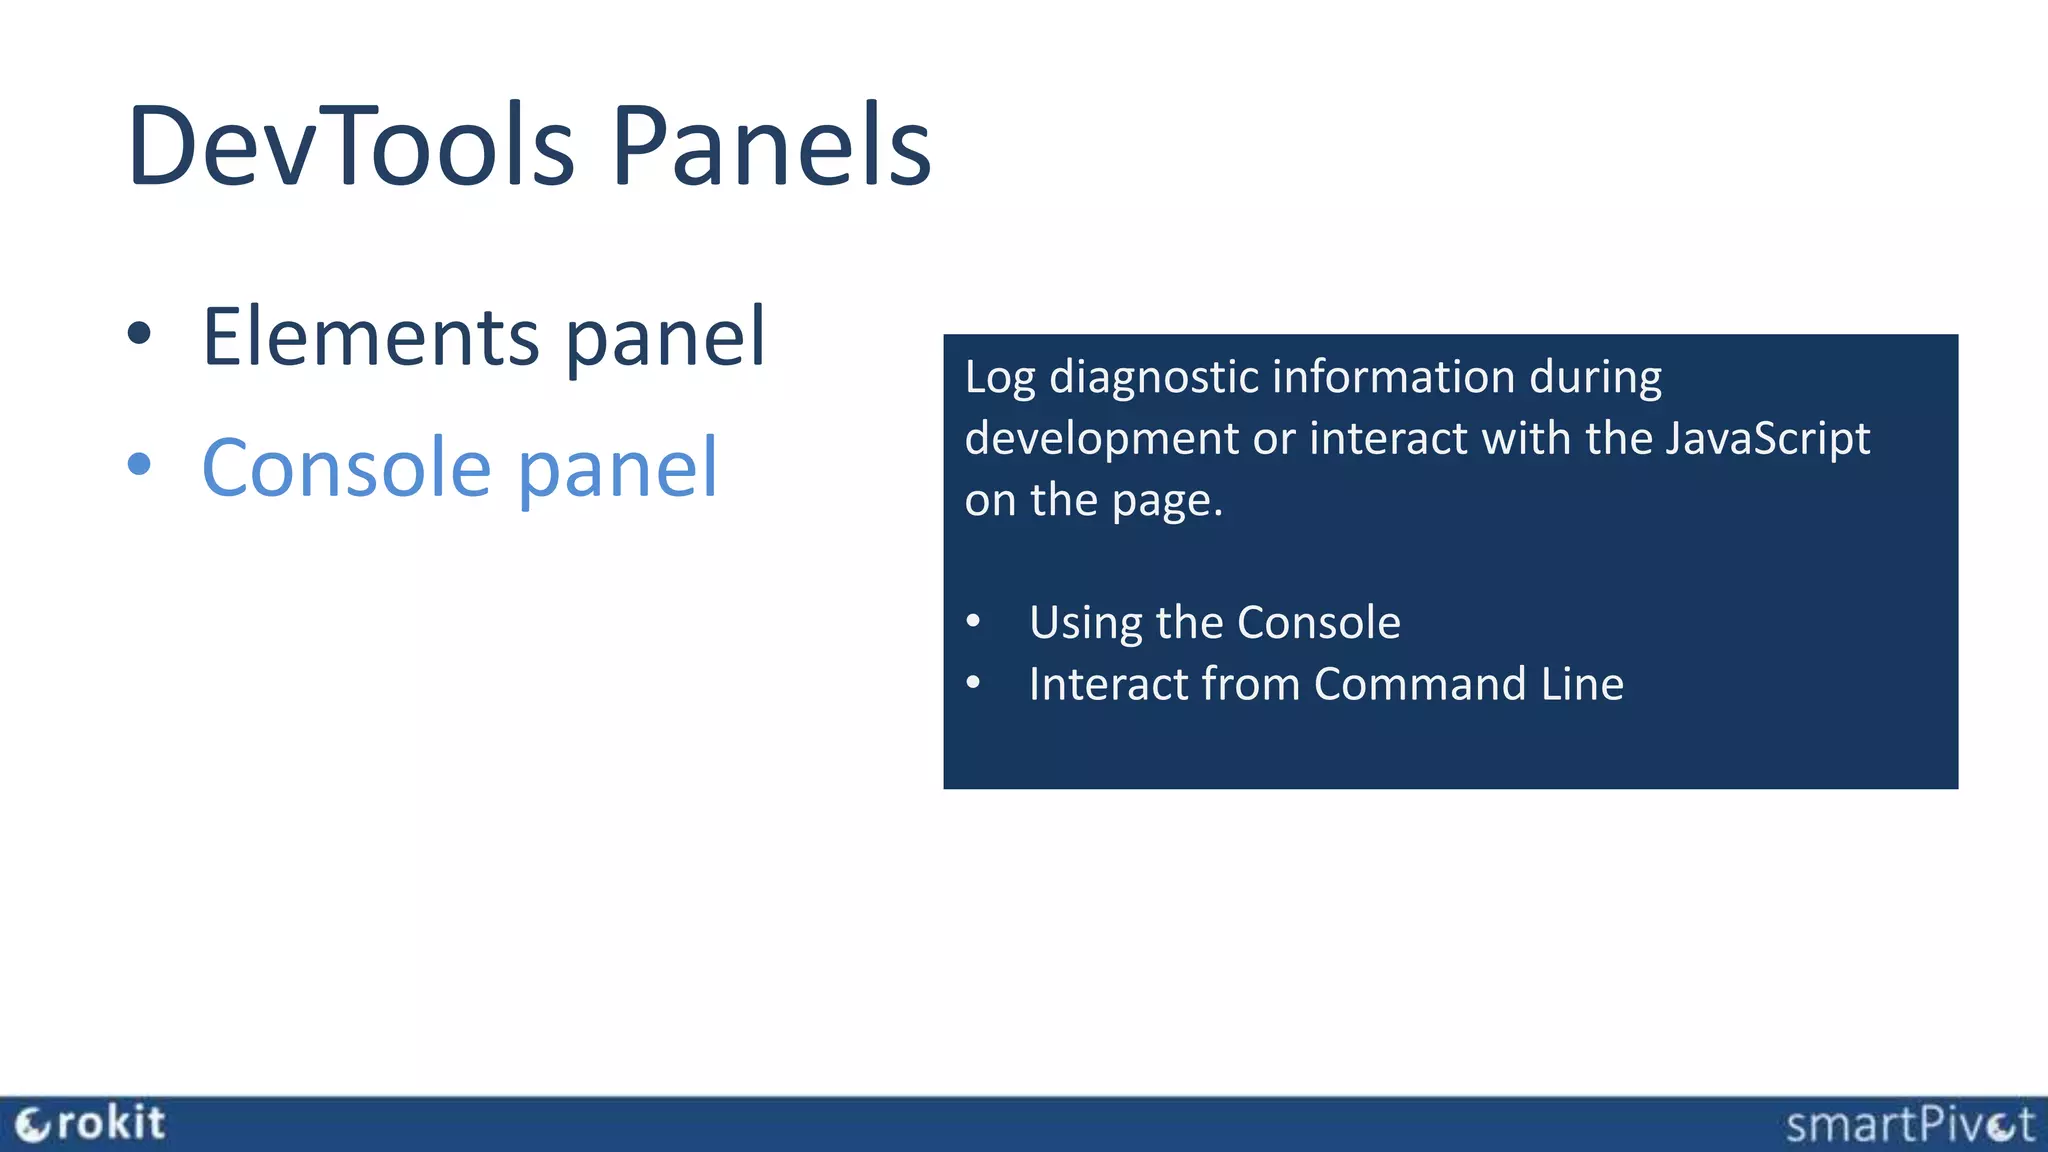
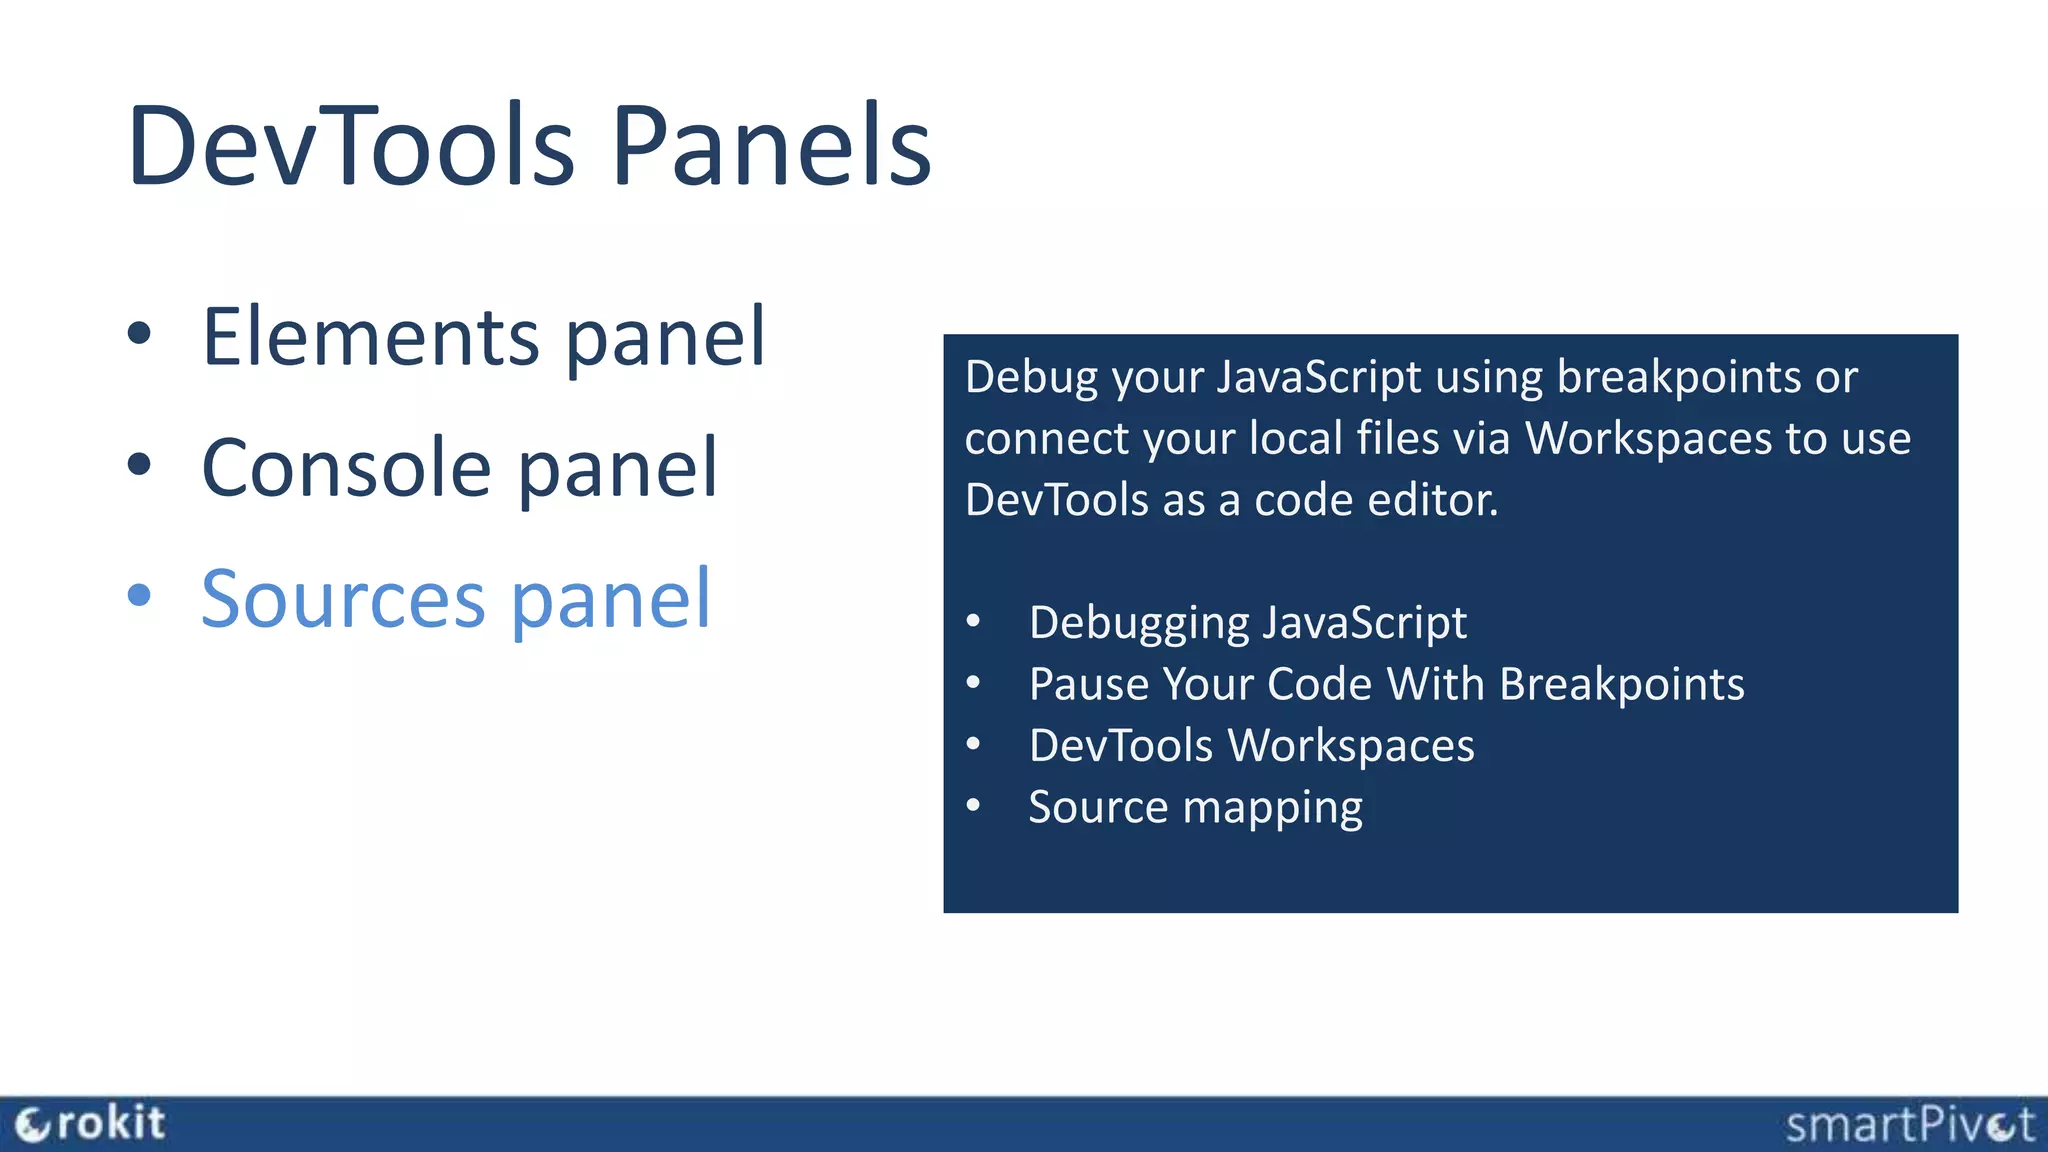
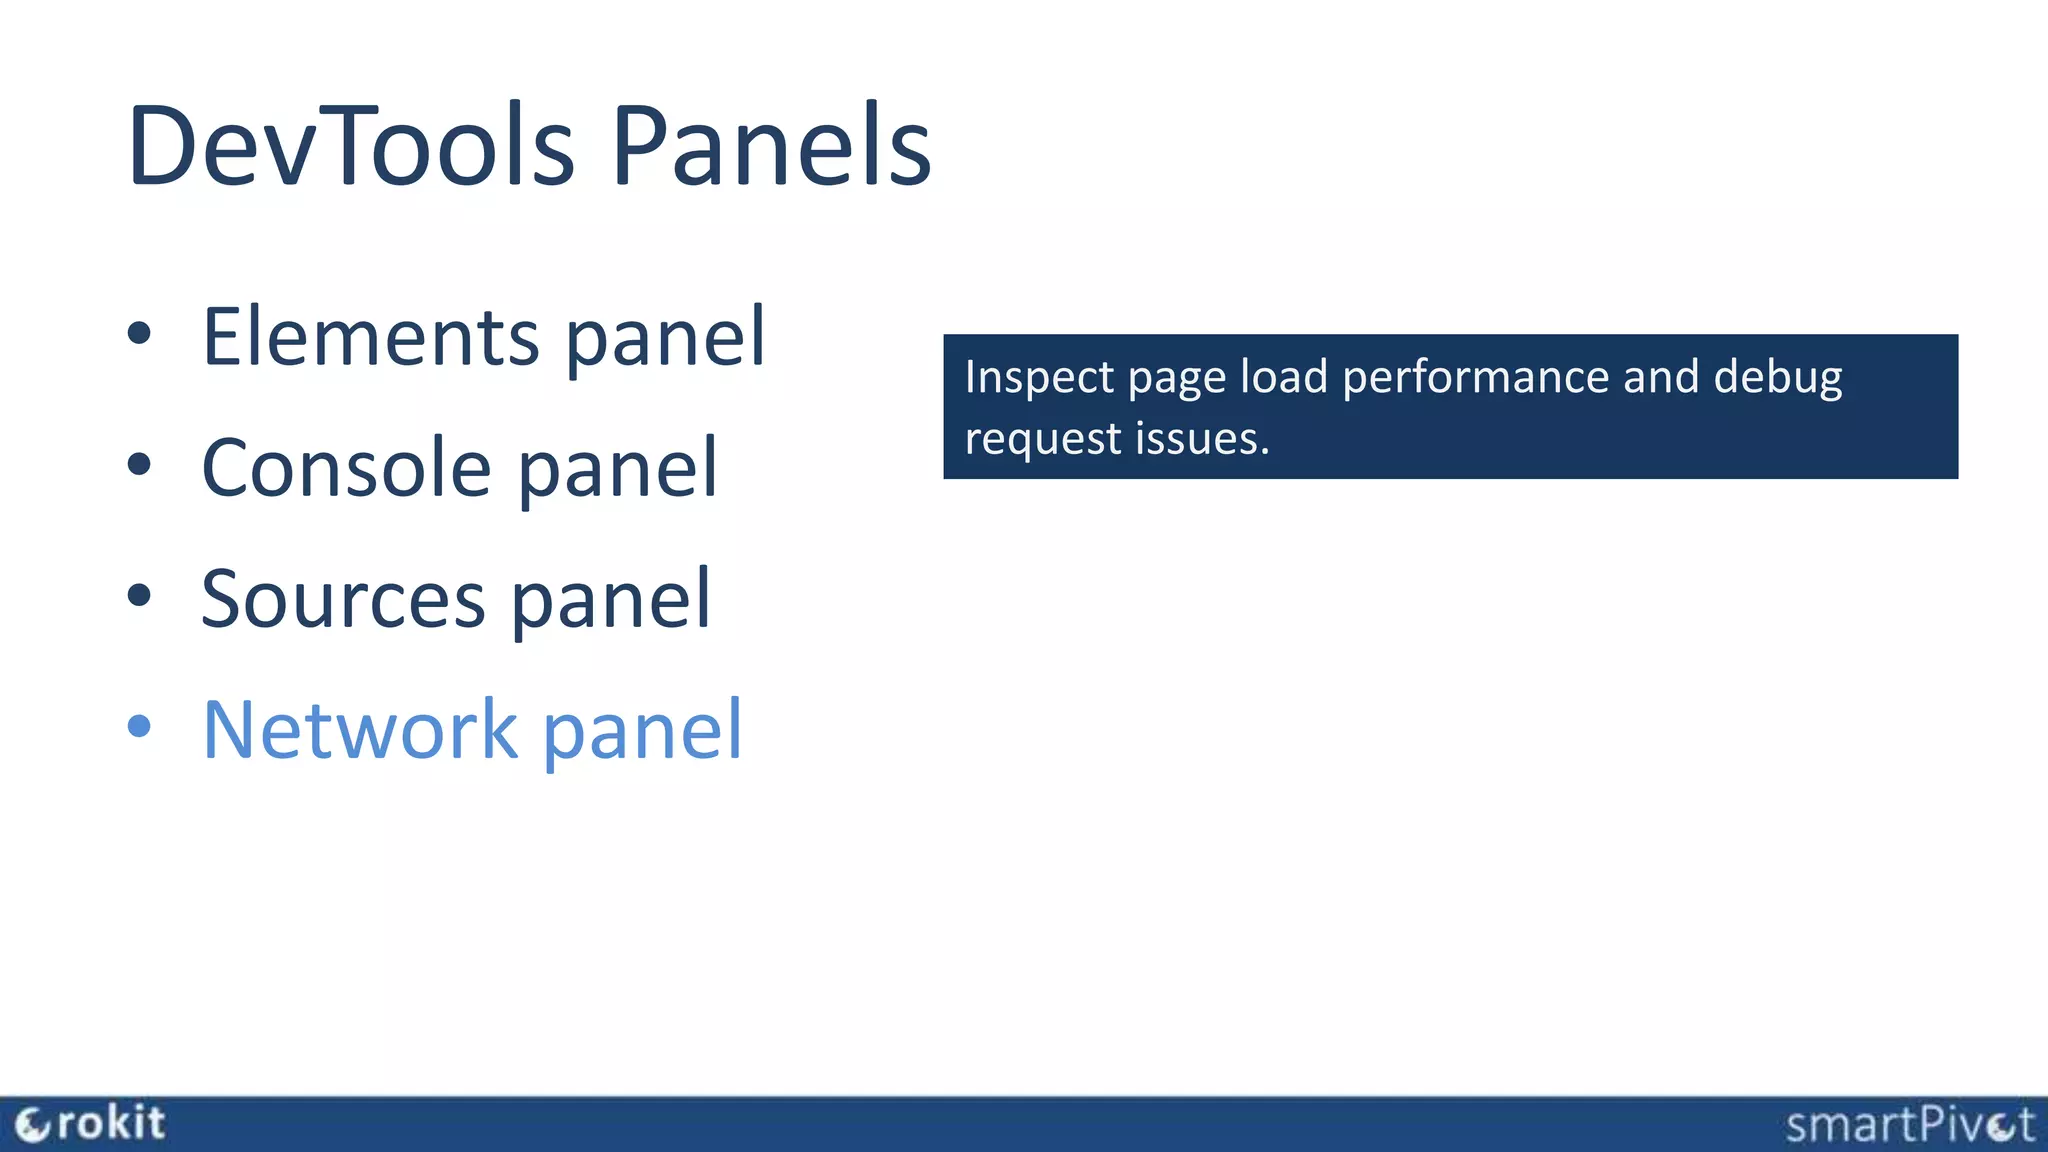
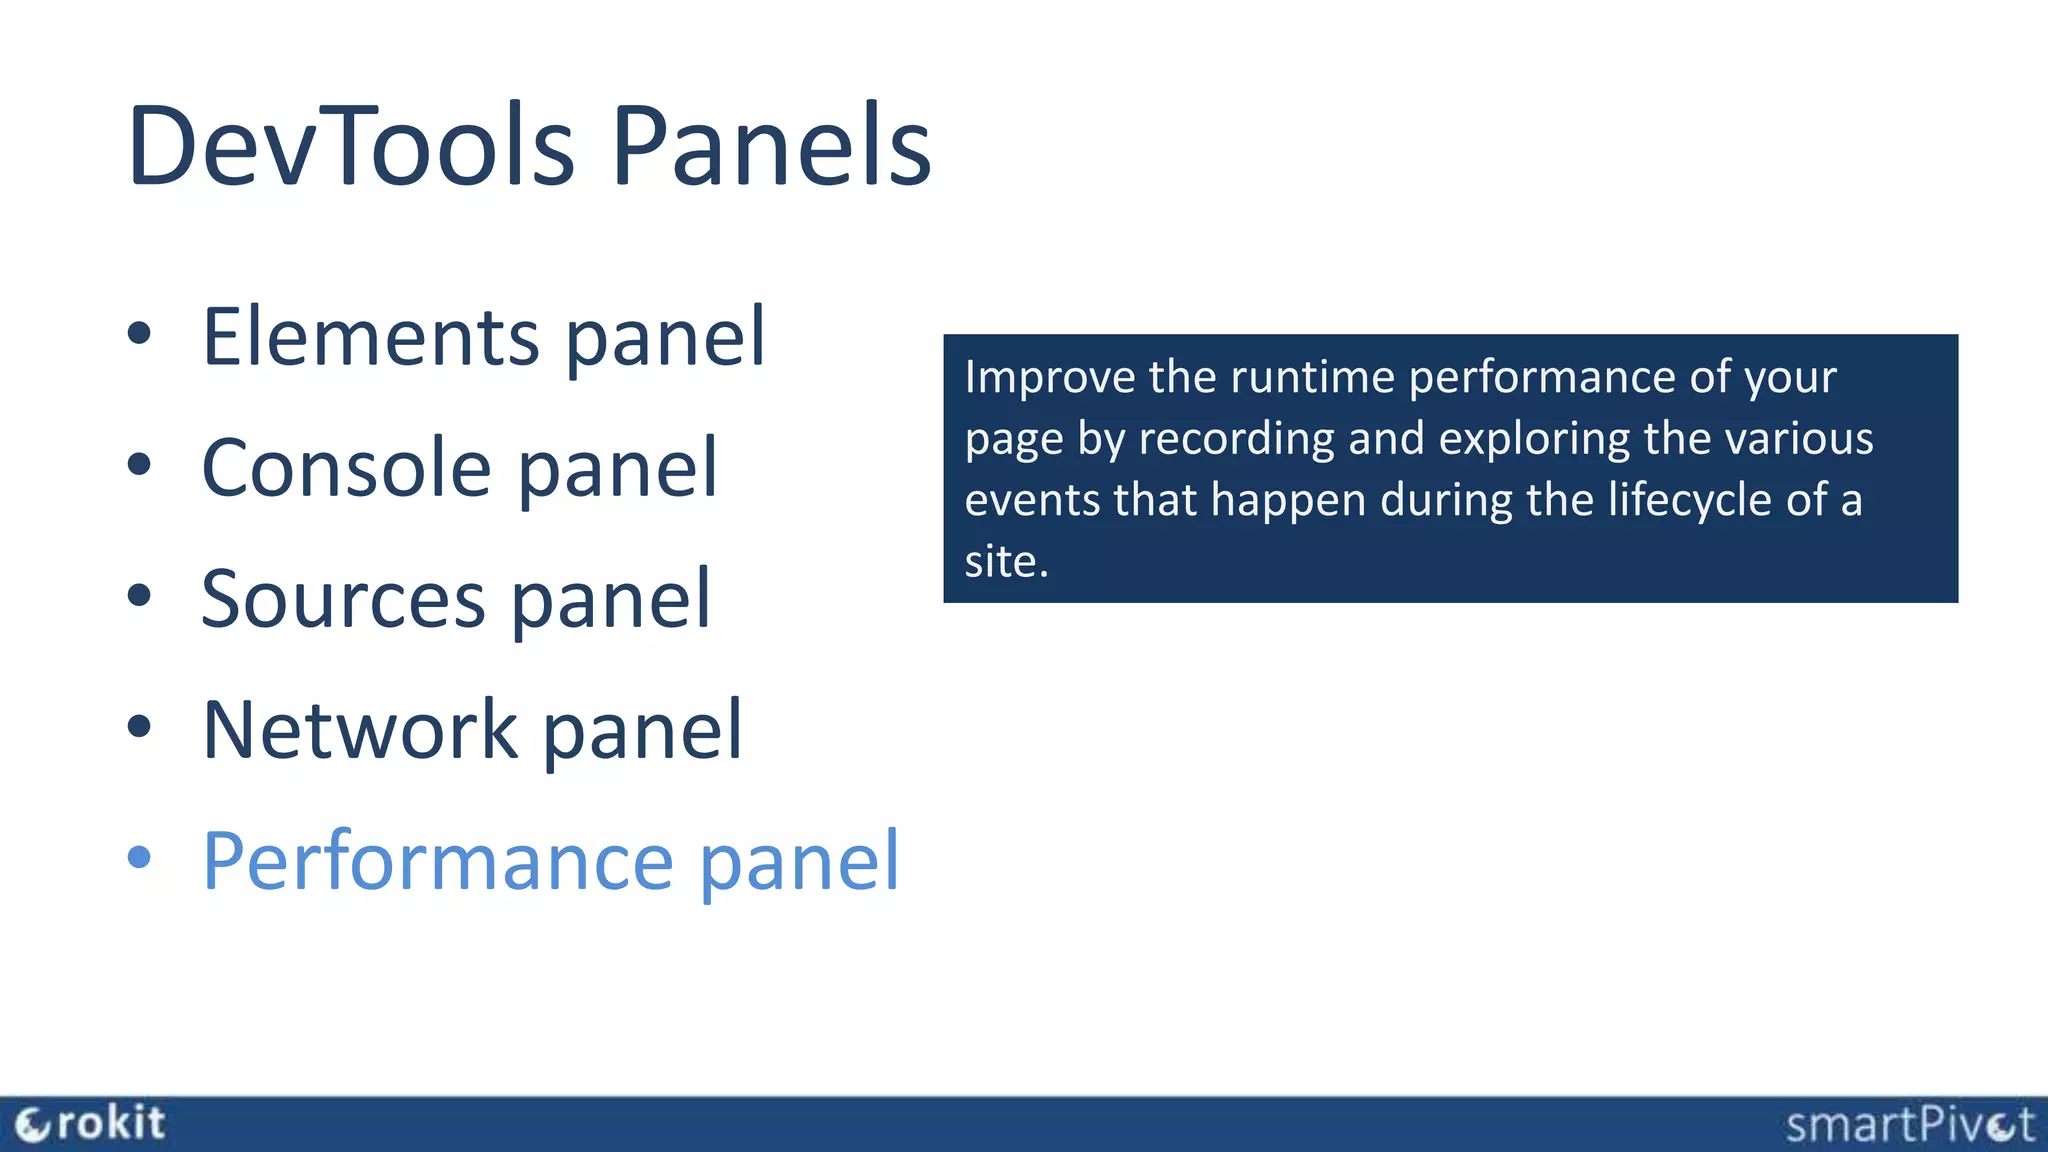
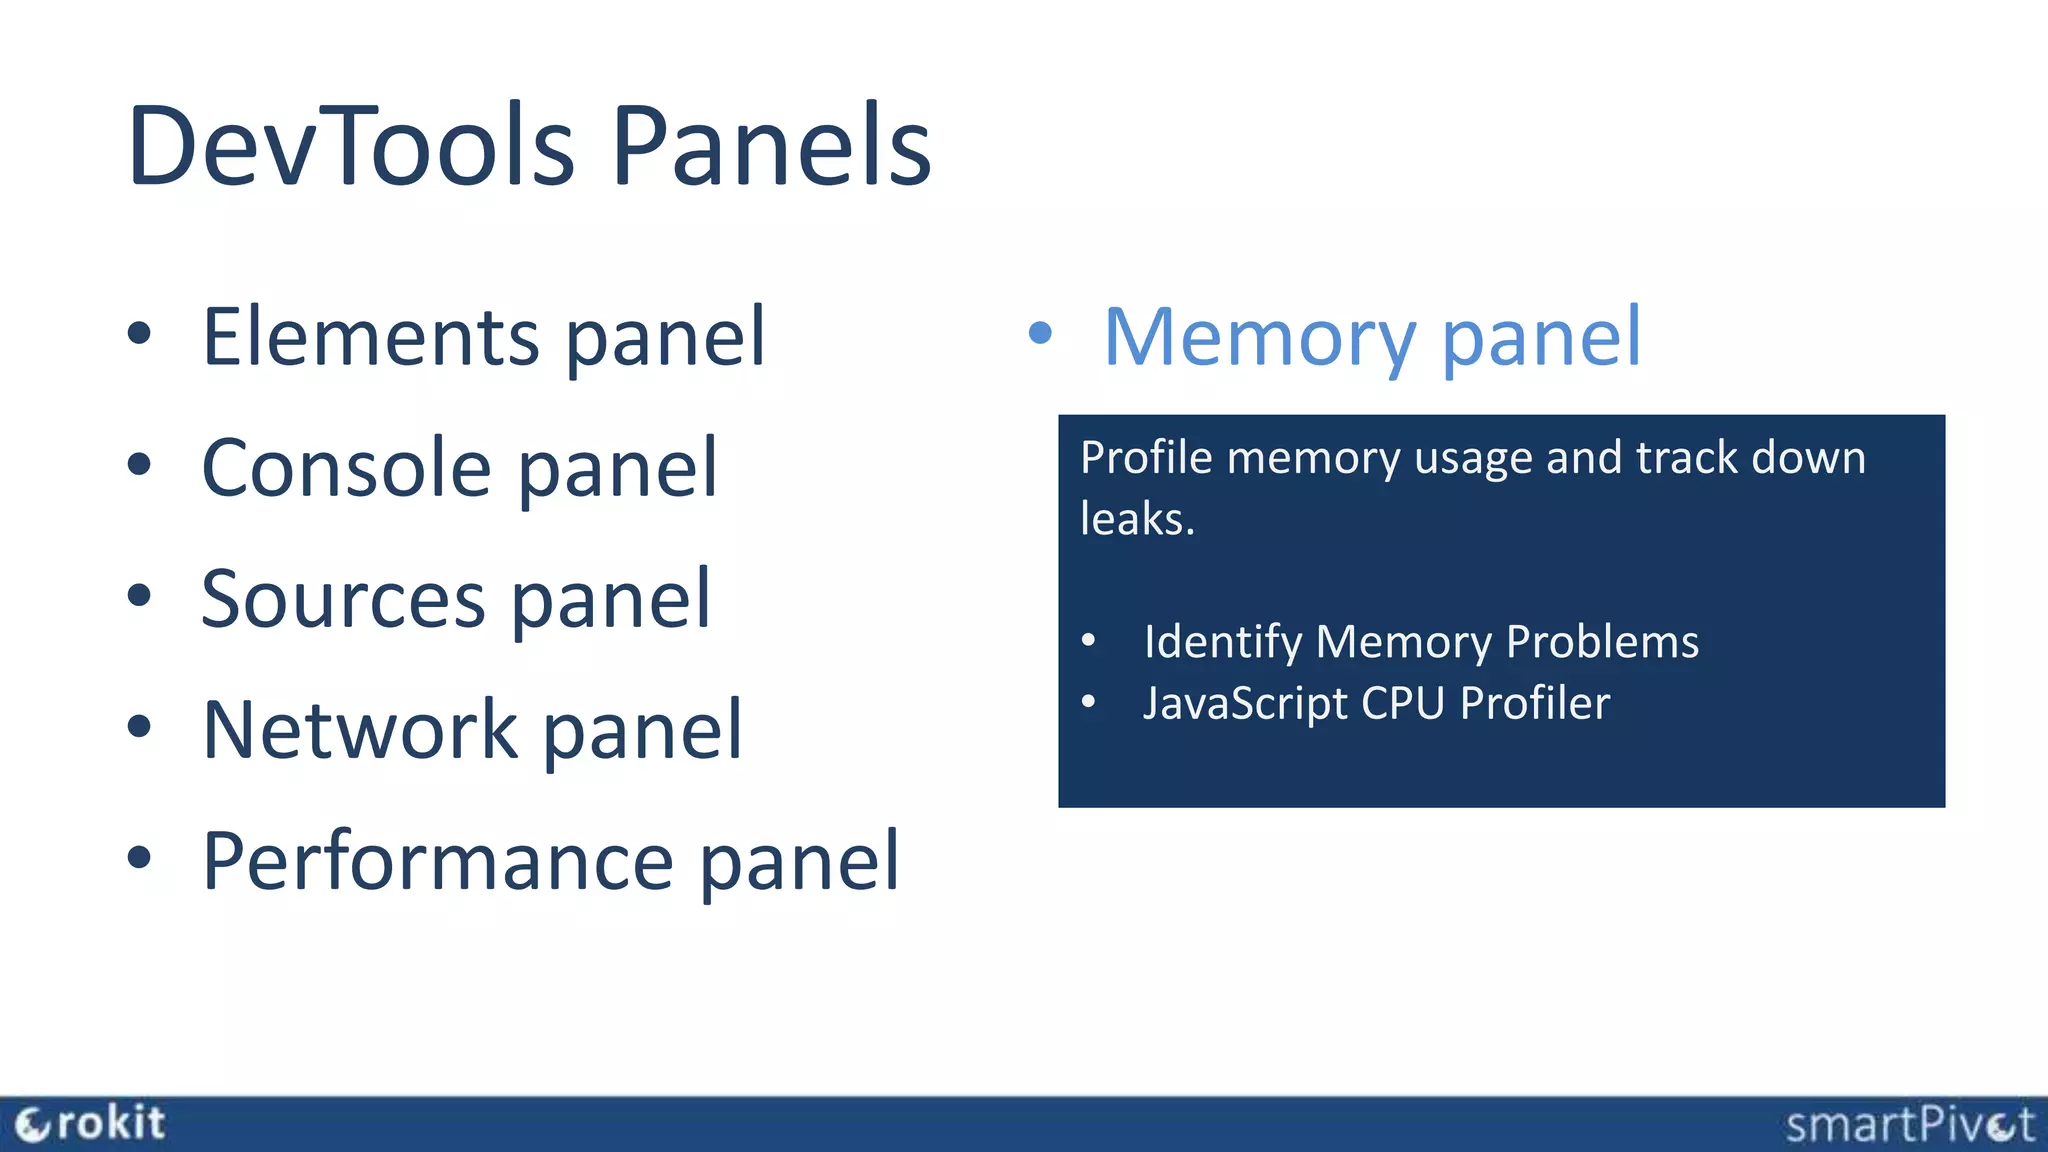
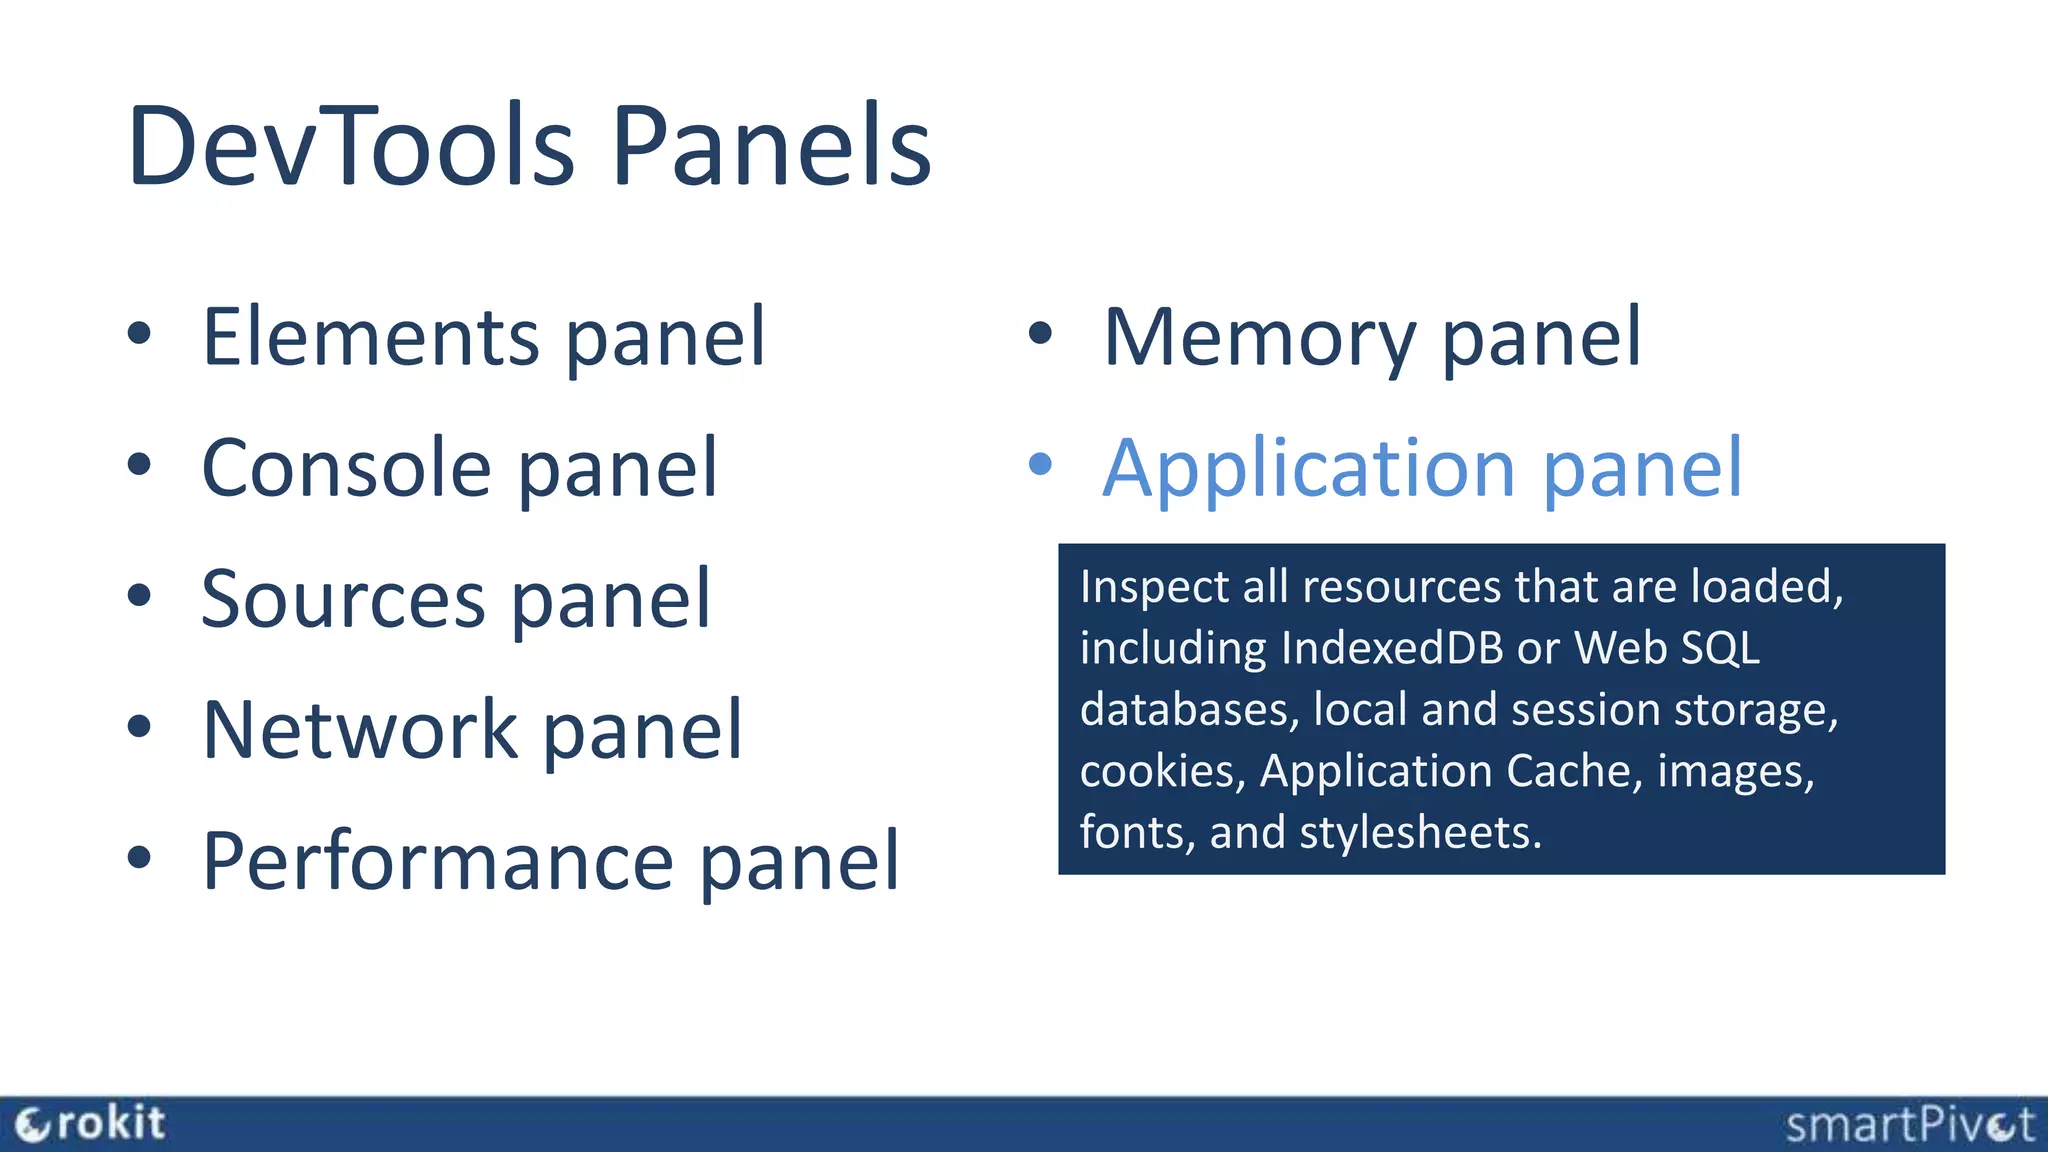
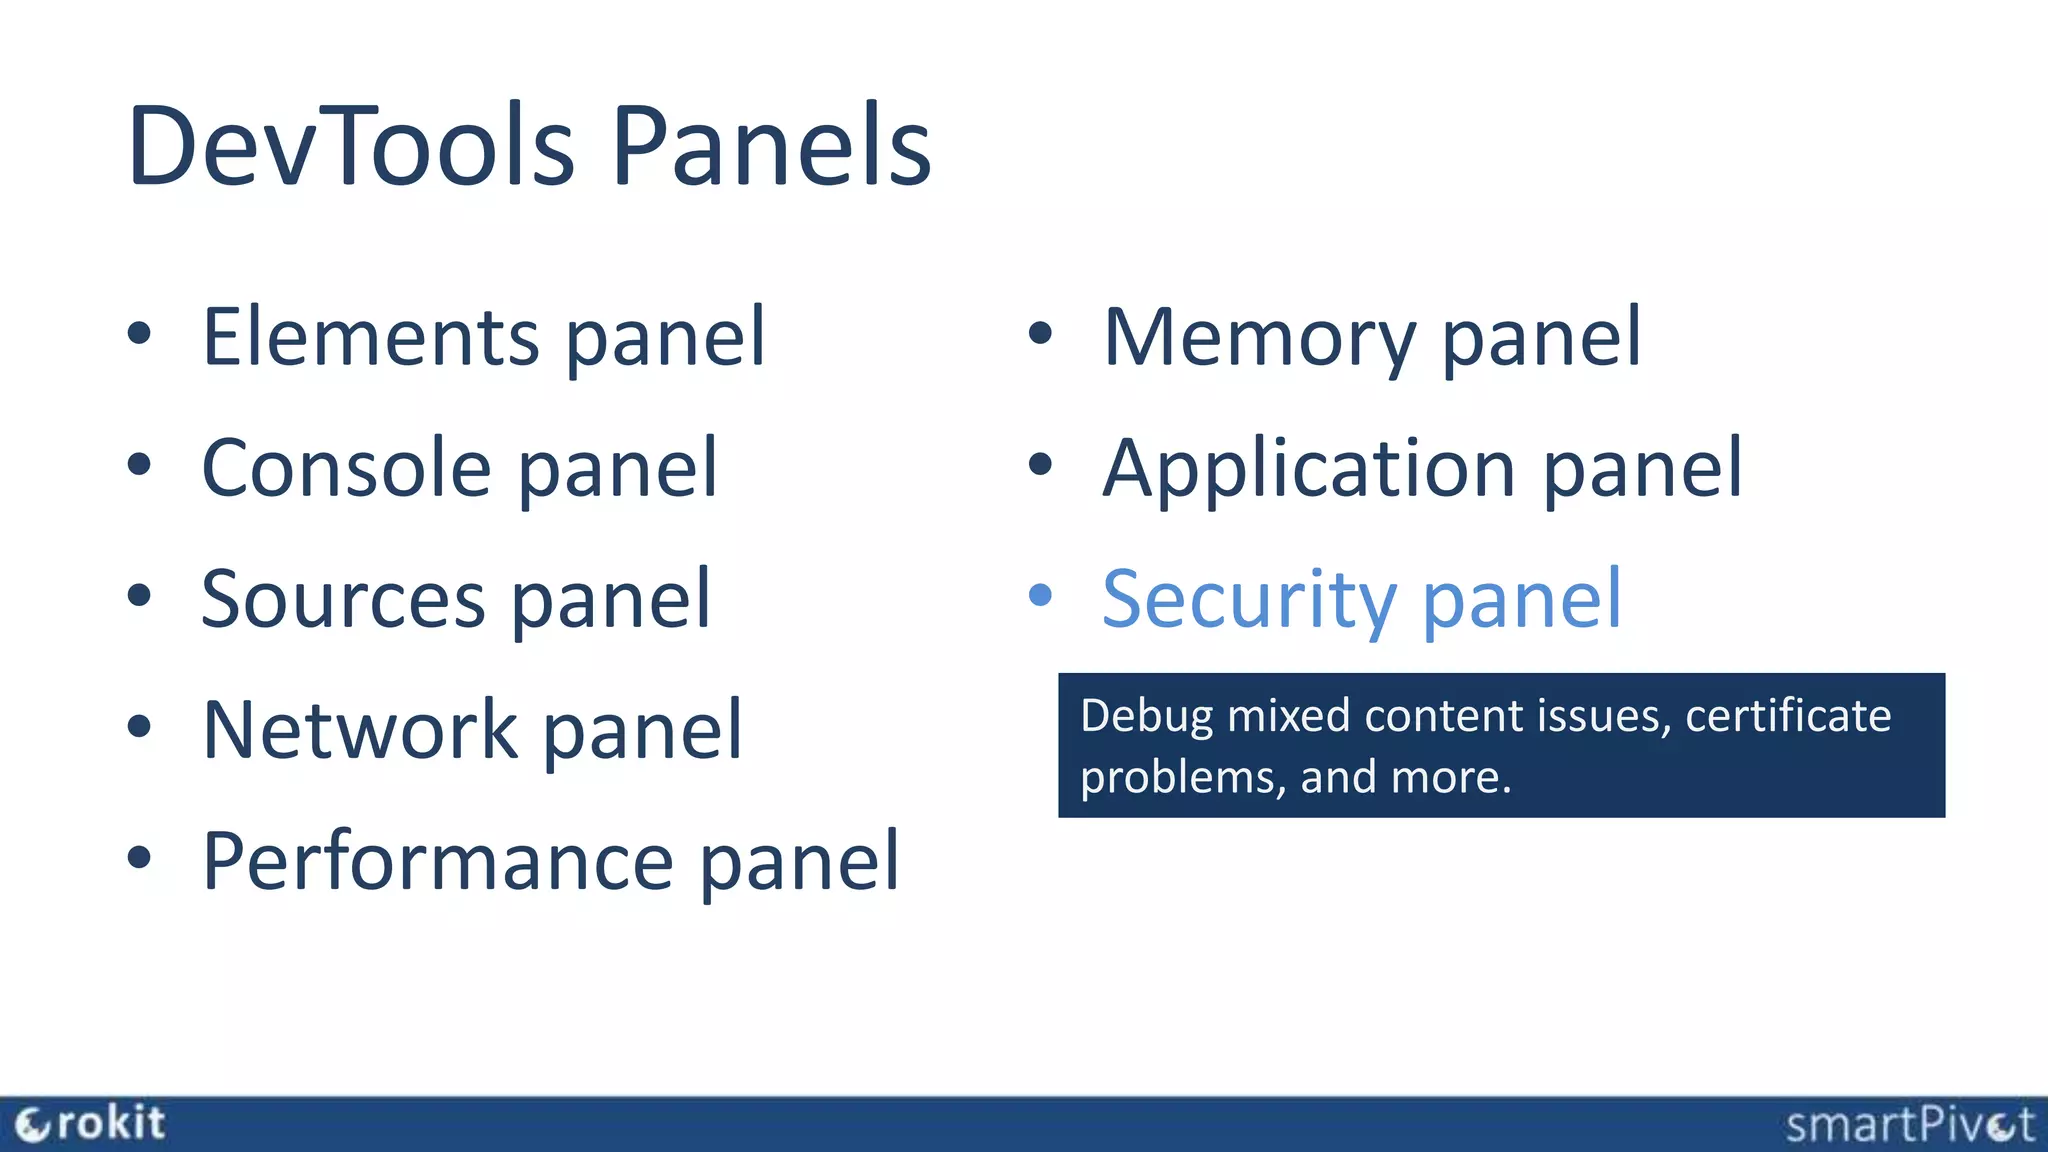
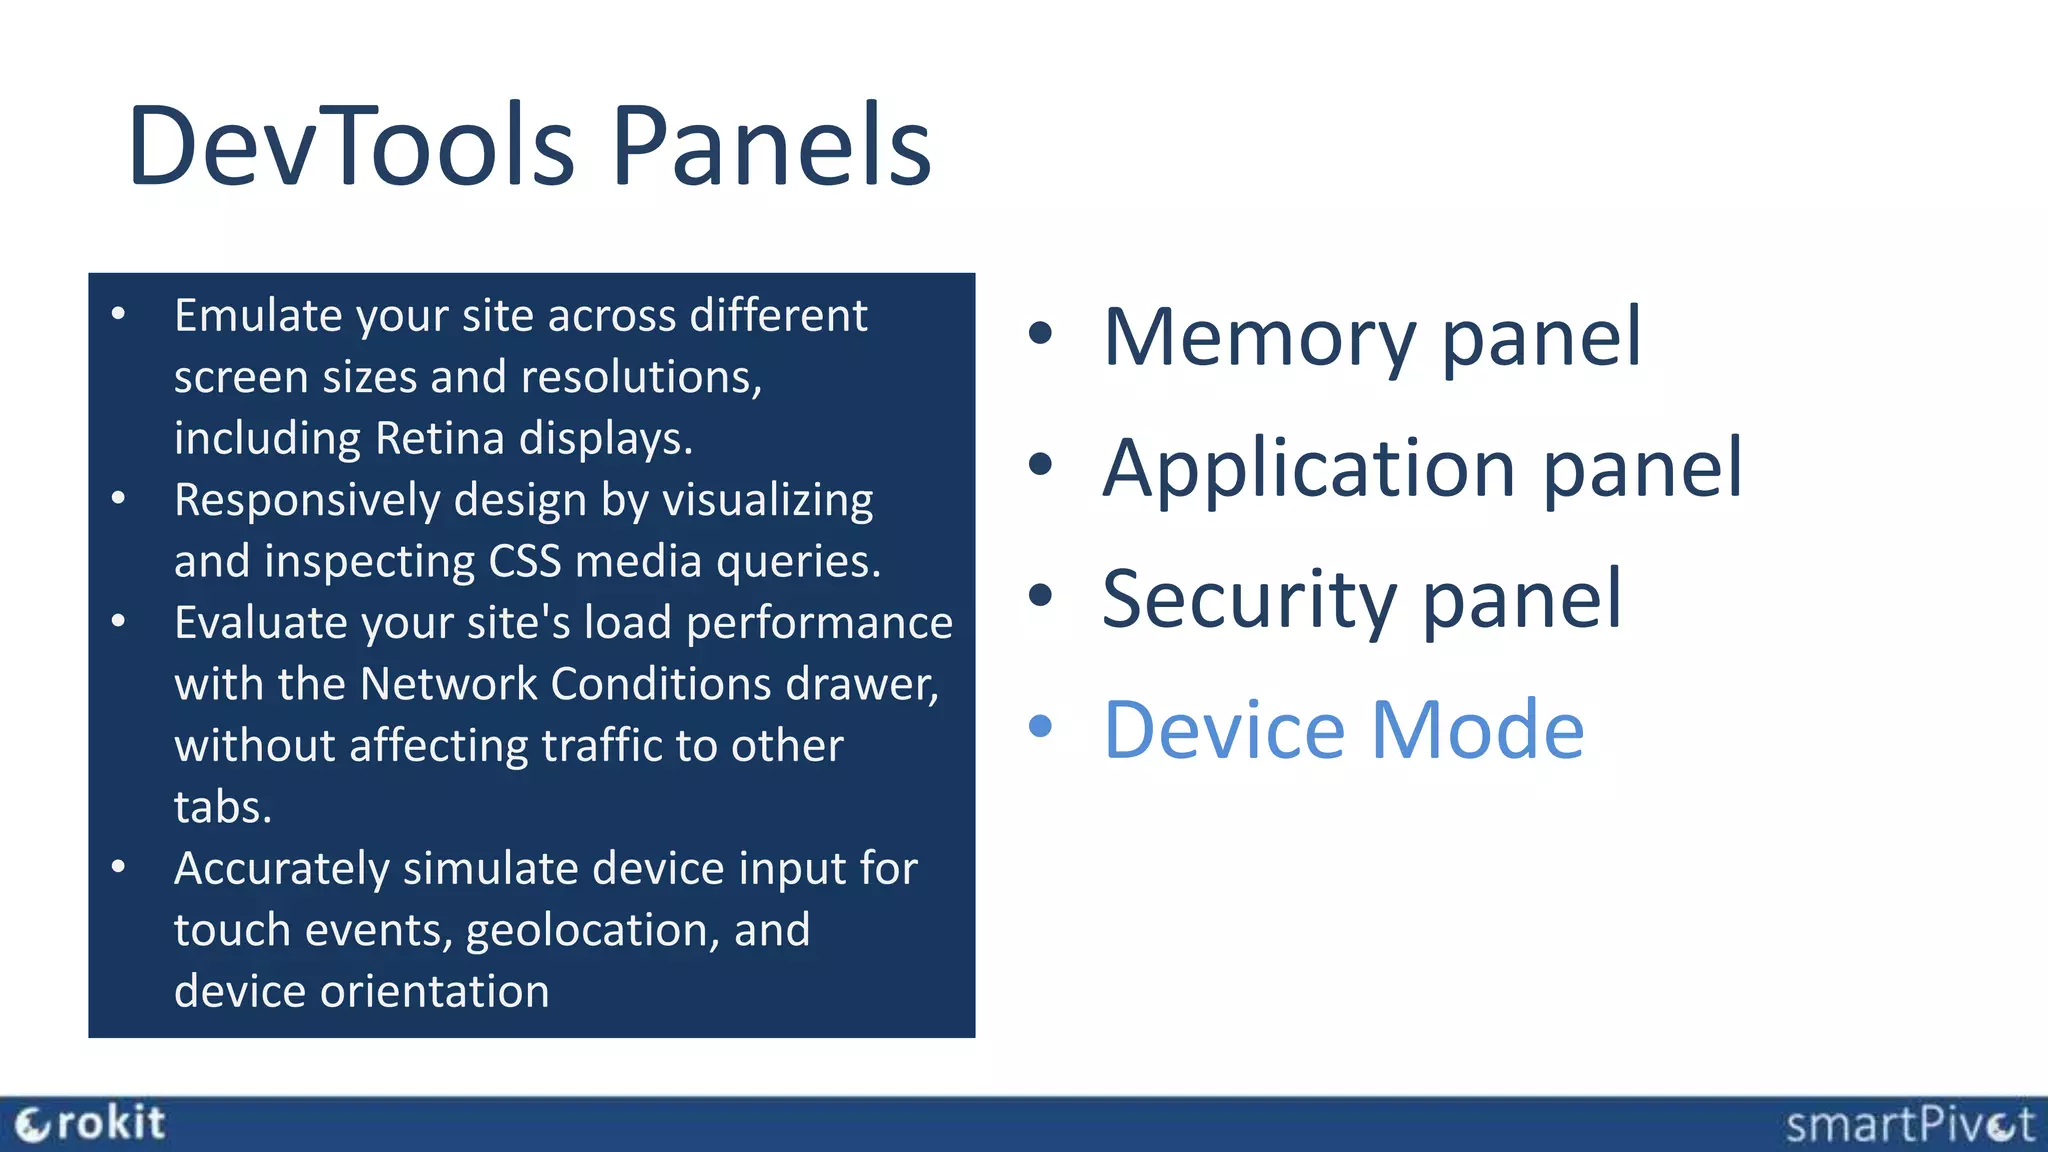
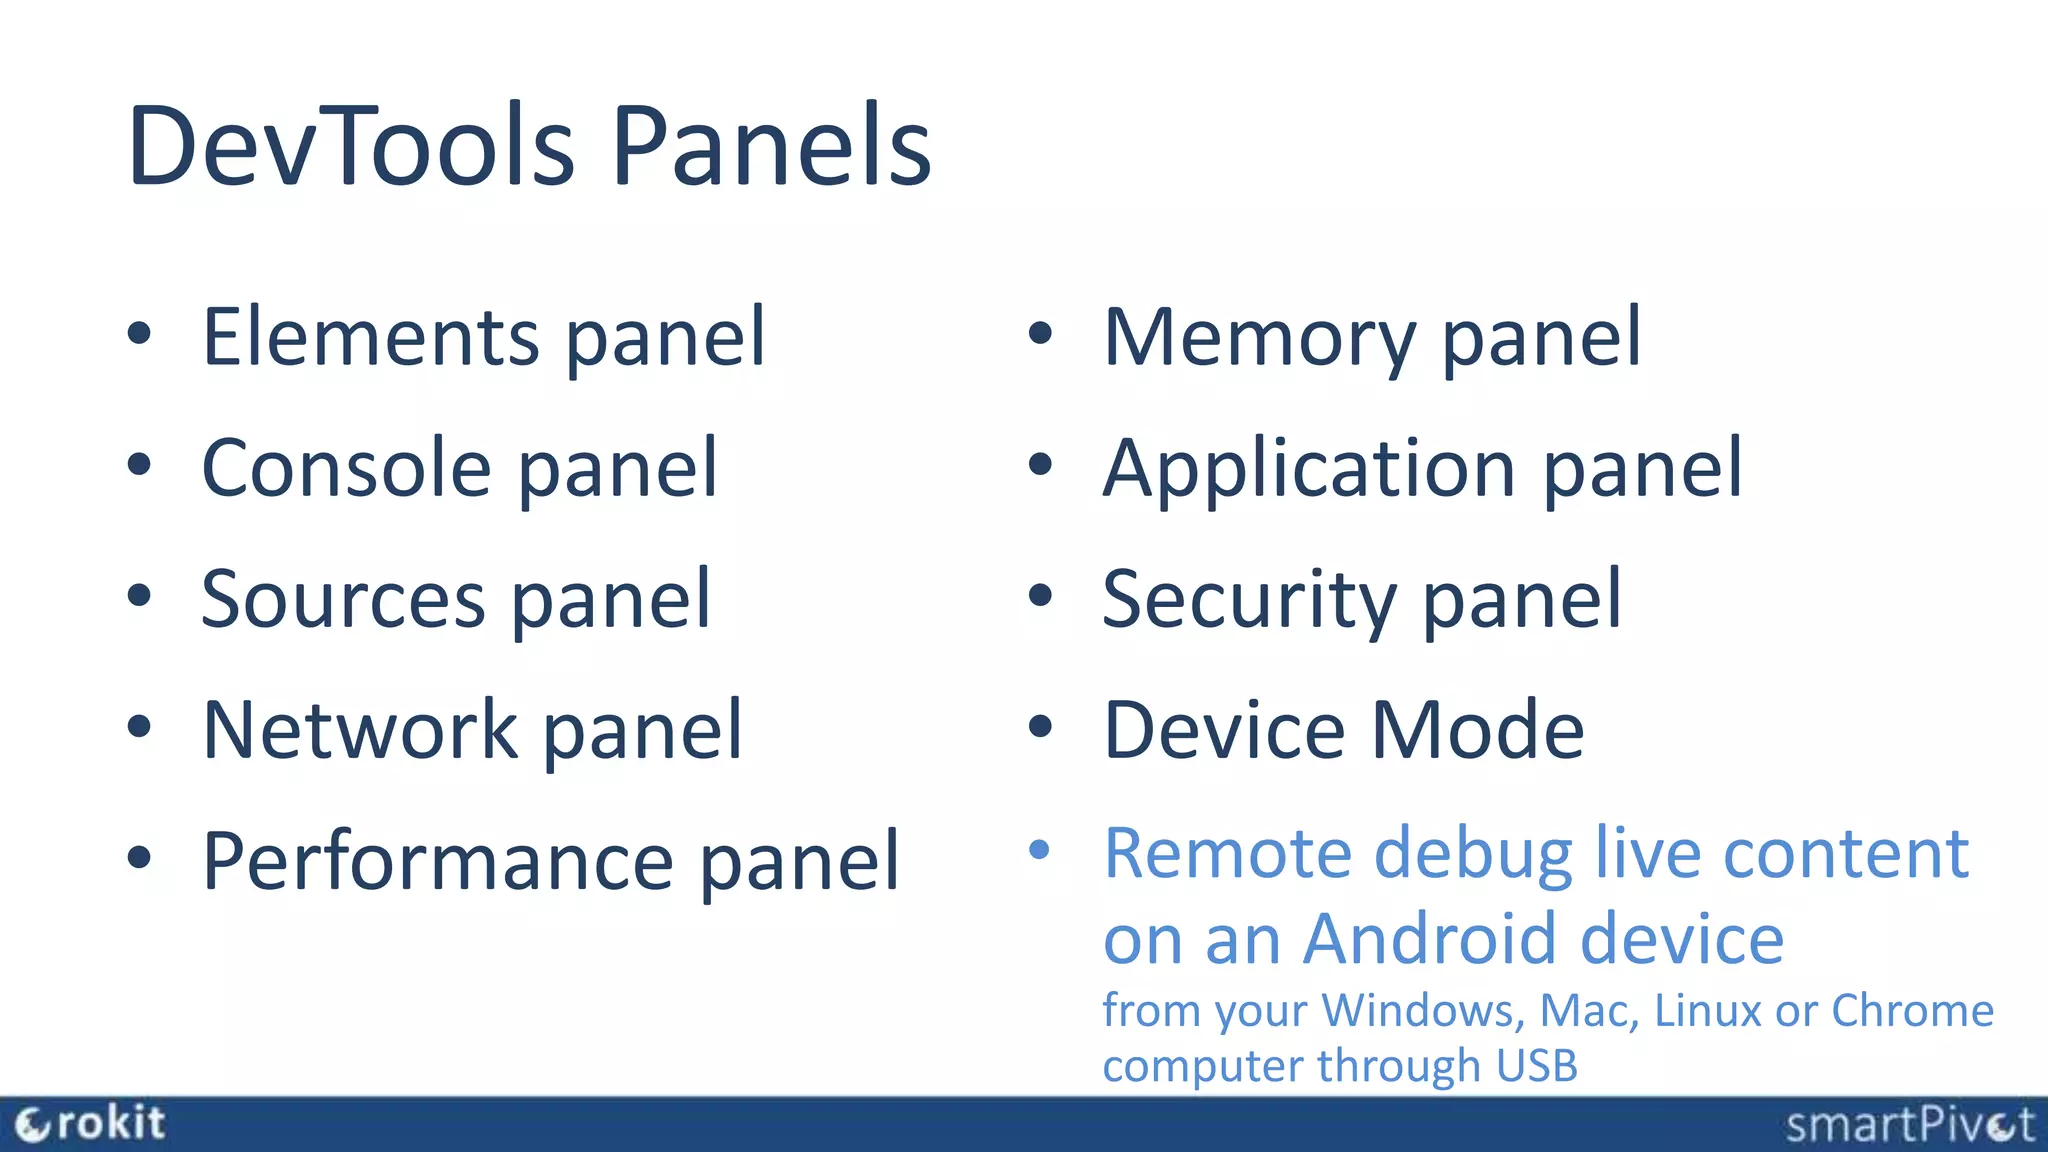
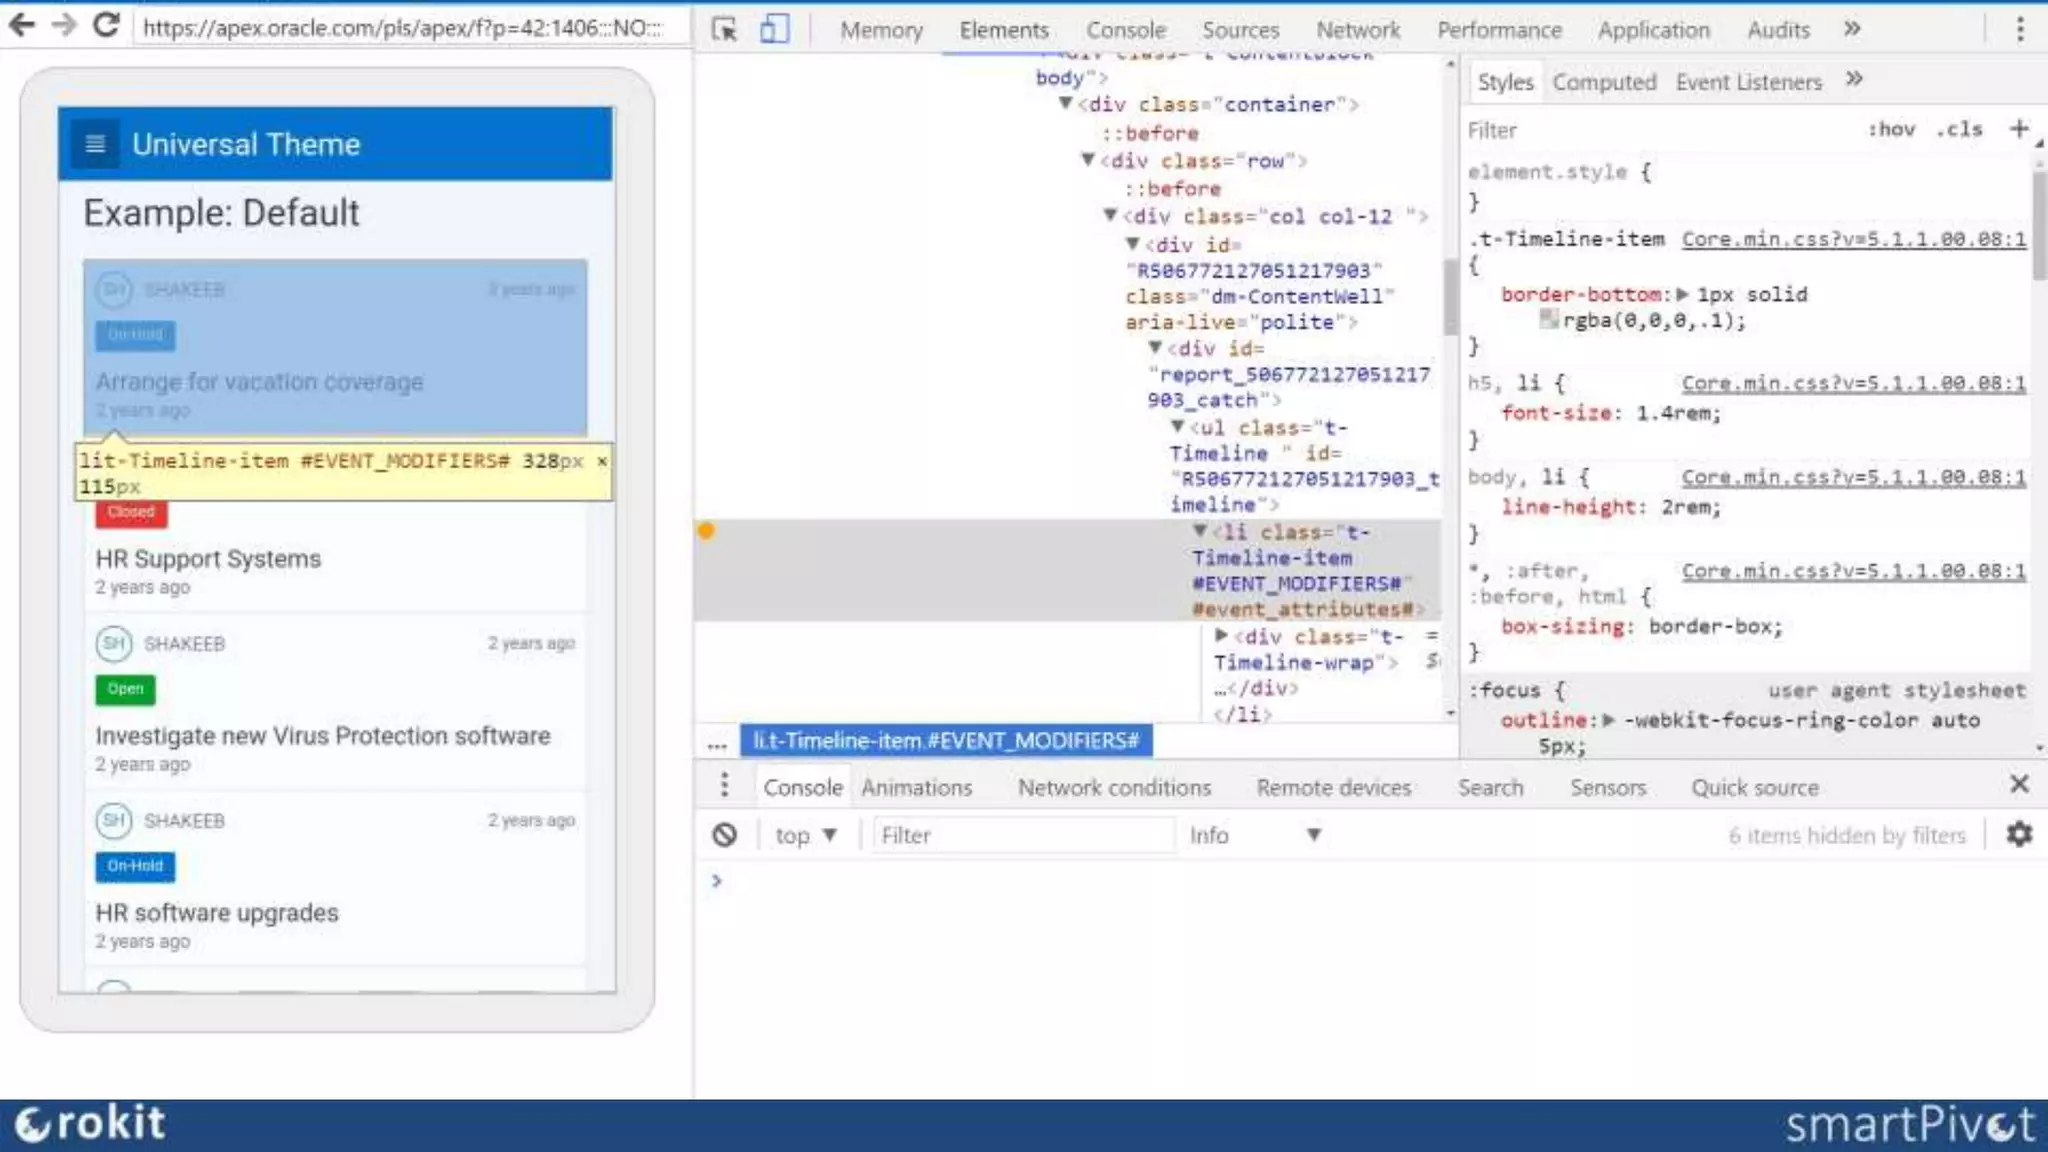
Browser Developer Tools for APEX Developers Christian Rokitta Berlin 2017
1993 today 1996 1999 2009 20152010 2011 2014 Oracle Database Version 6 Hoechst AG Clinical Research Frankfurt, Germany Custom Development Utrecht, Netherlands <HTML> Oracle Consultant/Product Development Manager Utrecht, Netherlands mod_plsql Oracle Web Toolkit JavaScript(); HTML DB APEX Speaker Oracle Database & Application Express Consultant Utrecht, Netherlands {CSS} proud member of APEX UI Customization Reporting Plug-in Christian Rokitta
Oracle APEX Architecture Browser Mid Tier Database Tier Oracle APEX Engine Oracle Database Data Schemas App Development IDE is a web browser. No client software needed
IDE’s for Oracle Database • Develop • Testing • Debug • Tuning • Formatting • … PLSQL Developer TOAD SQL DeveloperSQL*Plus
Additional Skillset for APEX Developers
Evolution of the Internet
Evolution of the Internet http://like.allmyfaves.com/like/site/name/evolutionofweb.appspot.com
Desktop Browser Market Share Worldwide Jan to Dec 2009
Desktop Browser Market Share Worldwide Jan to Dec 2013
Desktop Browser Market Share Worldwide Apr 2016 to Apr 2017
Real Users vs Geeks aka End Users vs Developers
Browser Developer Tools Overview Chrome Internet Explorer/Edge macOS only same engine as Chrome(Canary)
How to open the DevTools • Select More Tools > Developer Tools from Chrome's Main Menu. • Right-click a page element and select Inspect. • Press Command+Option+I (Mac) or Control+Shift+I (Windows, Linux). • F12
DevTools Panels • Elements panel Iterate on the layout and design of your site by freely manipulating the DOM and CSS. • Inspect and Tweak Your Pages • Edit Styles • Edit the DOM • Inspect Animations
Tips & Tricks Styling :active, :hover, :focus, :visited states It becomes a little more tricky when testing other element states such as hover. Solution: Chrome has a button built for this purpose. In the "Elements" tab's right hand column look for the dotted element/cursor icon which allows you to switch an elements states. Incrementing CSS Values If you have an element which you need to modify the margin, padding, width or height for, you can use the cursor keys to increment/decrement the size. Simply use the up and down cursor keys to increment/decrement by a unit of 1. Find in Styles While inspecting the CSS style rules for an element on a page with a lot of styles, you might get frustrated. However, you can filter the style rules easily!
DevTools Panels • Elements panel • Console panel Log diagnostic information during development or interact with the JavaScript on the page. • Using the Console • Interact from Command Line
Tips & Tricks Snippets Snippets allow you to write multi-line JavaScript code, save them in the dev tools memory (they are preserved forever, until you delete them), have a git style version history. Inspecting <iframes> from the console If one of your scripts are in an iframe, which you wish to inspect in the console, you might find that directly typing the variable names defined for the iframe won’t work. You can change the window frame you are inspecting from the console!
Tips & Tricks The console API The console has a very nice API. Here are 5 quick tips for the Chrome Web Console: • $ is an alias to document.querySelector, and $$ is an alias to document.querySelectorAll. • $0, $1... $4 give reference to the last 4 DOM elements selected from the DOM inspector. (So when you have to select an element, right click, and inspect element, then type $0 in the console!) • $_ holds the value for the last expression evaluated in the console. Useful when you are running a lot of expressions simultaneously. • debug(function), typing this in the console would watch for the function passed as the first parameter to be called. When it is called, the debugger will be invoked, and the script would be paused. • getEventListeners(domElement) would list all the event listeners attached to the DOM element.
DevTools Panels • Elements panel • Console panel • Sources panel Debug your JavaScript using breakpoints or connect your local files via Workspaces to use DevTools as a code editor. • Debugging JavaScript • Pause Your Code With Breakpoints • DevTools Workspaces • Source mapping
DevTools Panels • Elements panel • Console panel • Sources panel • Network panel Inspect page load performance and debug request issues.
DevTools Panels • Elements panel • Console panel • Sources panel • Network panel • Performance panel Improve the runtime performance of your page by recording and exploring the various events that happen during the lifecycle of a site.
DevTools Panels • Elements panel • Console panel • Sources panel • Network panel • Performance panel • Memory panel Profile memory usage and track down leaks. • Identify Memory Problems • JavaScript CPU Profiler
DevTools Panels • Elements panel • Console panel • Sources panel • Network panel • Performance panel • Memory panel • Application panel Inspect all resources that are loaded, including IndexedDB or Web SQL databases, local and session storage, cookies, Application Cache, images, fonts, and stylesheets.
DevTools Panels • Elements panel • Console panel • Sources panel • Network panel • Performance panel • Memory panel • Application panel • Security panel Debug mixed content issues, certificate problems, and more.
DevTools Panels • Elements panel • Console panel • Sources panel • Network panel • Performance panel • Memory panel • Application panel • Security panel • Device Mode • Emulate your site across different screen sizes and resolutions, including Retina displays. • Responsively design by visualizing and inspecting CSS media queries. • Evaluate your site's load performance with the Network Conditions drawer, without affecting traffic to other tabs. • Accurately simulate device input for touch events, geolocation, and device orientation
DevTools Panels • Elements panel • Console panel • Sources panel • Network panel • Performance panel • Memory panel • Application panel • Security panel • Device Mode • Remote debug live content on an Android device from your Windows, Mac, Linux or Chrome computer through USB
Conclusion The dev tools are really very powerful and provide a great, open playground for beginners to learn, speculate, experiment, and think. If you are a beginner, make yourself comfortable with the dev- tools from the start. It would help you in your due course of learning JavaScript, as well as HTML and CSS.
Q&A www.rokit.nl www.themes4apex.com www.apexsmartpivot.com blog.rokit.nl @crokitta @themes4apex @apexsmartpivot www.linkedin.com/in/rokit

Browser Developer Tools for APEX Developers

  • 1.
    Browser Developer Tools forAPEX Developers Christian Rokitta Berlin 2017
  • 2.
    1993 today 1996 1999 200920152010 2011 2014 Oracle Database Version 6 Hoechst AG Clinical Research Frankfurt, Germany Custom Development Utrecht, Netherlands <HTML> Oracle Consultant/Product Development Manager Utrecht, Netherlands mod_plsql Oracle Web Toolkit JavaScript(); HTML DB APEX Speaker Oracle Database & Application Express Consultant Utrecht, Netherlands {CSS} proud member of APEX UI Customization Reporting Plug-in Christian Rokitta
  • 3.
    Oracle APEX Architecture BrowserMid Tier Database Tier Oracle APEX Engine Oracle Database Data Schemas App Development IDE is a web browser. No client software needed
  • 4.
    IDE’s for OracleDatabase • Develop • Testing • Debug • Tuning • Formatting • … PLSQL Developer TOAD SQL DeveloperSQL*Plus
  • 5.
    Additional Skillset forAPEX Developers
  • 6.
  • 7.
    Evolution of theInternet http://like.allmyfaves.com/like/site/name/evolutionofweb.appspot.com
  • 8.
    Desktop Browser MarketShare Worldwide Jan to Dec 2009
  • 9.
    Desktop Browser MarketShare Worldwide Jan to Dec 2013
  • 10.
    Desktop Browser MarketShare Worldwide Apr 2016 to Apr 2017
  • 11.
    Real Users vsGeeks aka End Users vs Developers
  • 12.
    Browser Developer Tools Overview Chrome InternetExplorer/Edge macOS only same engine as Chrome(Canary)
  • 13.
    How to openthe DevTools • Select More Tools > Developer Tools from Chrome's Main Menu. • Right-click a page element and select Inspect. • Press Command+Option+I (Mac) or Control+Shift+I (Windows, Linux). • F12
  • 15.
    DevTools Panels • Elementspanel Iterate on the layout and design of your site by freely manipulating the DOM and CSS. • Inspect and Tweak Your Pages • Edit Styles • Edit the DOM • Inspect Animations
  • 16.
    Tips & Tricks Styling:active, :hover, :focus, :visited states It becomes a little more tricky when testing other element states such as hover. Solution: Chrome has a button built for this purpose. In the "Elements" tab's right hand column look for the dotted element/cursor icon which allows you to switch an elements states. Incrementing CSS Values If you have an element which you need to modify the margin, padding, width or height for, you can use the cursor keys to increment/decrement the size. Simply use the up and down cursor keys to increment/decrement by a unit of 1. Find in Styles While inspecting the CSS style rules for an element on a page with a lot of styles, you might get frustrated. However, you can filter the style rules easily!
  • 17.
    DevTools Panels • Elementspanel • Console panel Log diagnostic information during development or interact with the JavaScript on the page. • Using the Console • Interact from Command Line
  • 18.
    Tips & Tricks Snippets Snippetsallow you to write multi-line JavaScript code, save them in the dev tools memory (they are preserved forever, until you delete them), have a git style version history. Inspecting <iframes> from the console If one of your scripts are in an iframe, which you wish to inspect in the console, you might find that directly typing the variable names defined for the iframe won’t work. You can change the window frame you are inspecting from the console!
  • 19.
    Tips & Tricks Theconsole API The console has a very nice API. Here are 5 quick tips for the Chrome Web Console: • $ is an alias to document.querySelector, and $$ is an alias to document.querySelectorAll. • $0, $1... $4 give reference to the last 4 DOM elements selected from the DOM inspector. (So when you have to select an element, right click, and inspect element, then type $0 in the console!) • $_ holds the value for the last expression evaluated in the console. Useful when you are running a lot of expressions simultaneously. • debug(function), typing this in the console would watch for the function passed as the first parameter to be called. When it is called, the debugger will be invoked, and the script would be paused. • getEventListeners(domElement) would list all the event listeners attached to the DOM element.
  • 20.
    DevTools Panels • Elementspanel • Console panel • Sources panel Debug your JavaScript using breakpoints or connect your local files via Workspaces to use DevTools as a code editor. • Debugging JavaScript • Pause Your Code With Breakpoints • DevTools Workspaces • Source mapping
  • 21.
    DevTools Panels • Elementspanel • Console panel • Sources panel • Network panel Inspect page load performance and debug request issues.
  • 22.
    DevTools Panels • Elementspanel • Console panel • Sources panel • Network panel • Performance panel Improve the runtime performance of your page by recording and exploring the various events that happen during the lifecycle of a site.
  • 23.
    DevTools Panels • Elementspanel • Console panel • Sources panel • Network panel • Performance panel • Memory panel Profile memory usage and track down leaks. • Identify Memory Problems • JavaScript CPU Profiler
  • 24.
    DevTools Panels • Elementspanel • Console panel • Sources panel • Network panel • Performance panel • Memory panel • Application panel Inspect all resources that are loaded, including IndexedDB or Web SQL databases, local and session storage, cookies, Application Cache, images, fonts, and stylesheets.
  • 25.
    DevTools Panels • Elementspanel • Console panel • Sources panel • Network panel • Performance panel • Memory panel • Application panel • Security panel Debug mixed content issues, certificate problems, and more.
  • 26.
    DevTools Panels • Elementspanel • Console panel • Sources panel • Network panel • Performance panel • Memory panel • Application panel • Security panel • Device Mode • Emulate your site across different screen sizes and resolutions, including Retina displays. • Responsively design by visualizing and inspecting CSS media queries. • Evaluate your site's load performance with the Network Conditions drawer, without affecting traffic to other tabs. • Accurately simulate device input for touch events, geolocation, and device orientation
  • 27.
    DevTools Panels • Elementspanel • Console panel • Sources panel • Network panel • Performance panel • Memory panel • Application panel • Security panel • Device Mode • Remote debug live content on an Android device from your Windows, Mac, Linux or Chrome computer through USB
  • 29.
    Conclusion The dev toolsare really very powerful and provide a great, open playground for beginners to learn, speculate, experiment, and think. If you are a beginner, make yourself comfortable with the dev- tools from the start. It would help you in your due course of learning JavaScript, as well as HTML and CSS.
  • 30.

Editor's Notes

  • #4 The Oracle Application Express architecture requires some form of Web server to proxy requests between a client Web browser and the Oracle Application Express engine. The Web server options include: Oracle REST Data Services: Oracle REST Data Services (ORDS) is a Java based, free tool that is fully supported when used with Oracle WebLogic Server, Oracle Glassfish Server, and Tomcat. Embedded PL/SQL Gateway: The Embedded PL/SQL Gateway (EPG) runs in the Oracle XML DB Protocol Server within the Oracle Database and includes the core features of mod_plsql. Oracle HTTP Server: The Oracle HTTP Server (Apache) with mod_plsql plugin can be placed on the same physical machine as the database, or on a separate physical machine. Please note that mod_plsql is deprecated as of Oracle HTTP Server 12c (12.1.3).