![Refarences International Conference on Smart Computing and Electronic Enterprise, (ICSCEE2018) ©2018 IEEE, Kuala Lumpur, Malaysia - July, 2018 1. H. Jagadish, J. Gehrke, A. Labrinidis, Y. Papakonstantinou, J. Patel, R. Ramakrishnan and C. Shahabi, "Big data and its technical challenges", Communications of the ACM, vol. 57, no. 7, pp. 86-94, 2014. 2. D. Keim, H. Qu and K. Ma, "Big-Data Visualization", IEEE Computer Graphics and Applications, vol. 33, no. 4, pp. 20-21, 2013. 3. M. Mauri, T. Elli, G. Caviglia, G. Uboldi and M. Azzi, "RAWGraphs", Proceedings of the 12th Biannual Conference on Italian SIGCHI Chapter - CHItaly '17, 2017. 4. W. Yafooz, S. Abidin, N. Omar and S. Hilles, "Interactive Big Data Visualization Model Based on Hot Issues (Online News Articles)", Communications in Computer and Information Science, pp. 89-99, 2016. 5. M. Mani and S. Fei, "Effective Big Data Visualization", Proceedings of the 21st International Database Engineering & Applications Symposium on - IDEAS 2017, 2017. 6. M. FRAMPTON, COMPLETE GUIDE TO OPEN SOURCE BIG DATA STACK. [S.l.]: APRESS, 2017, pp. 295-337. 7. S. Prabhakar and L. Maves, "Big Data Analytics and Visualization: Finance", in Big Data and Visual Analytics, C. Sang and A. Thomas, Ed. Springer, Cham, 2017, pp. 219-229. 8. M. Friendly, S. Dray, H. Wickham, J. Hanley, D. Murphy and P. Li, "HistData: Data Sets from the History of Statistics and Data Visualization [R package HistData version 0.8-2]", Universidad de Costa Rica, 2018. [Online]. Available: http://mirrors.ucr.ac.cr/CRAN/web/packages/HistData/. [Accessed: 03- Mar- 2018]. 9. C. Adams, Learning Python data visualization. Birmingham, England: Packt Publishing, 2014. 10. P. Murrell, R graphics. Boca Raton: CRC Press, 2016. 11. C. Ekstrøm, The R primer, 2nd ed. Boca Raton: Chapman & Hall/CRC, 2017. 12. H. Wickham and C. Sievert, Ggplot2:Elegant Graphics for Data Analysis, 2nd ed. [Cham]: Springer, 2016. 13. B. Granger and J. VanderPlas, "Altair:Declarative Visualization in Python", Altair 1.3.0.dev0 documentation, 2016. [Online]. Available: https://altair-viz.github.io/index.html. [Accessed: 03- Mar- 2018]. 14. M. Waskom, "seaborn: statistical data visualization", seaborn 0.8.1 documentation, 2017. [Online]. Available: https://seaborn.pydata.org/. [Accessed: 03- Mar- 2018]. 15. S. Bird, L. Canavan, M. Mari, M. Paprocki, P. Rudiger, C. Tang and B. Van de Ven, "Bokeh: Python library for interactive visualization", Bokeh 0.12.14 documentation, 2015. [Online]. Available: https://bokeh.pydata.org/en/latest/. [Accessed: 03- Mar- 20118].](https://image.slidesharecdn.com/bigdatavisualizationallottingbyrandpythonwithguitools-181003123416/75/Big-data-visualization-allotting-by-r-and-python-with-gui-tools-14-2048.jpg)


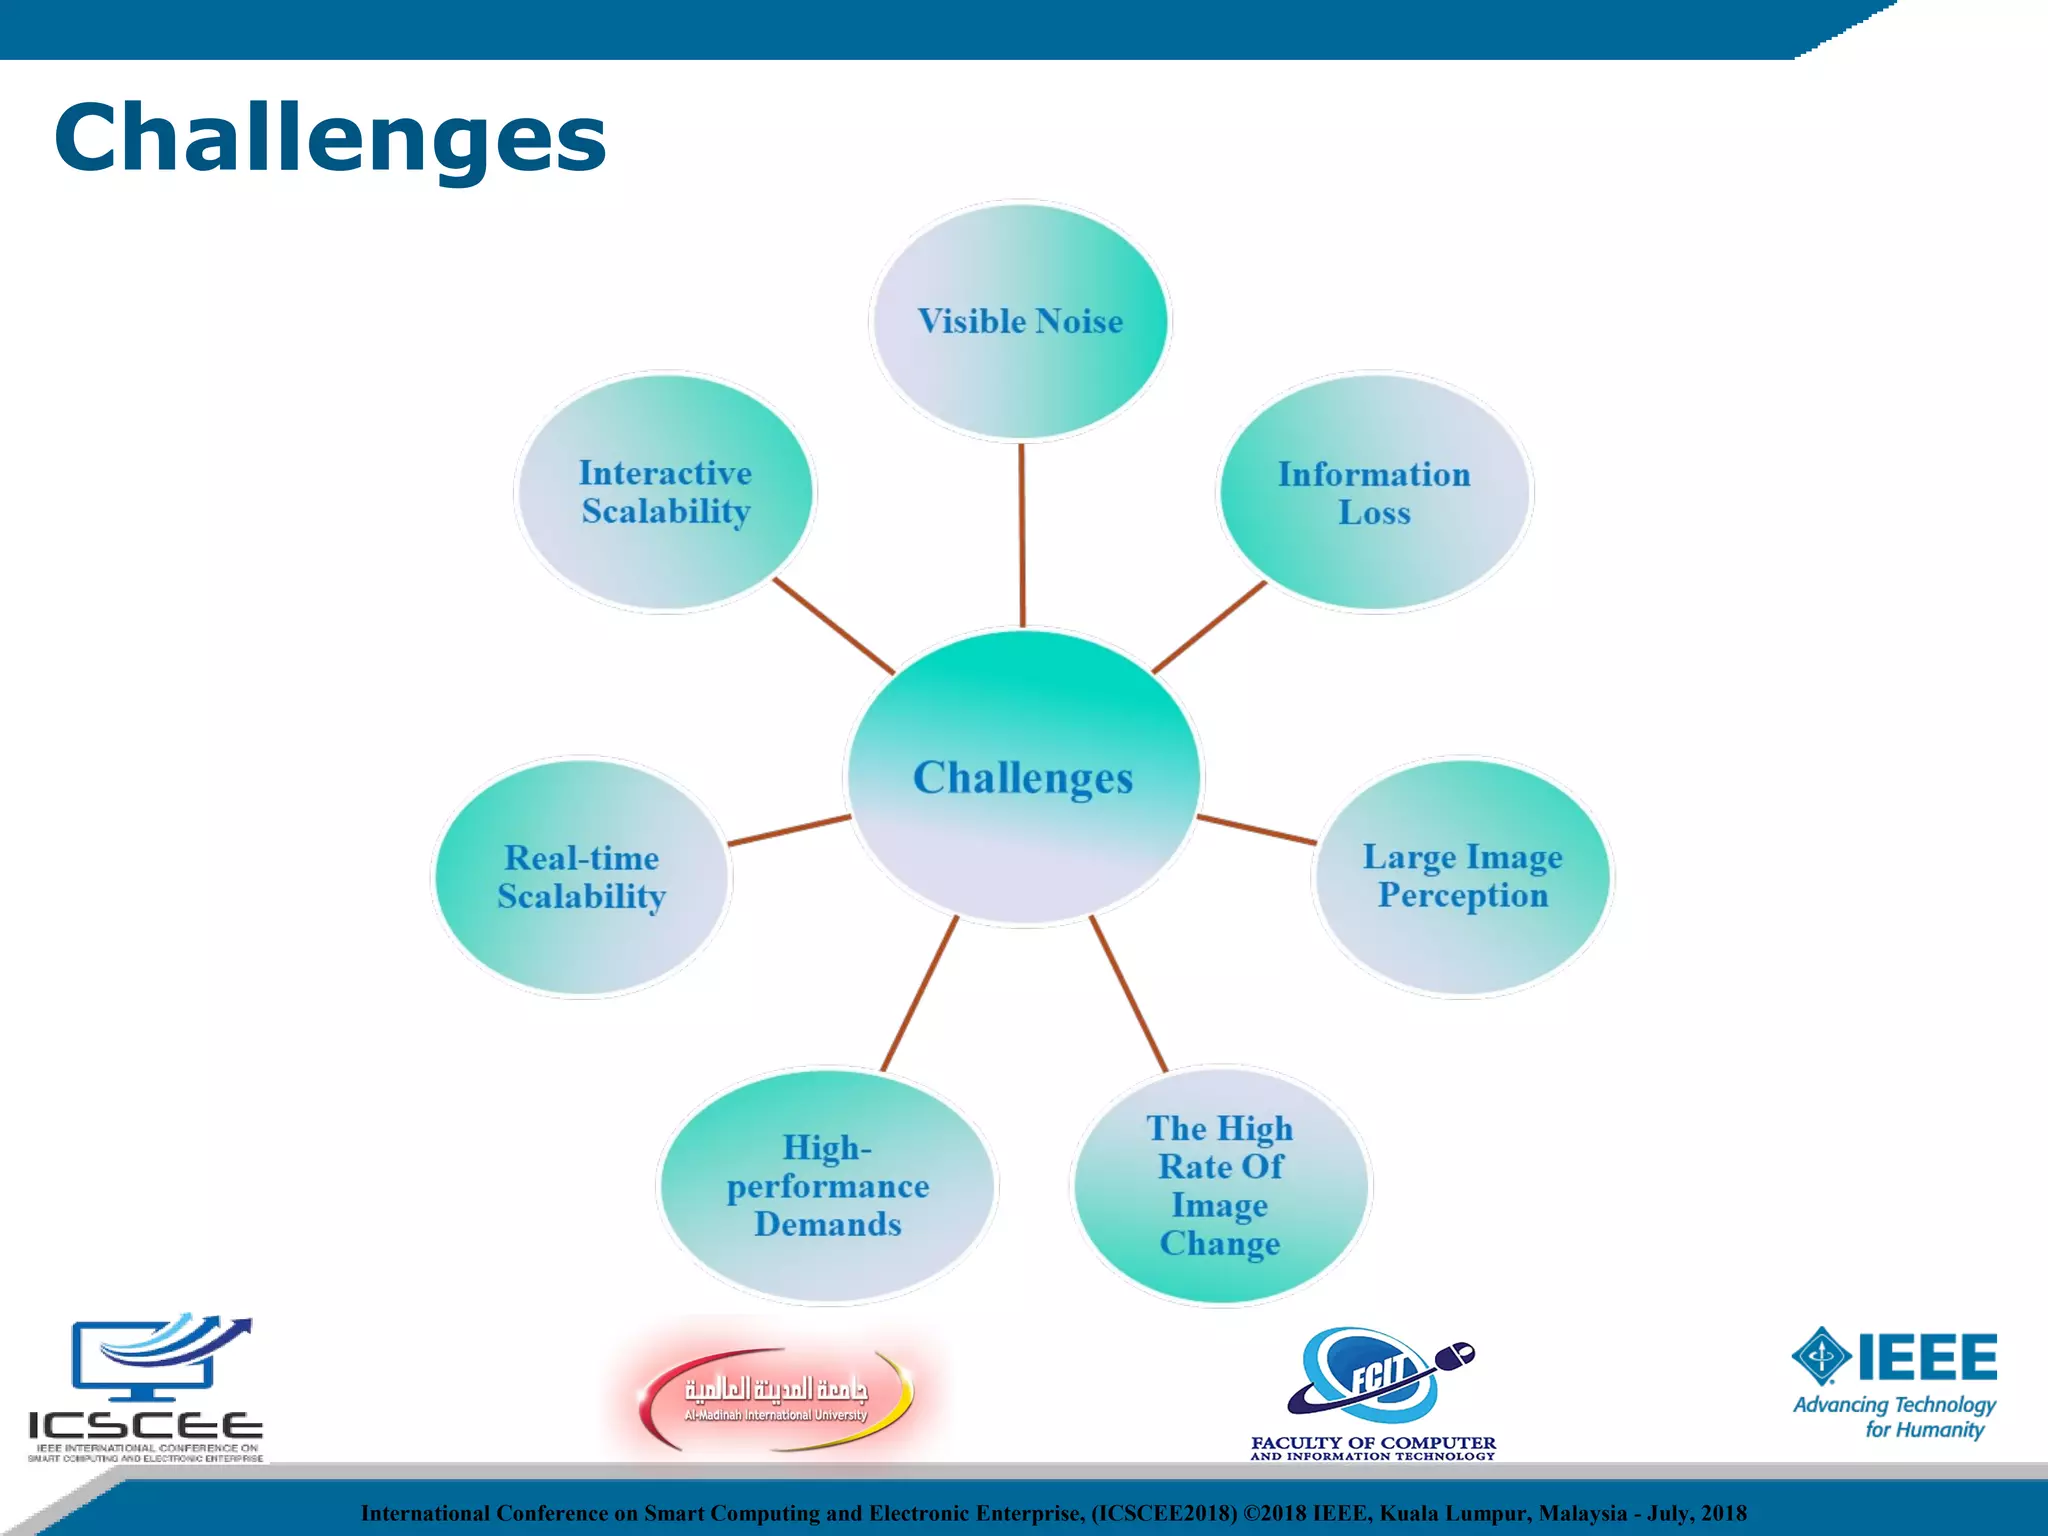
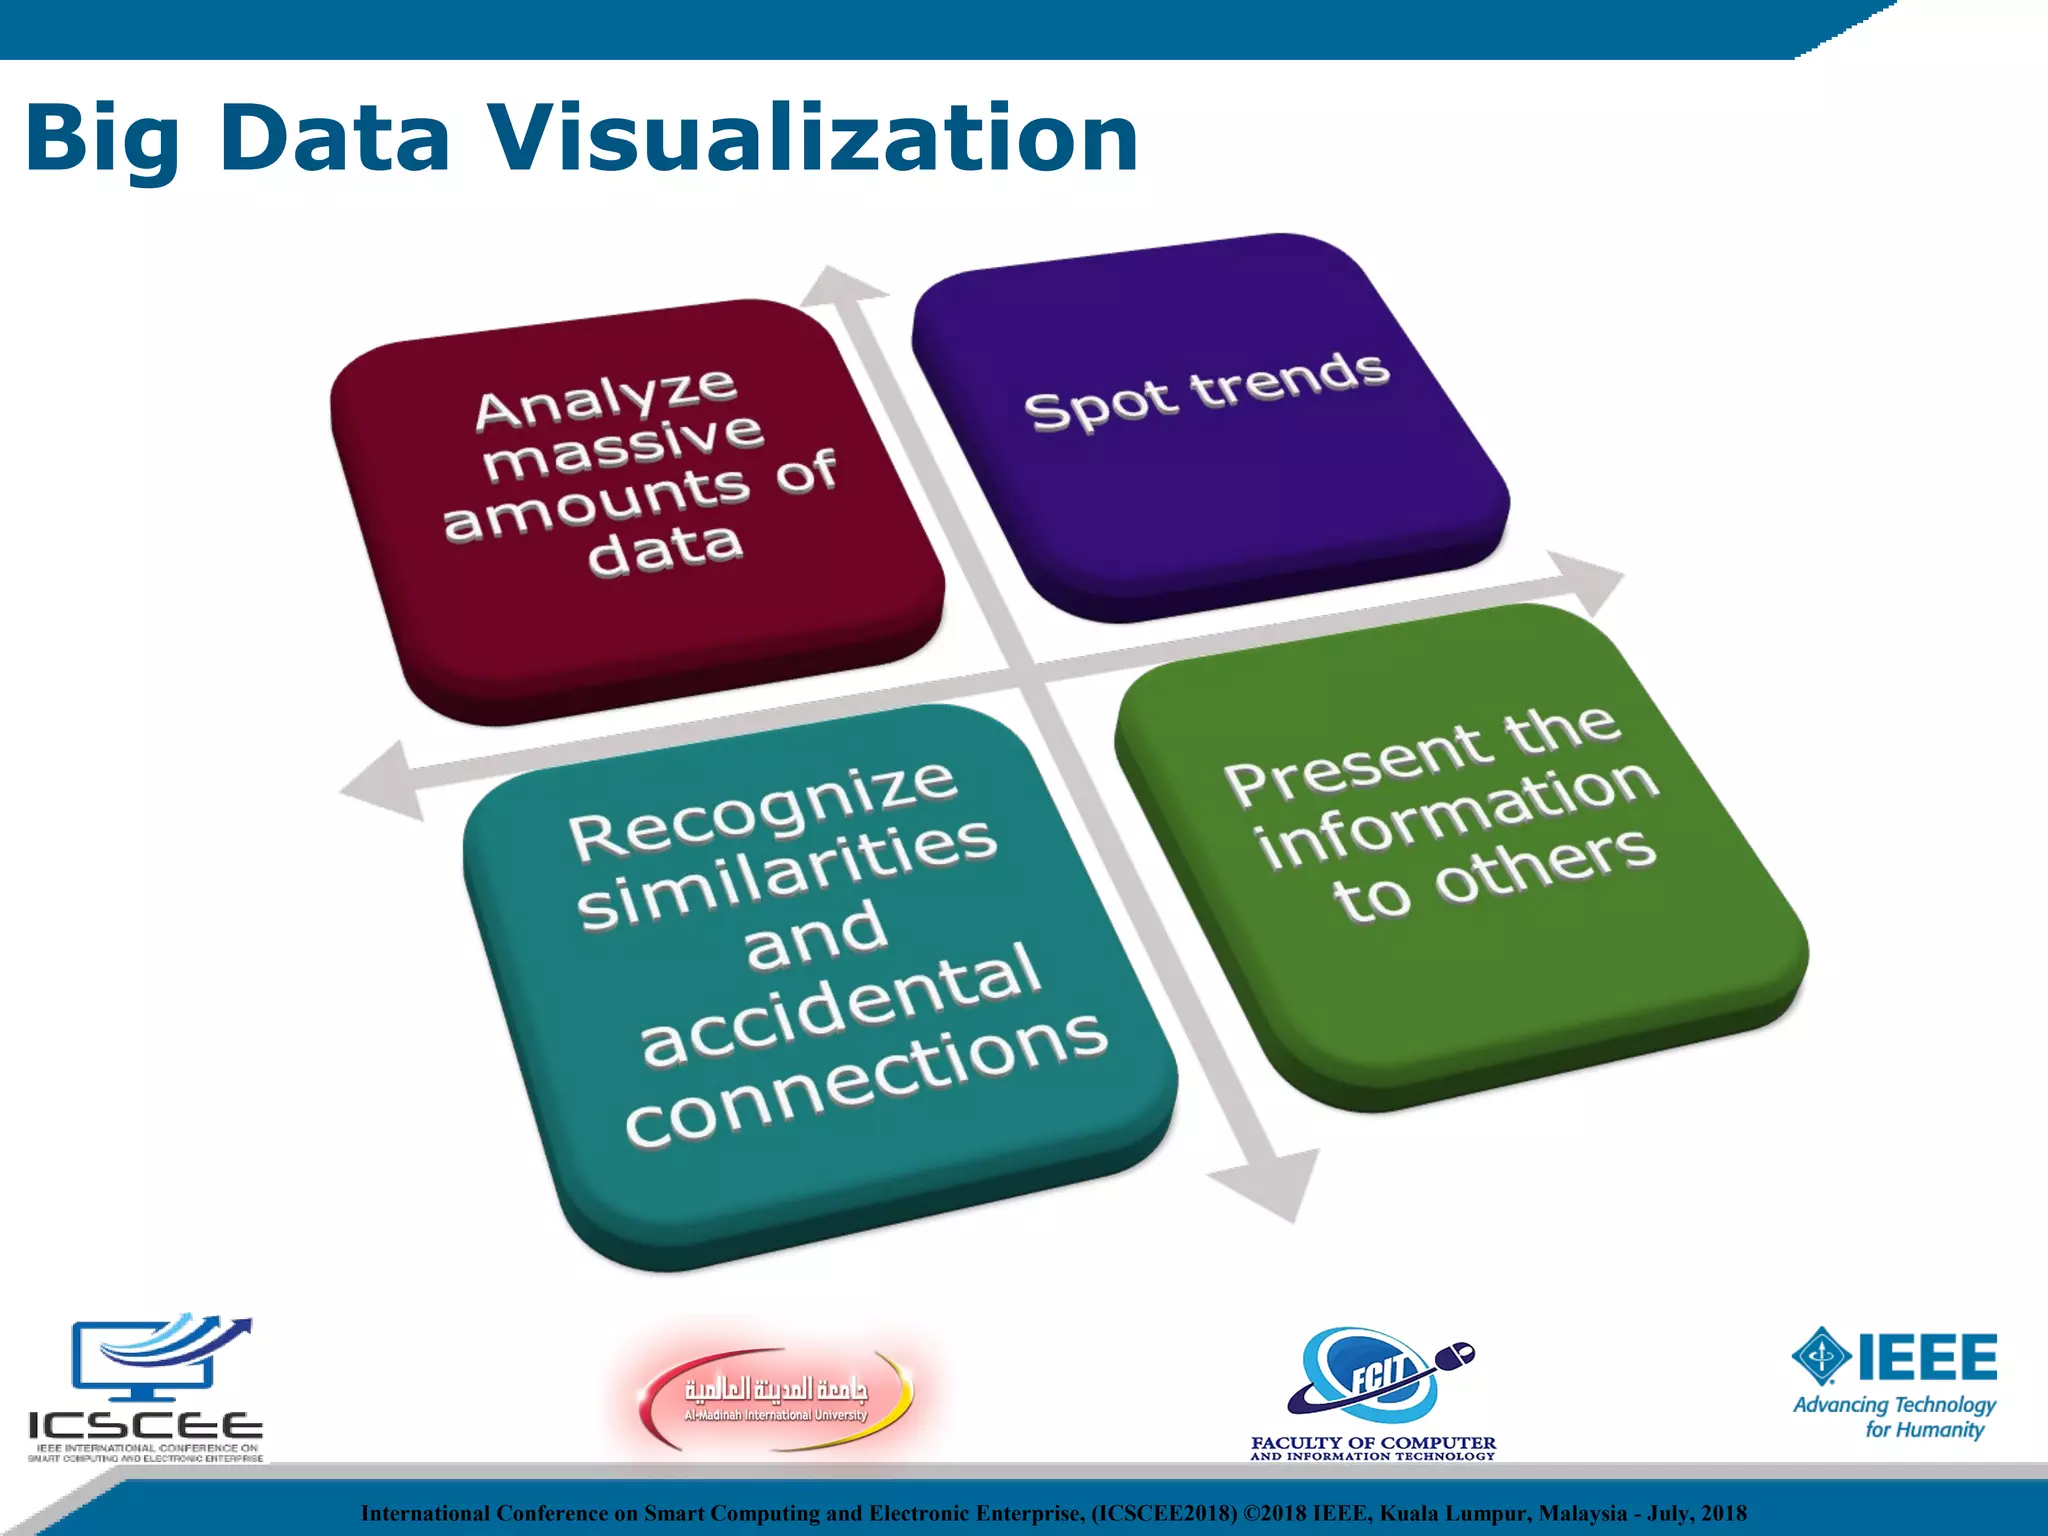
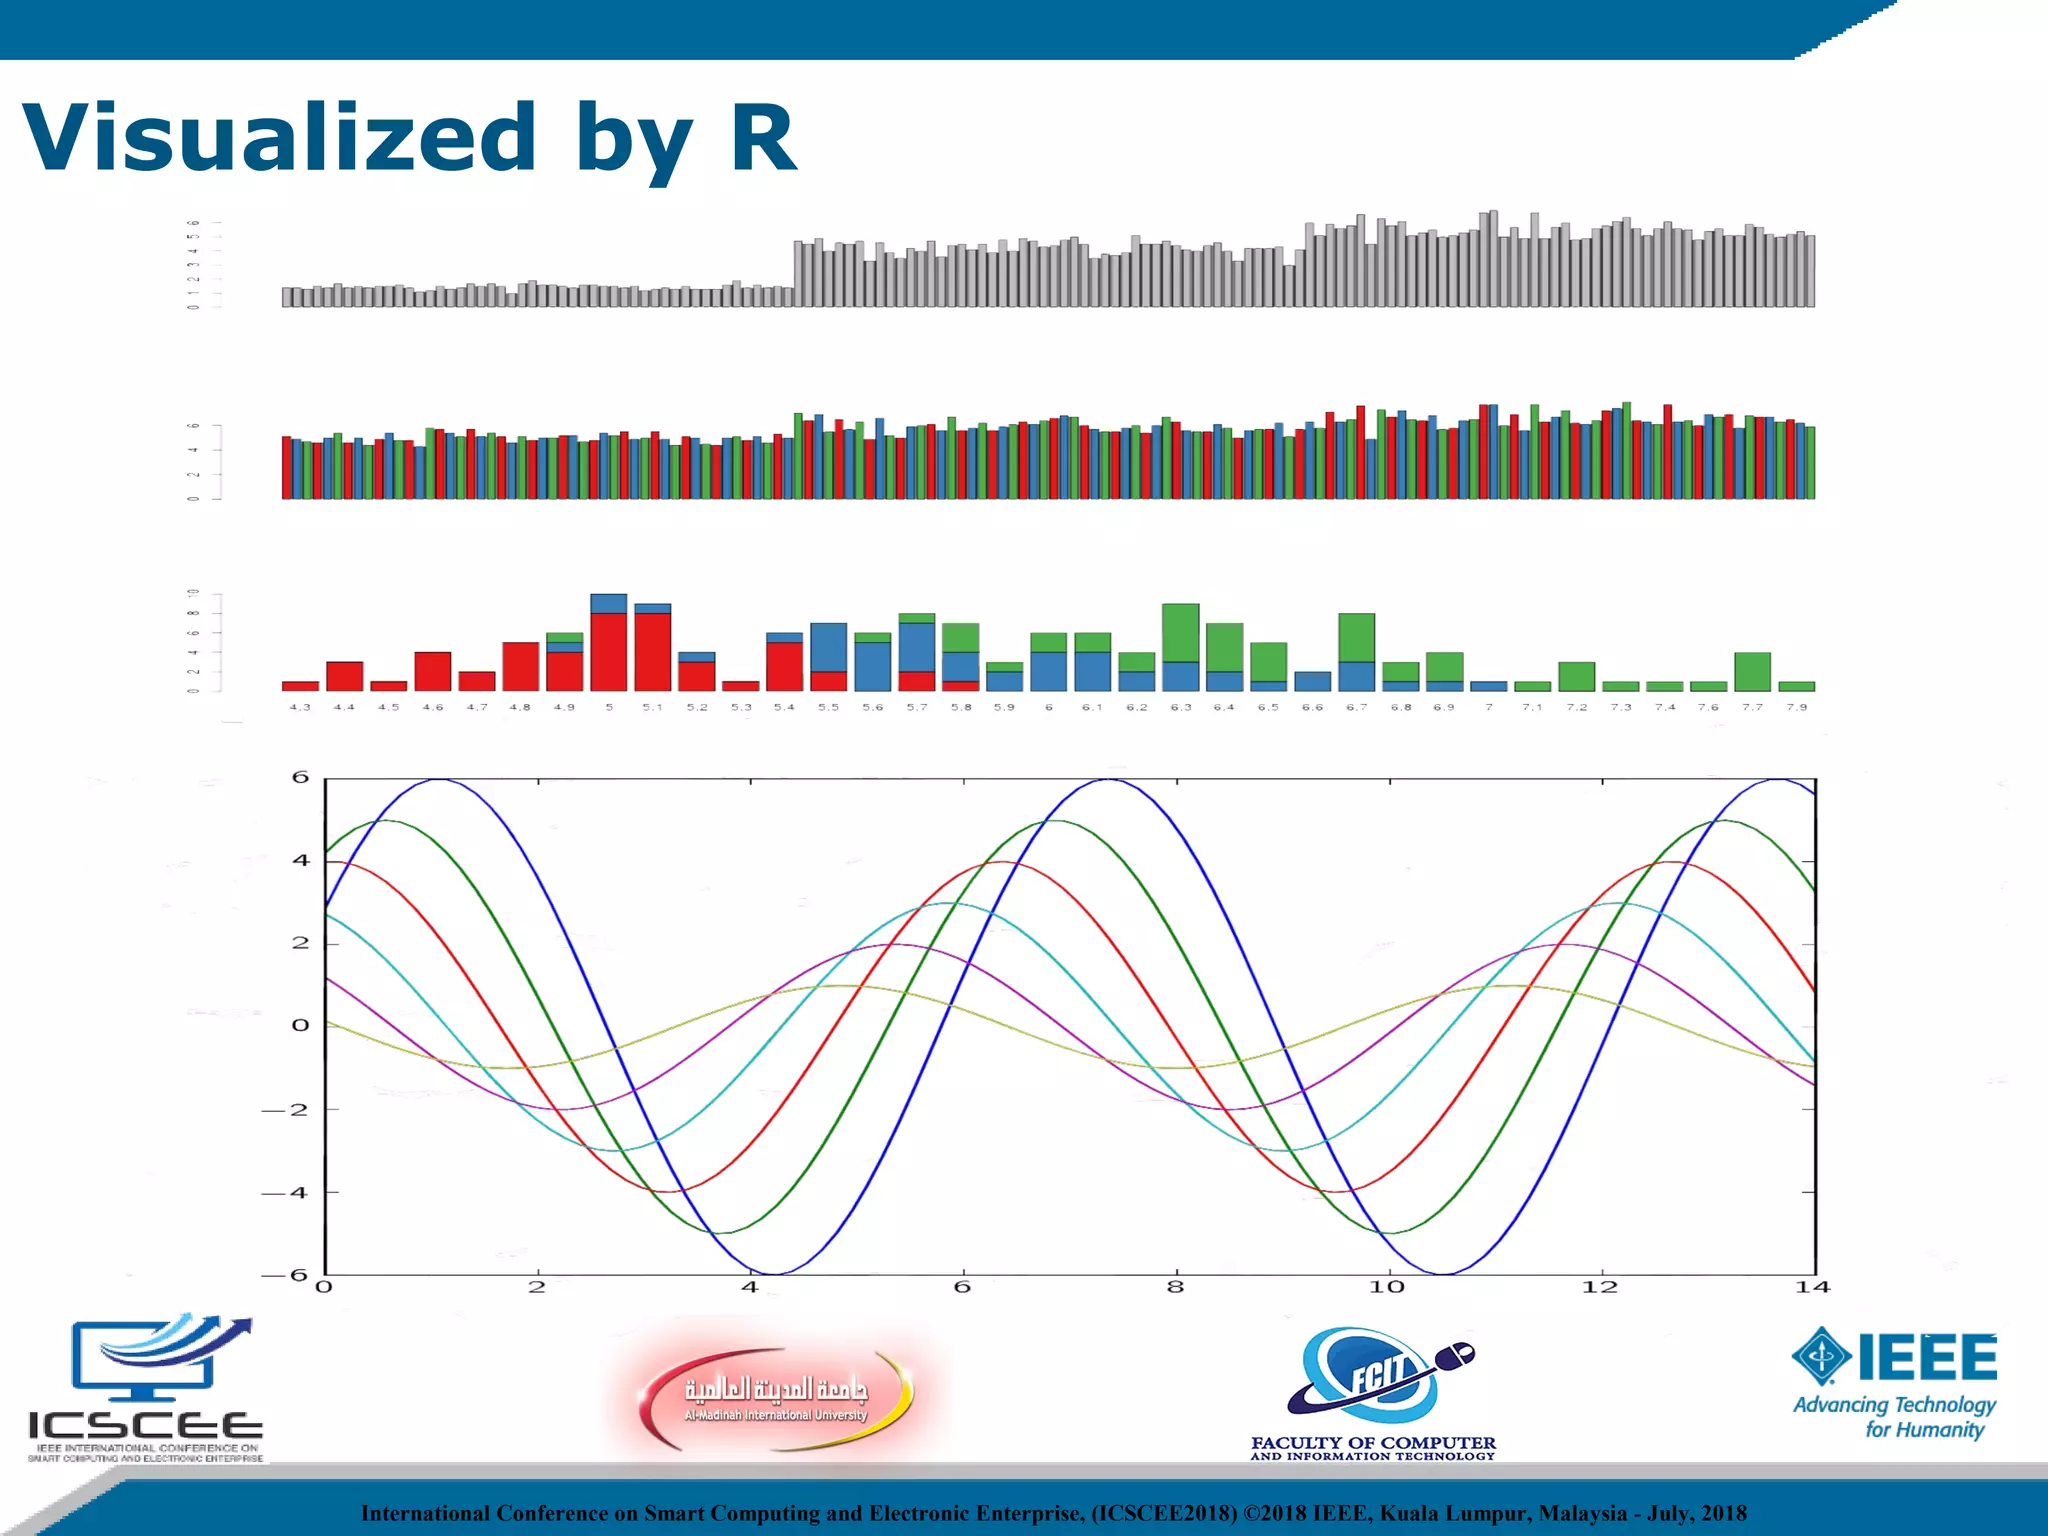
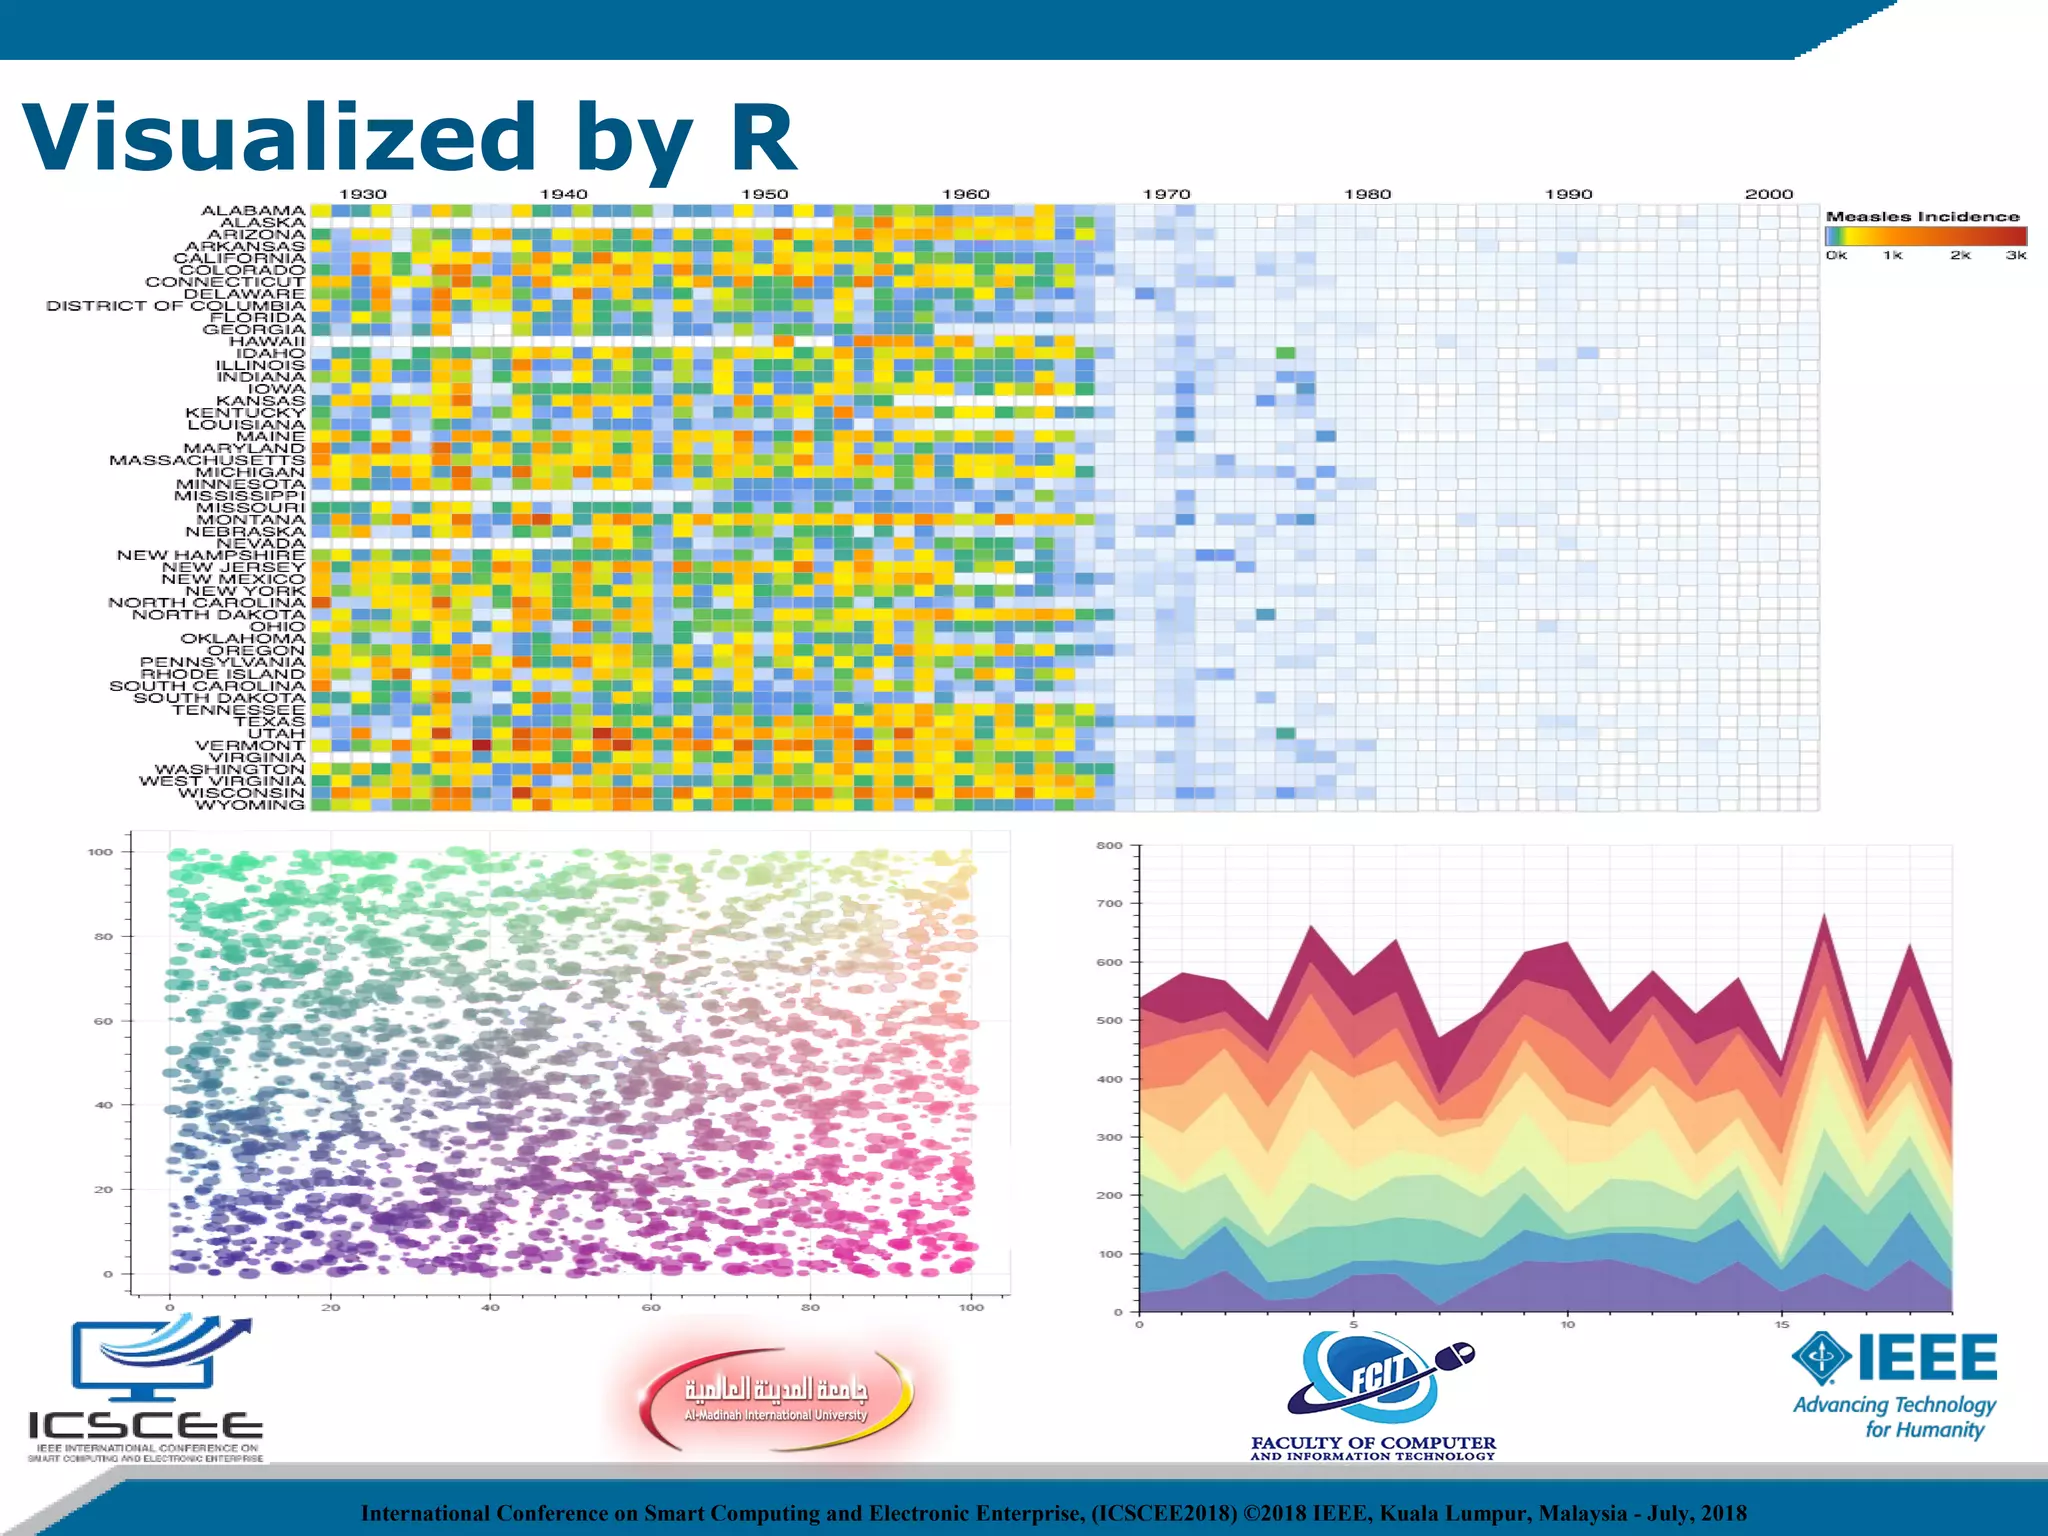
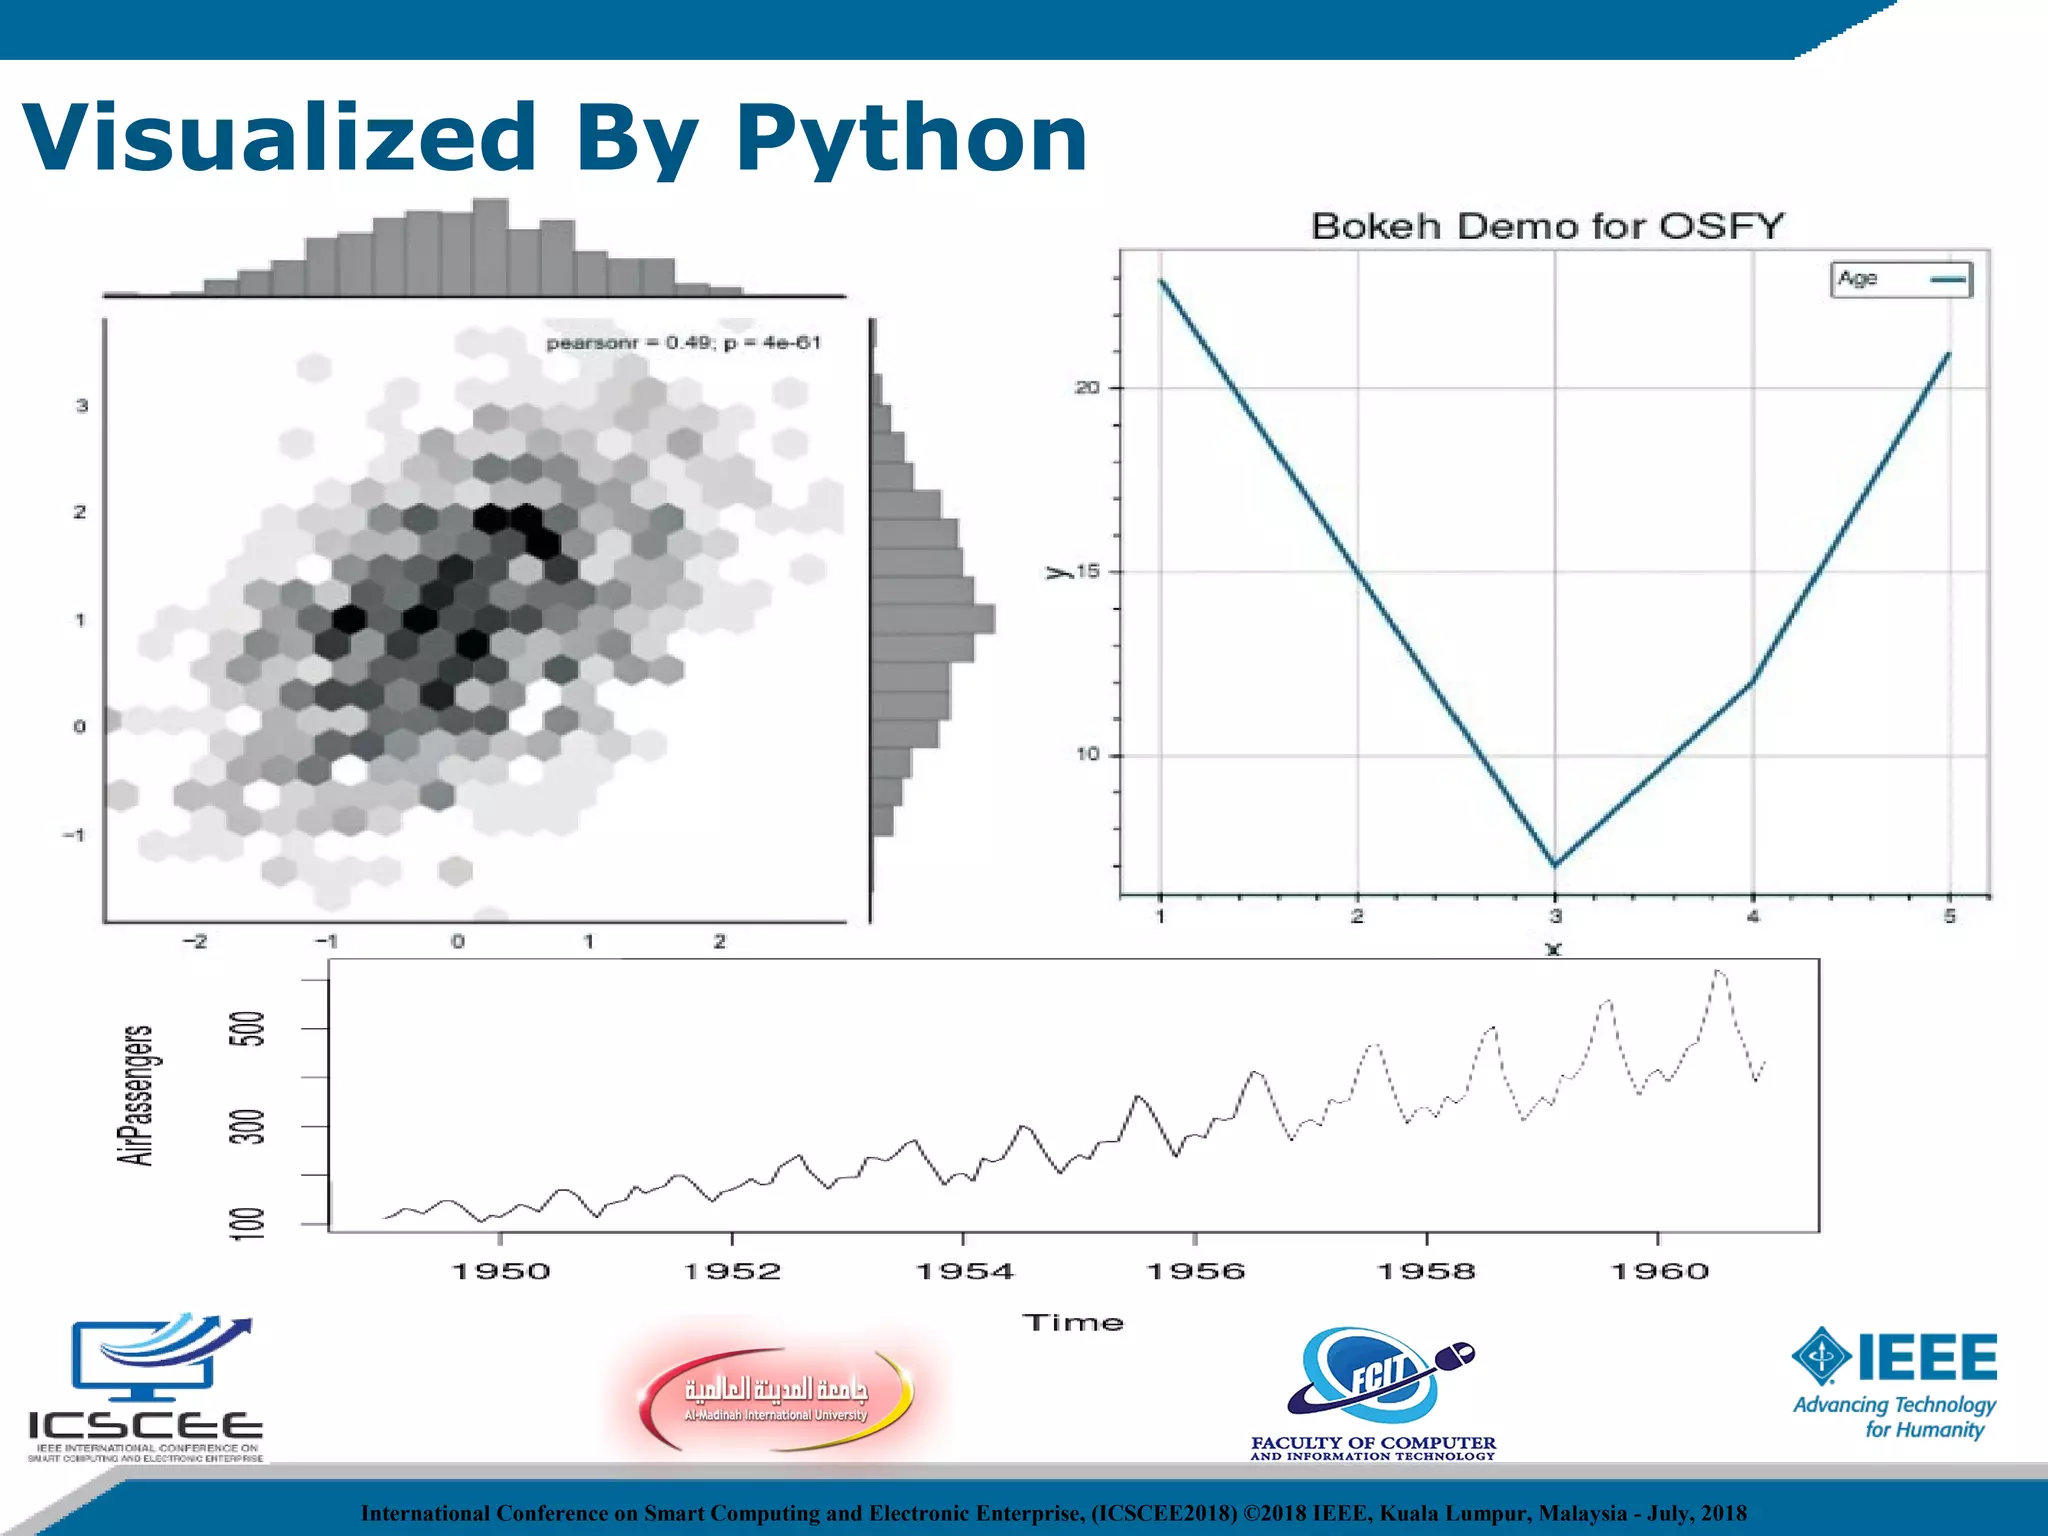
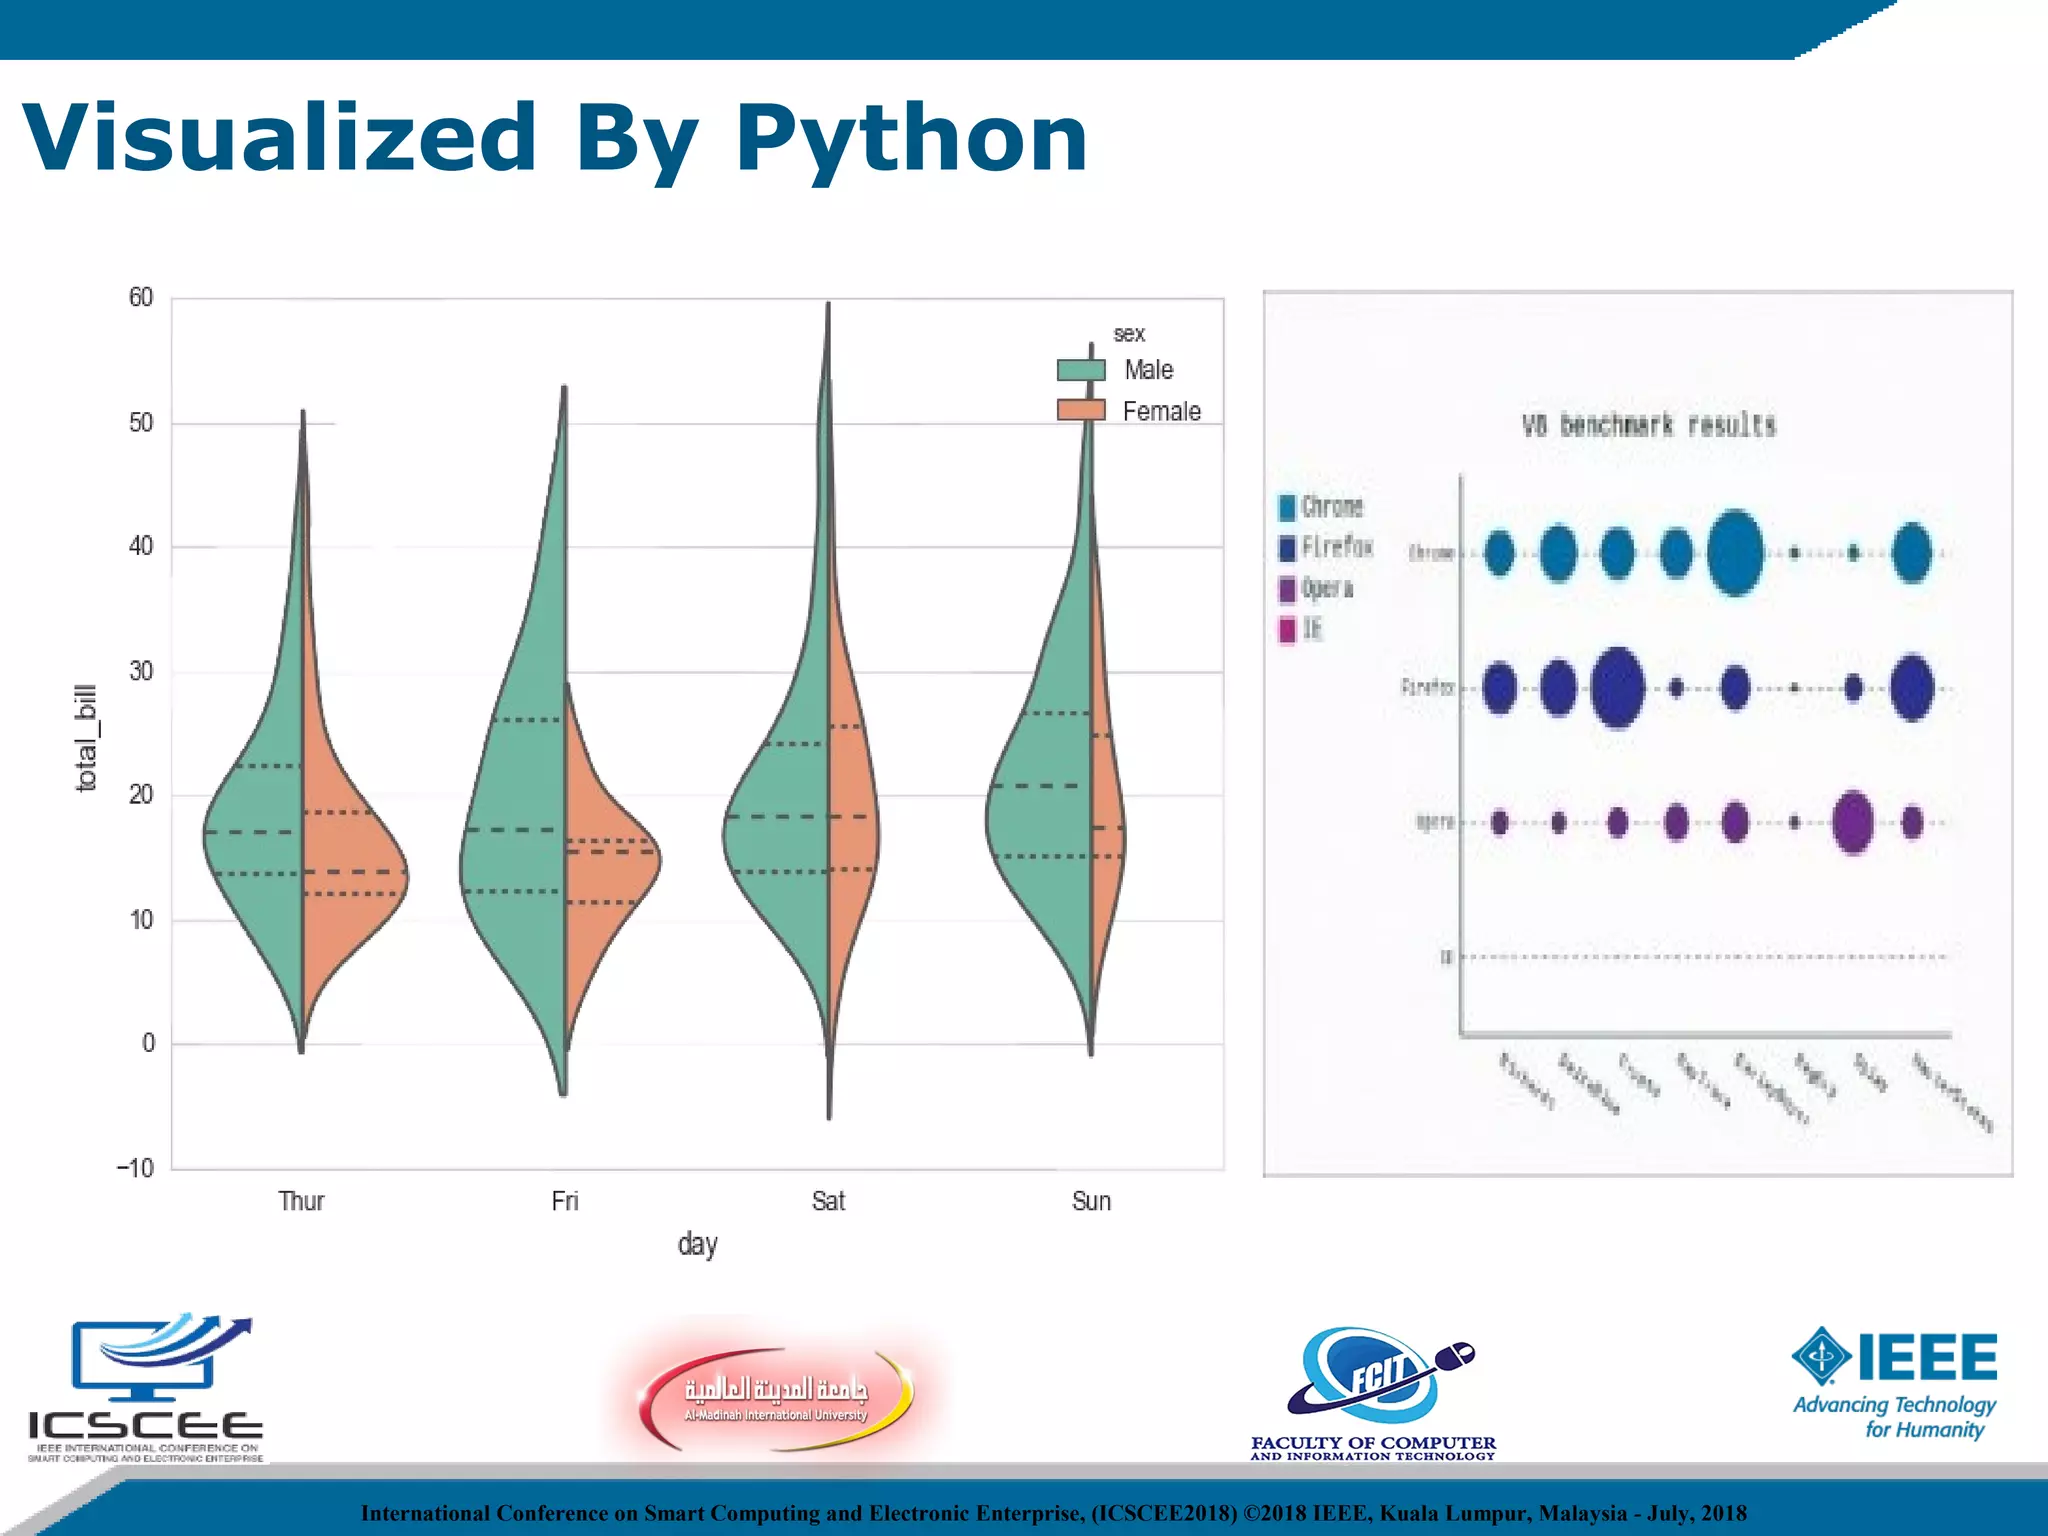
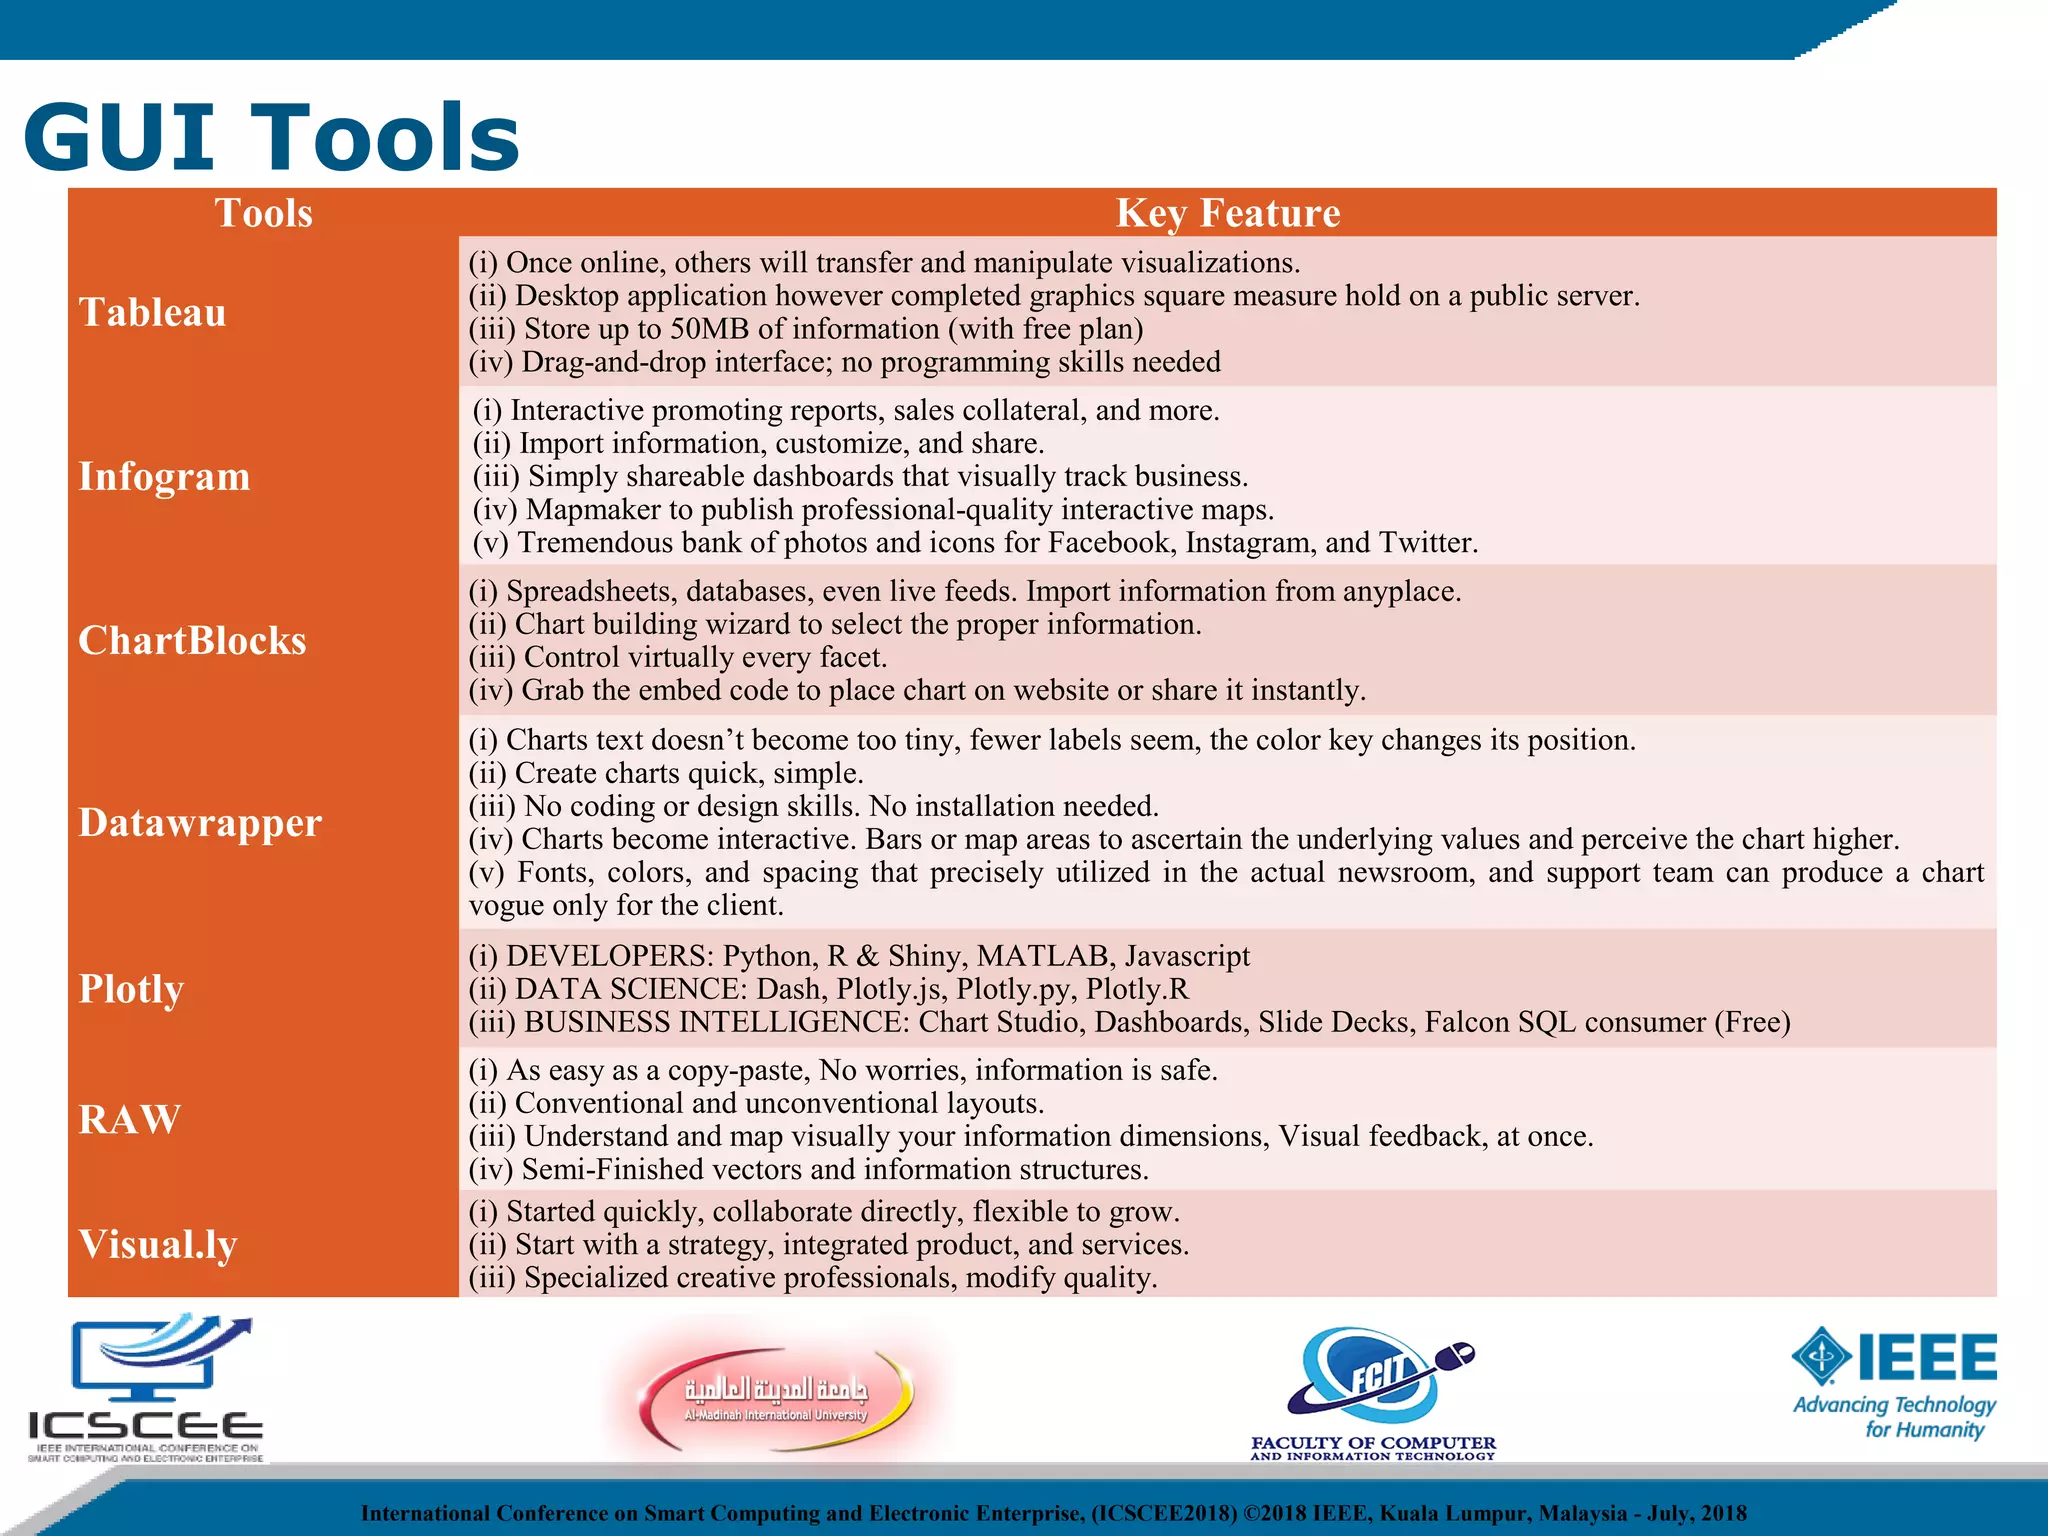
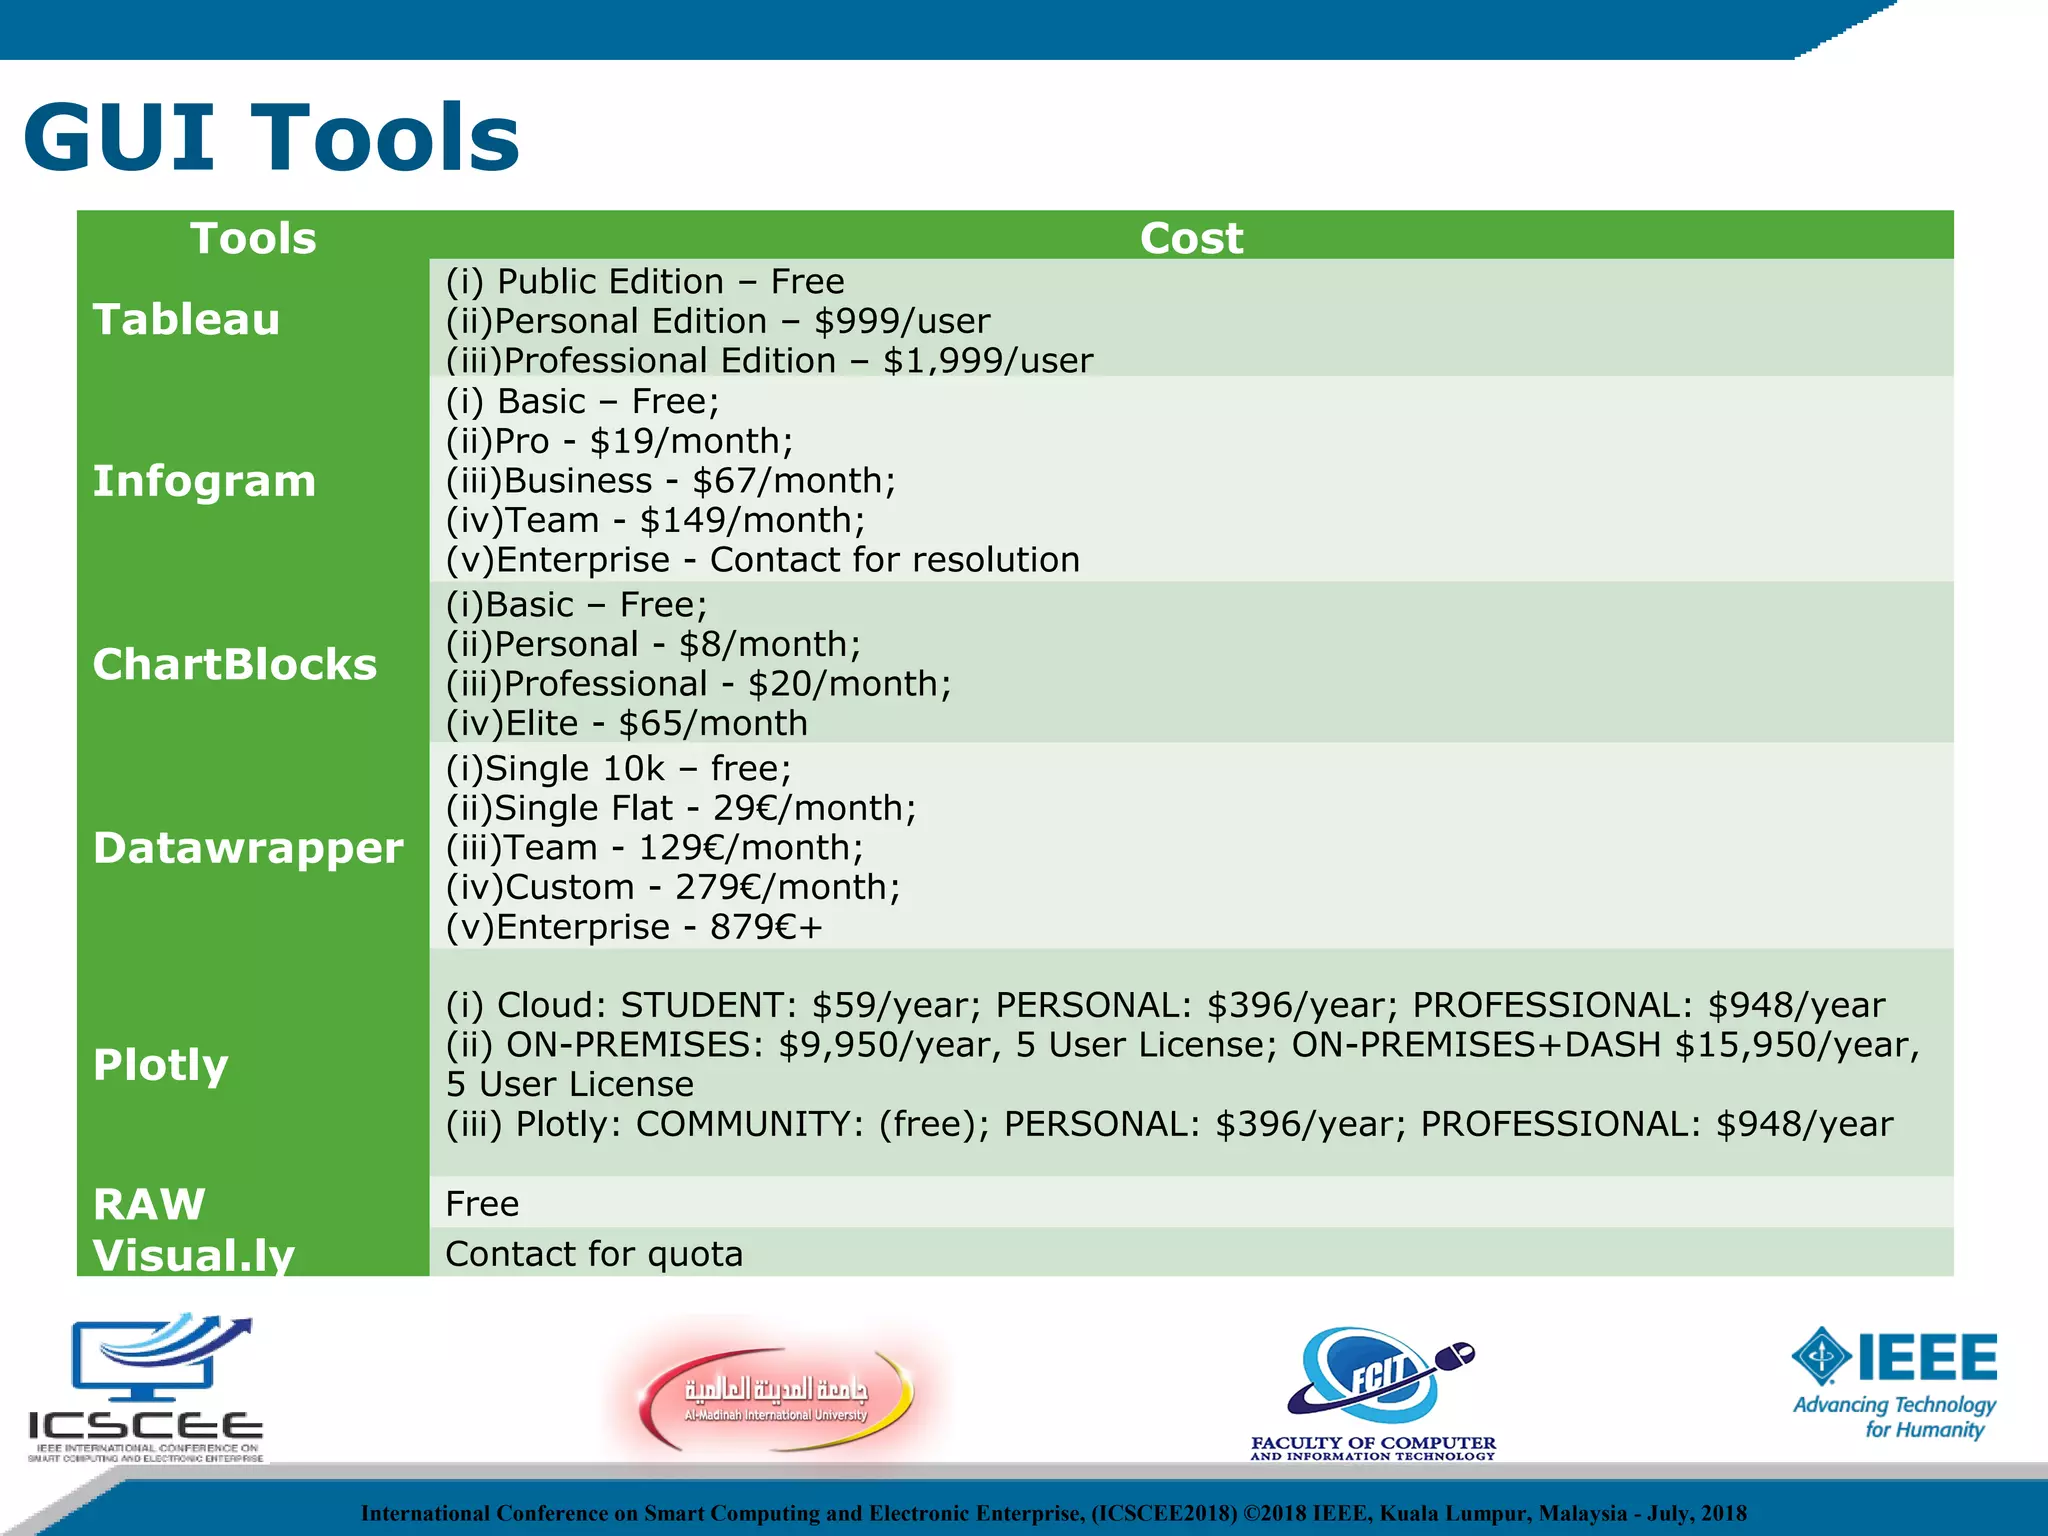
The document discusses the significance of big data visualization using tools like R, Python, and various GUI applications, emphasizing that visual data is more comprehensible and engaging than text. It outlines several visualization tools available, their features, and pricing, as well as examples of historical data visualization methods. The document highlights the advantages of visualization in making complex data accessible and usable for analysis.