Download as PDF, PPTX

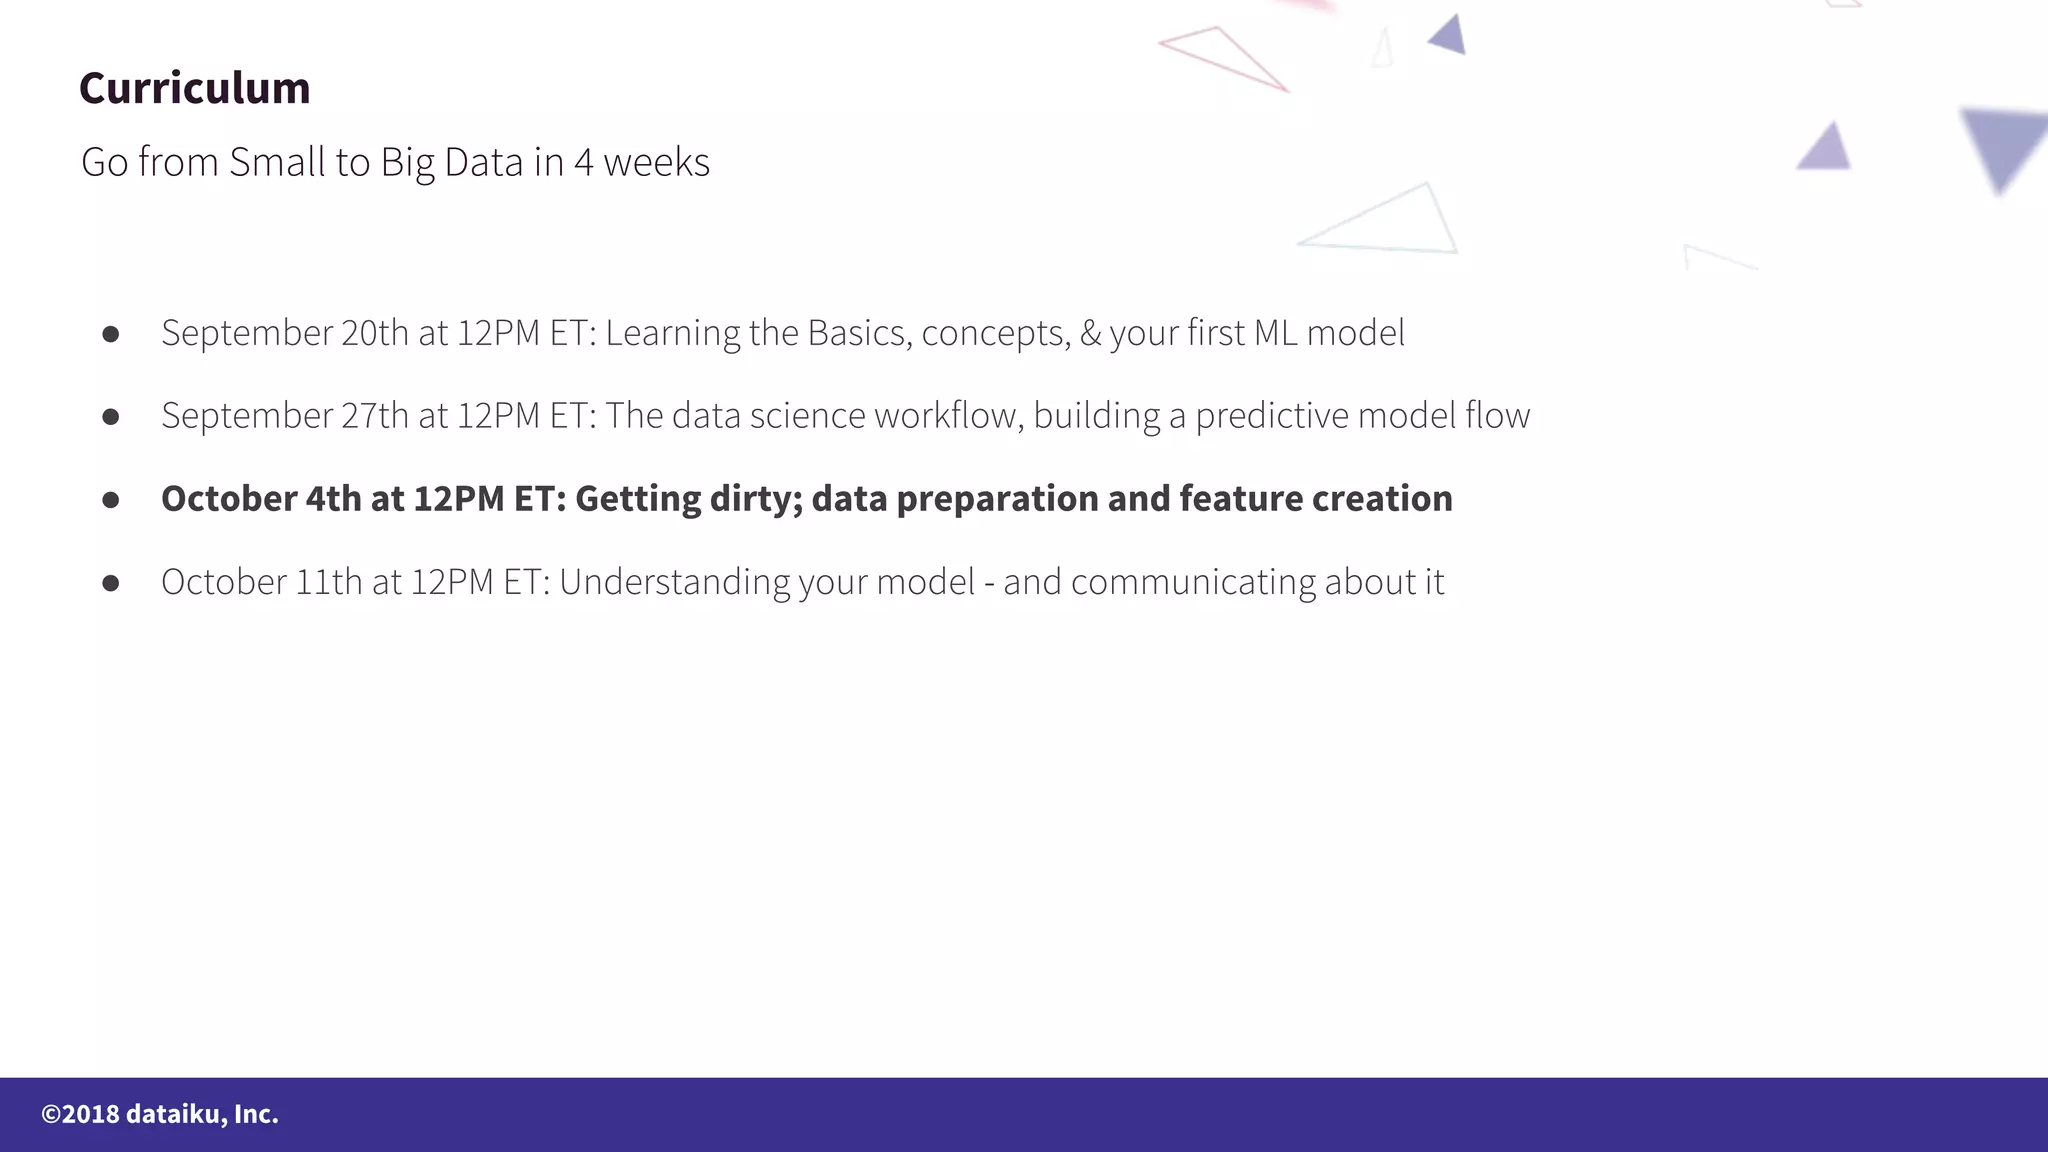
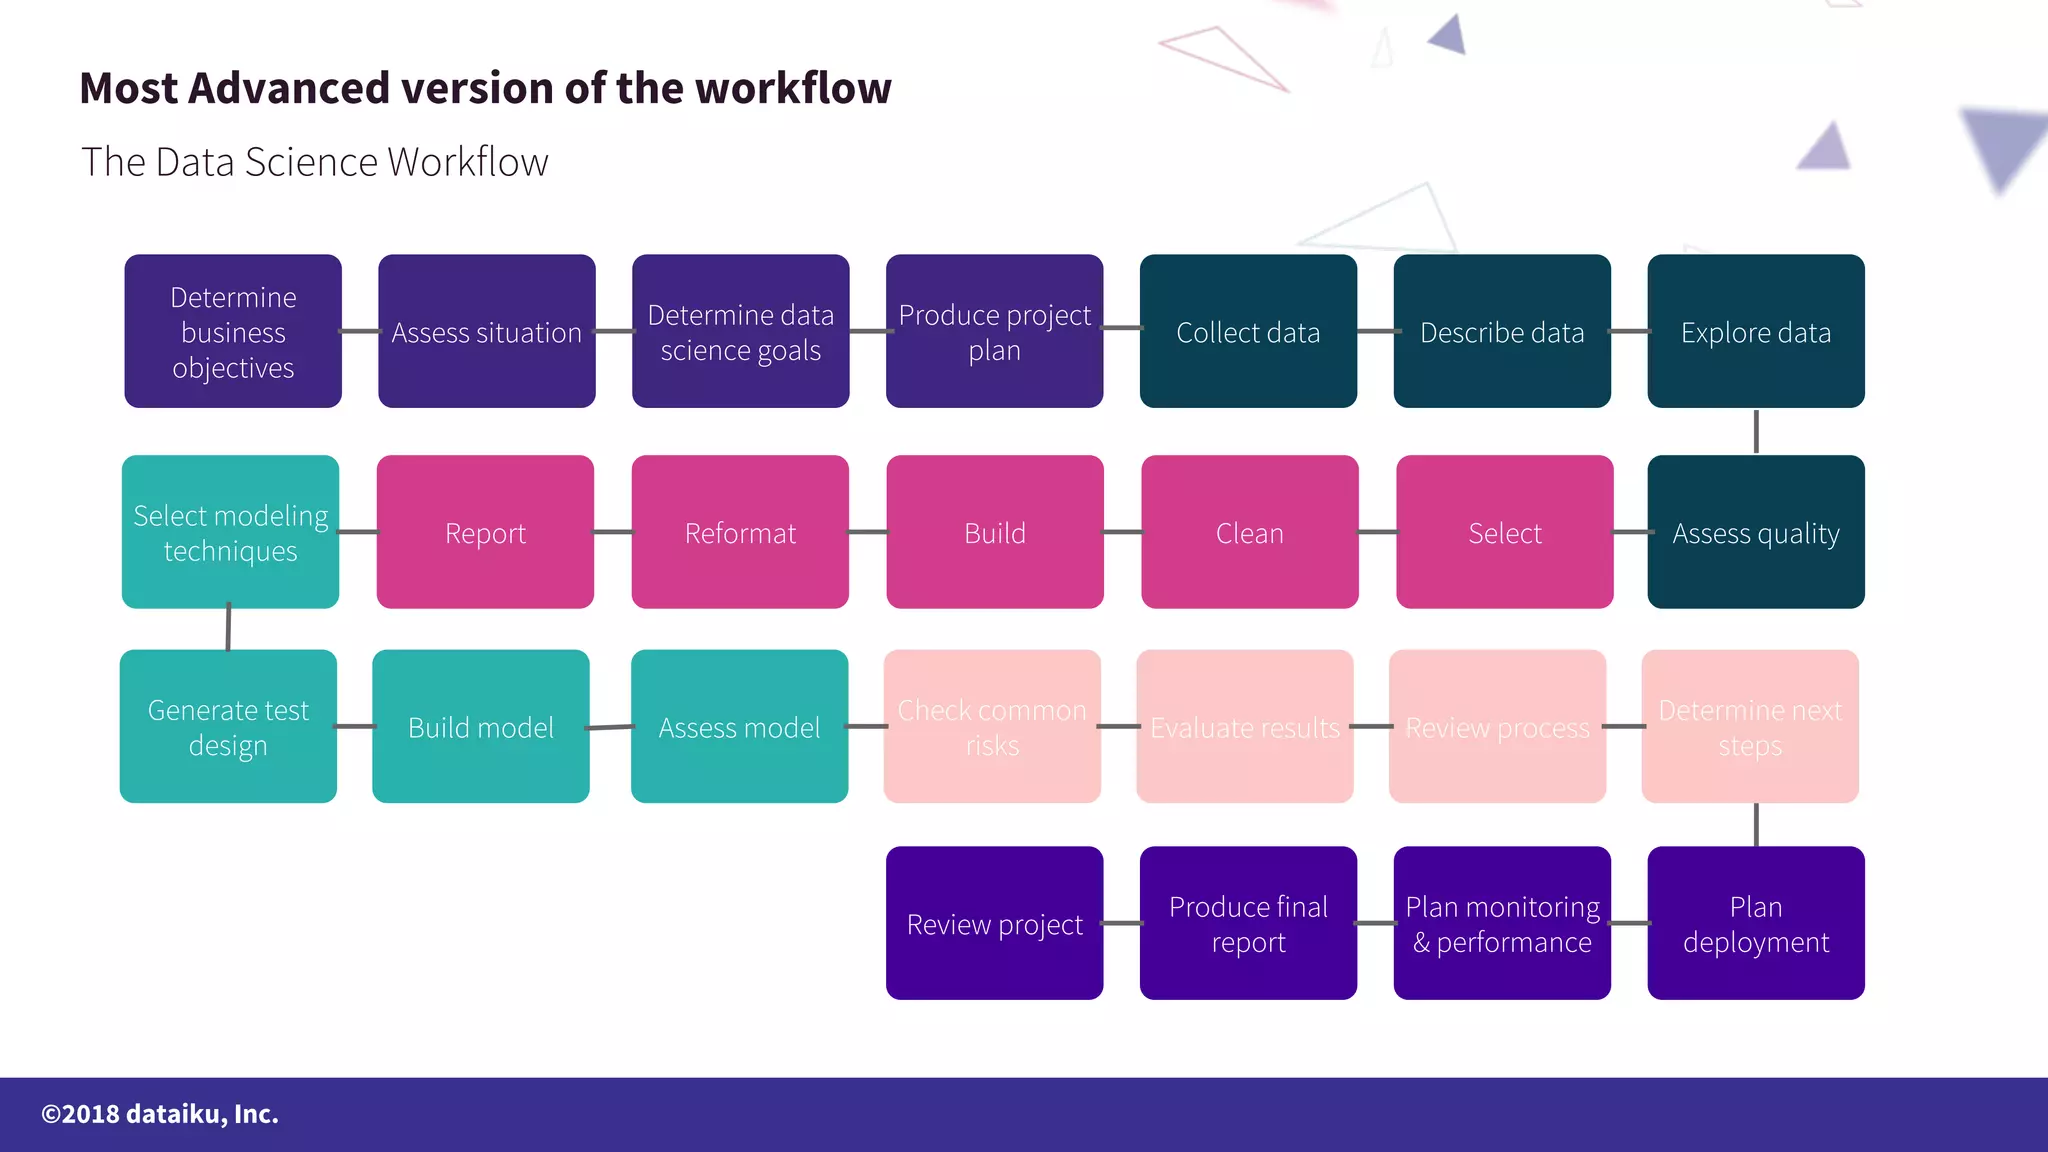
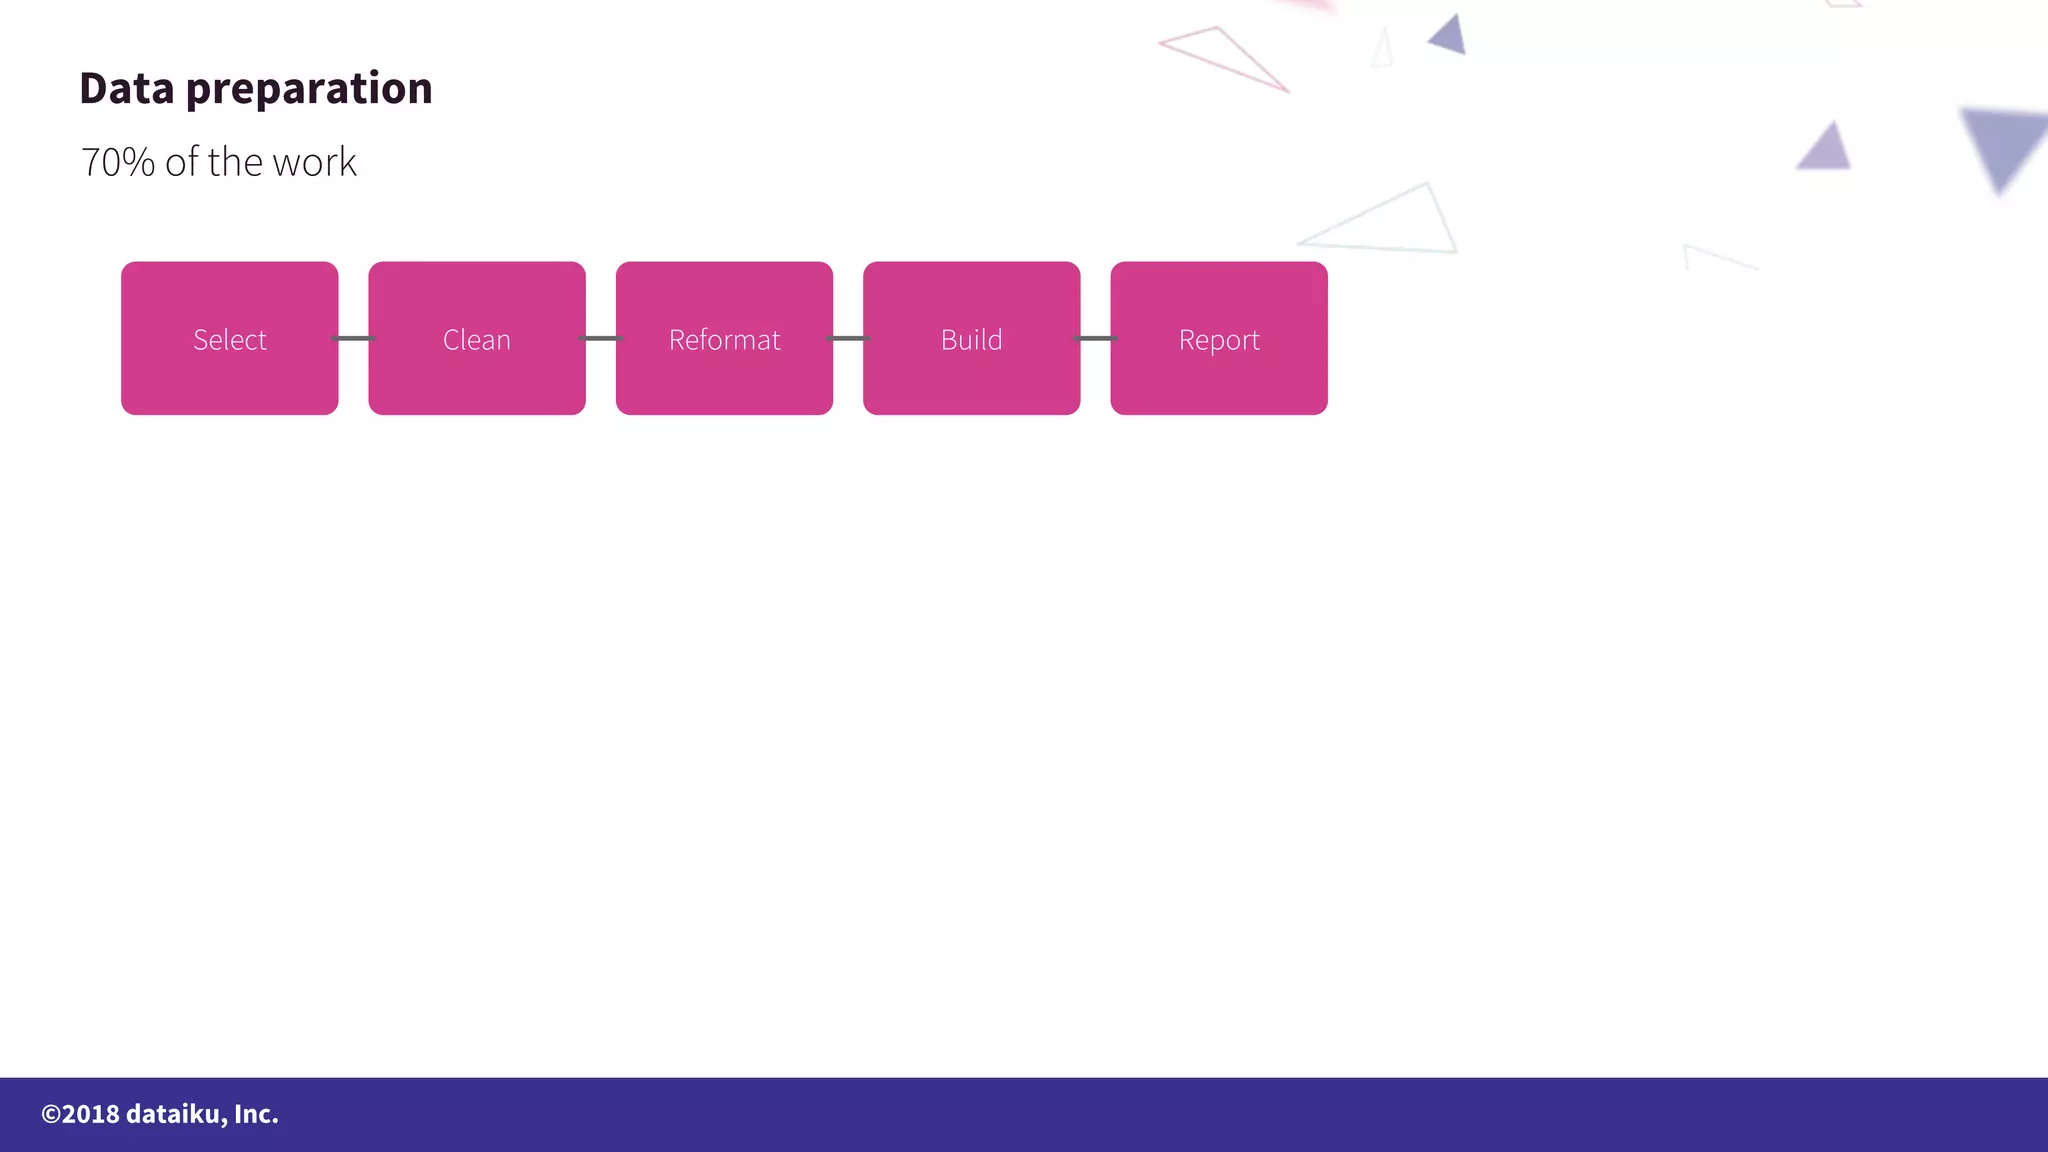
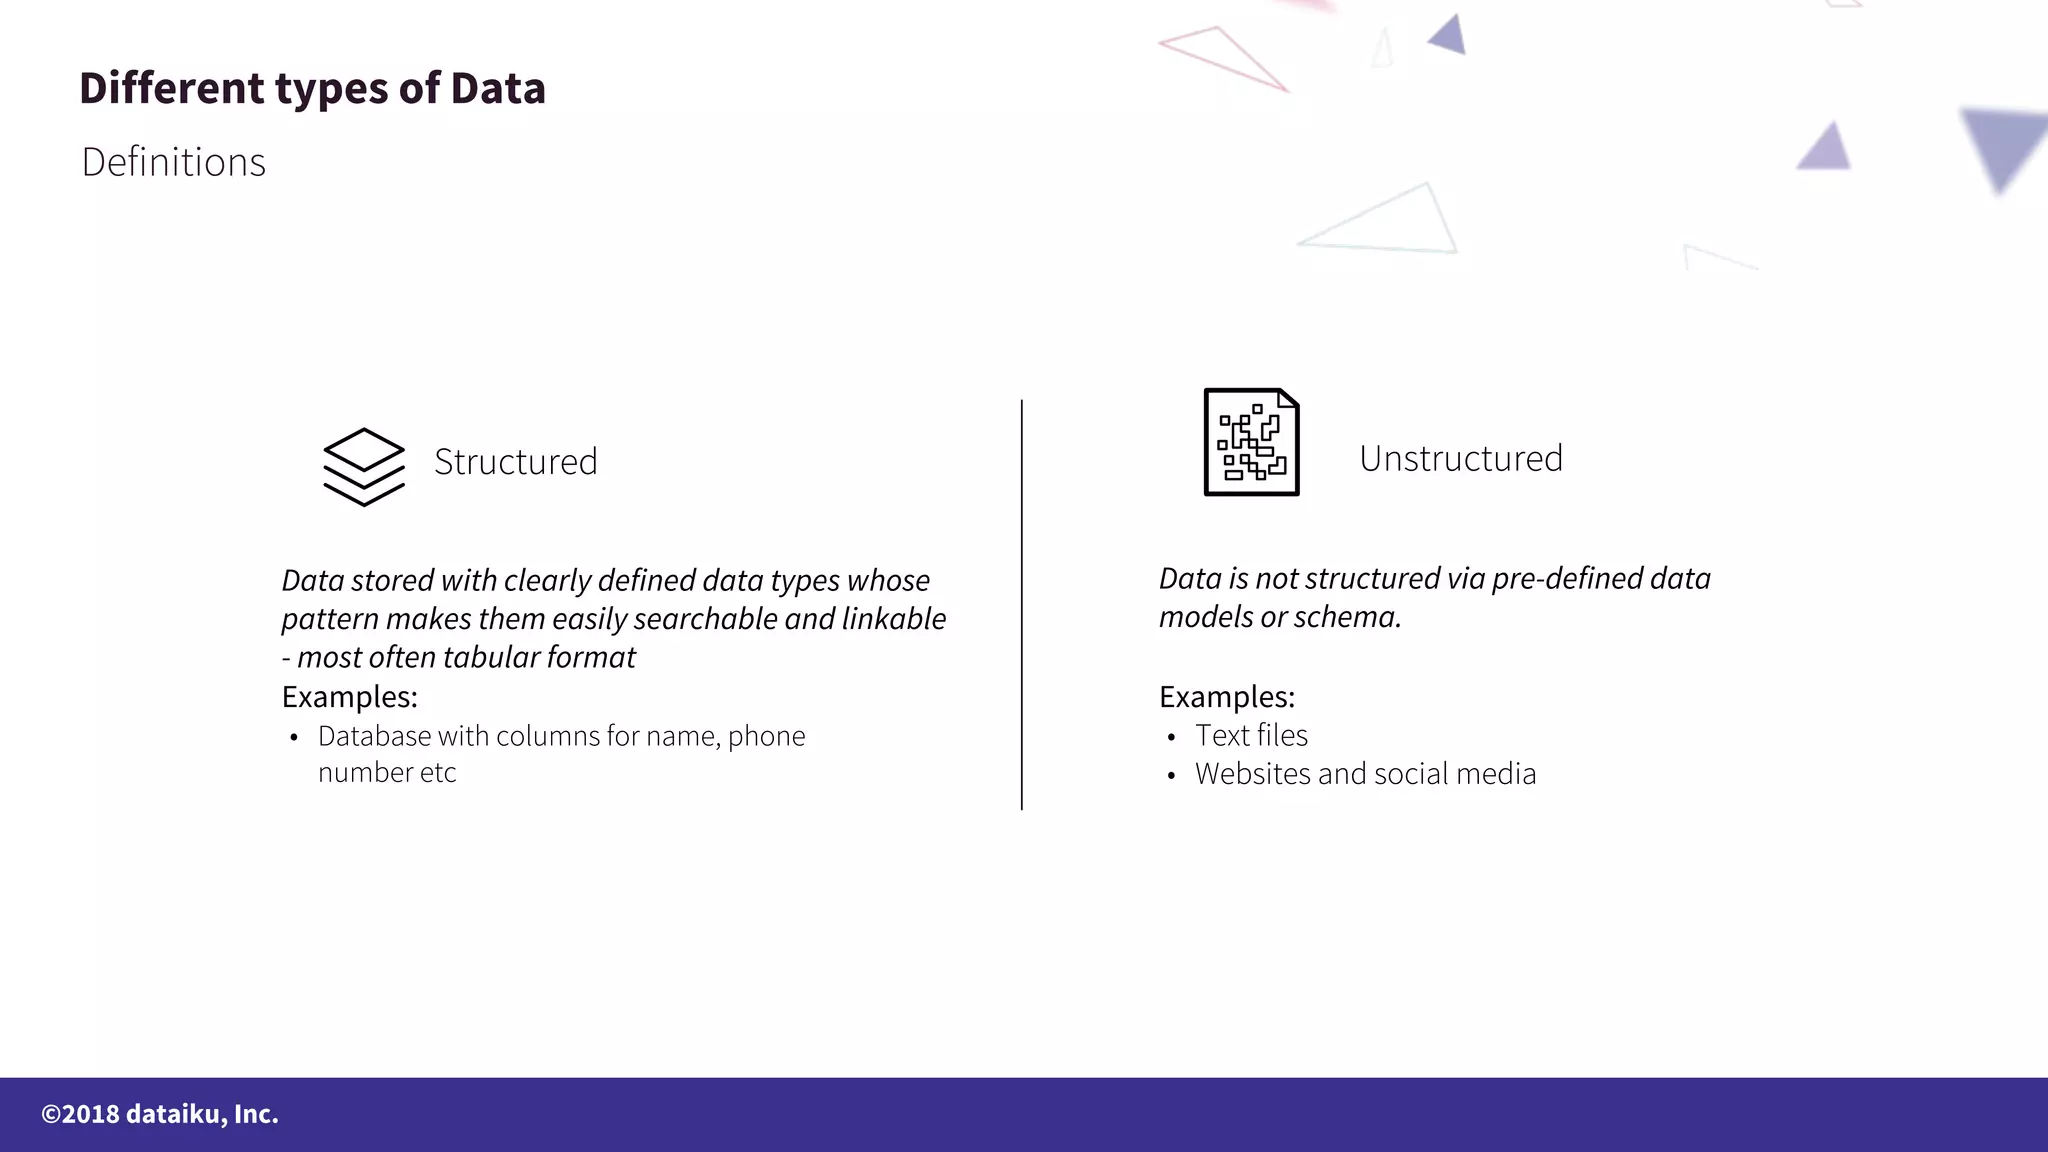
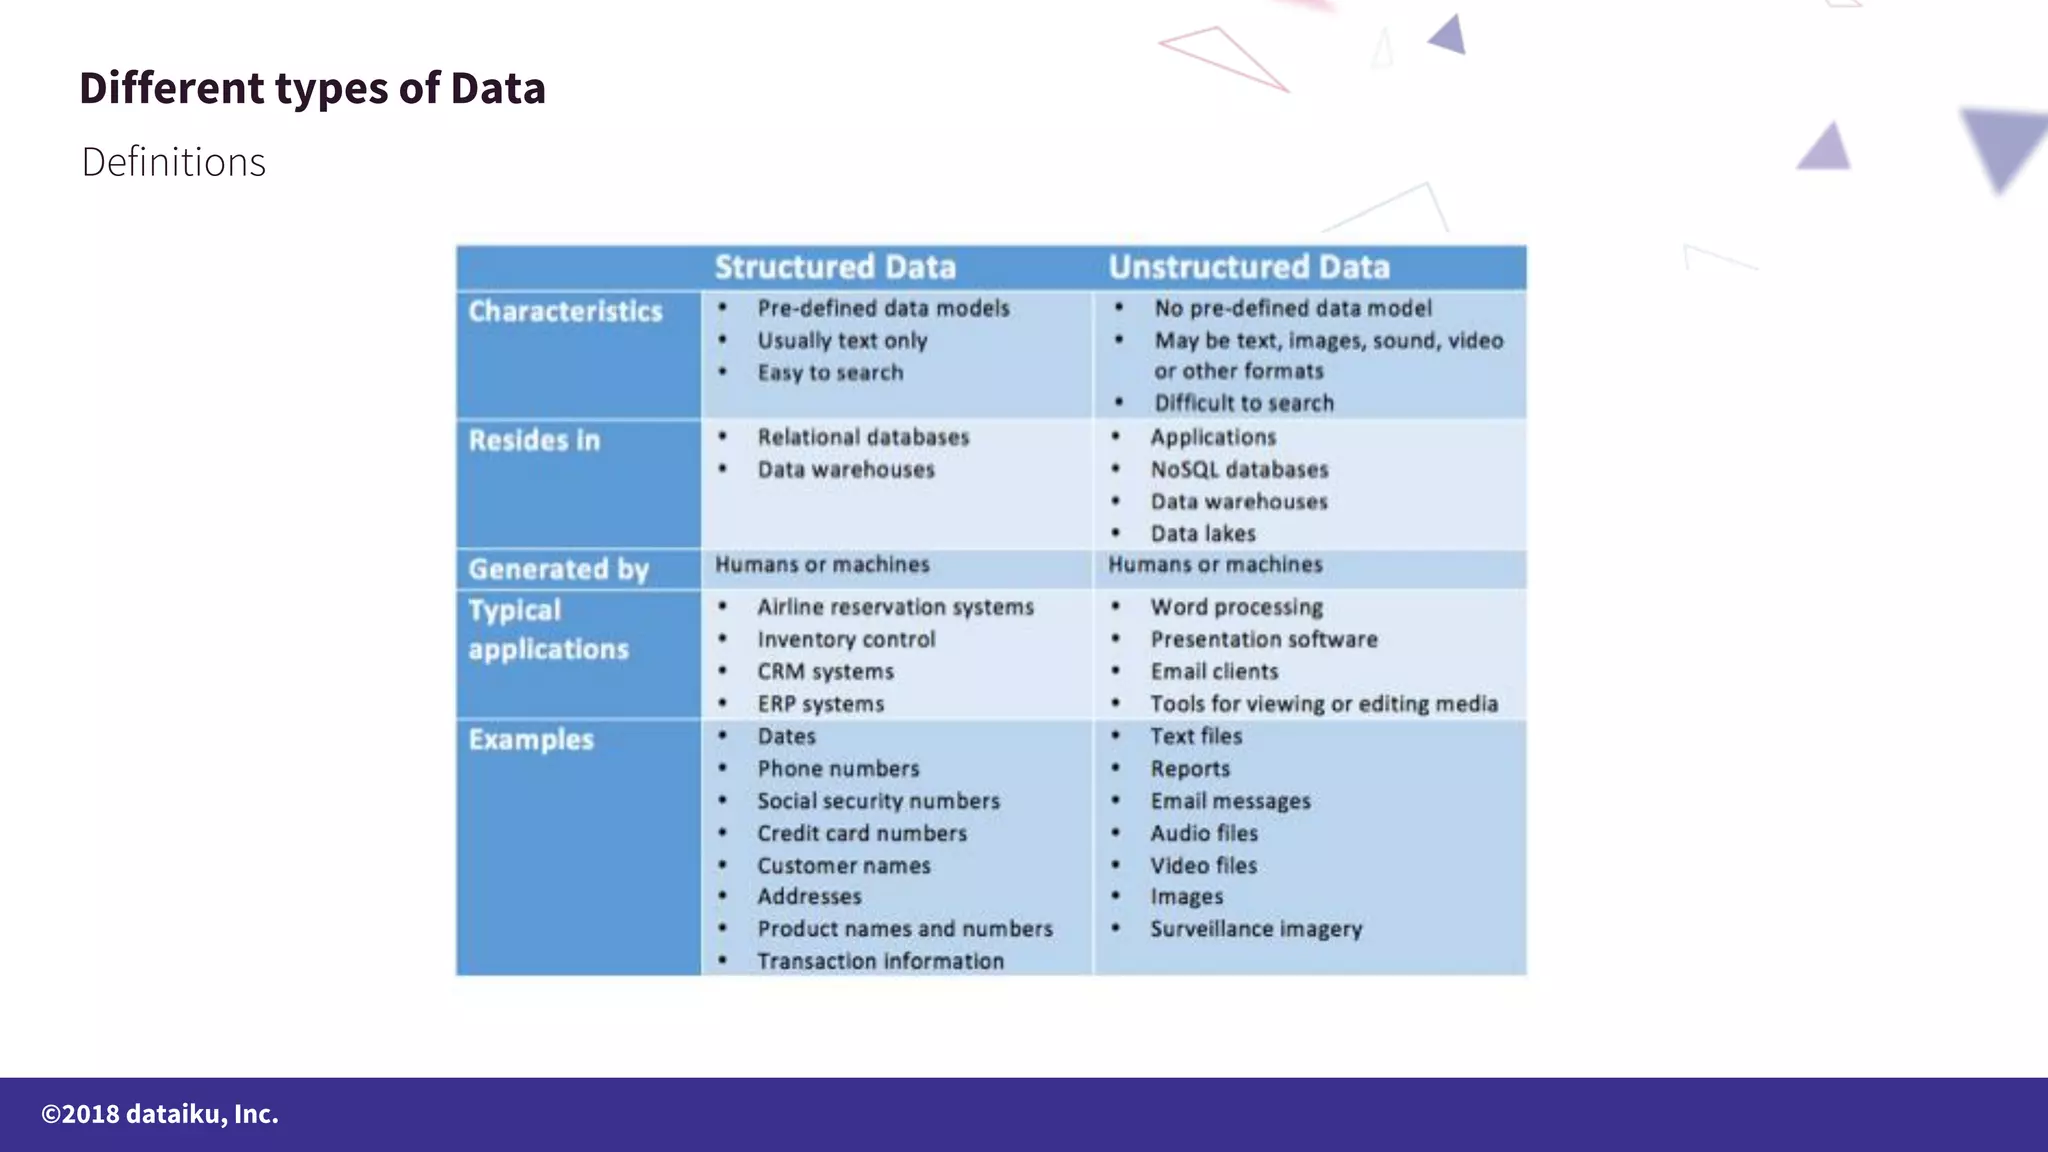
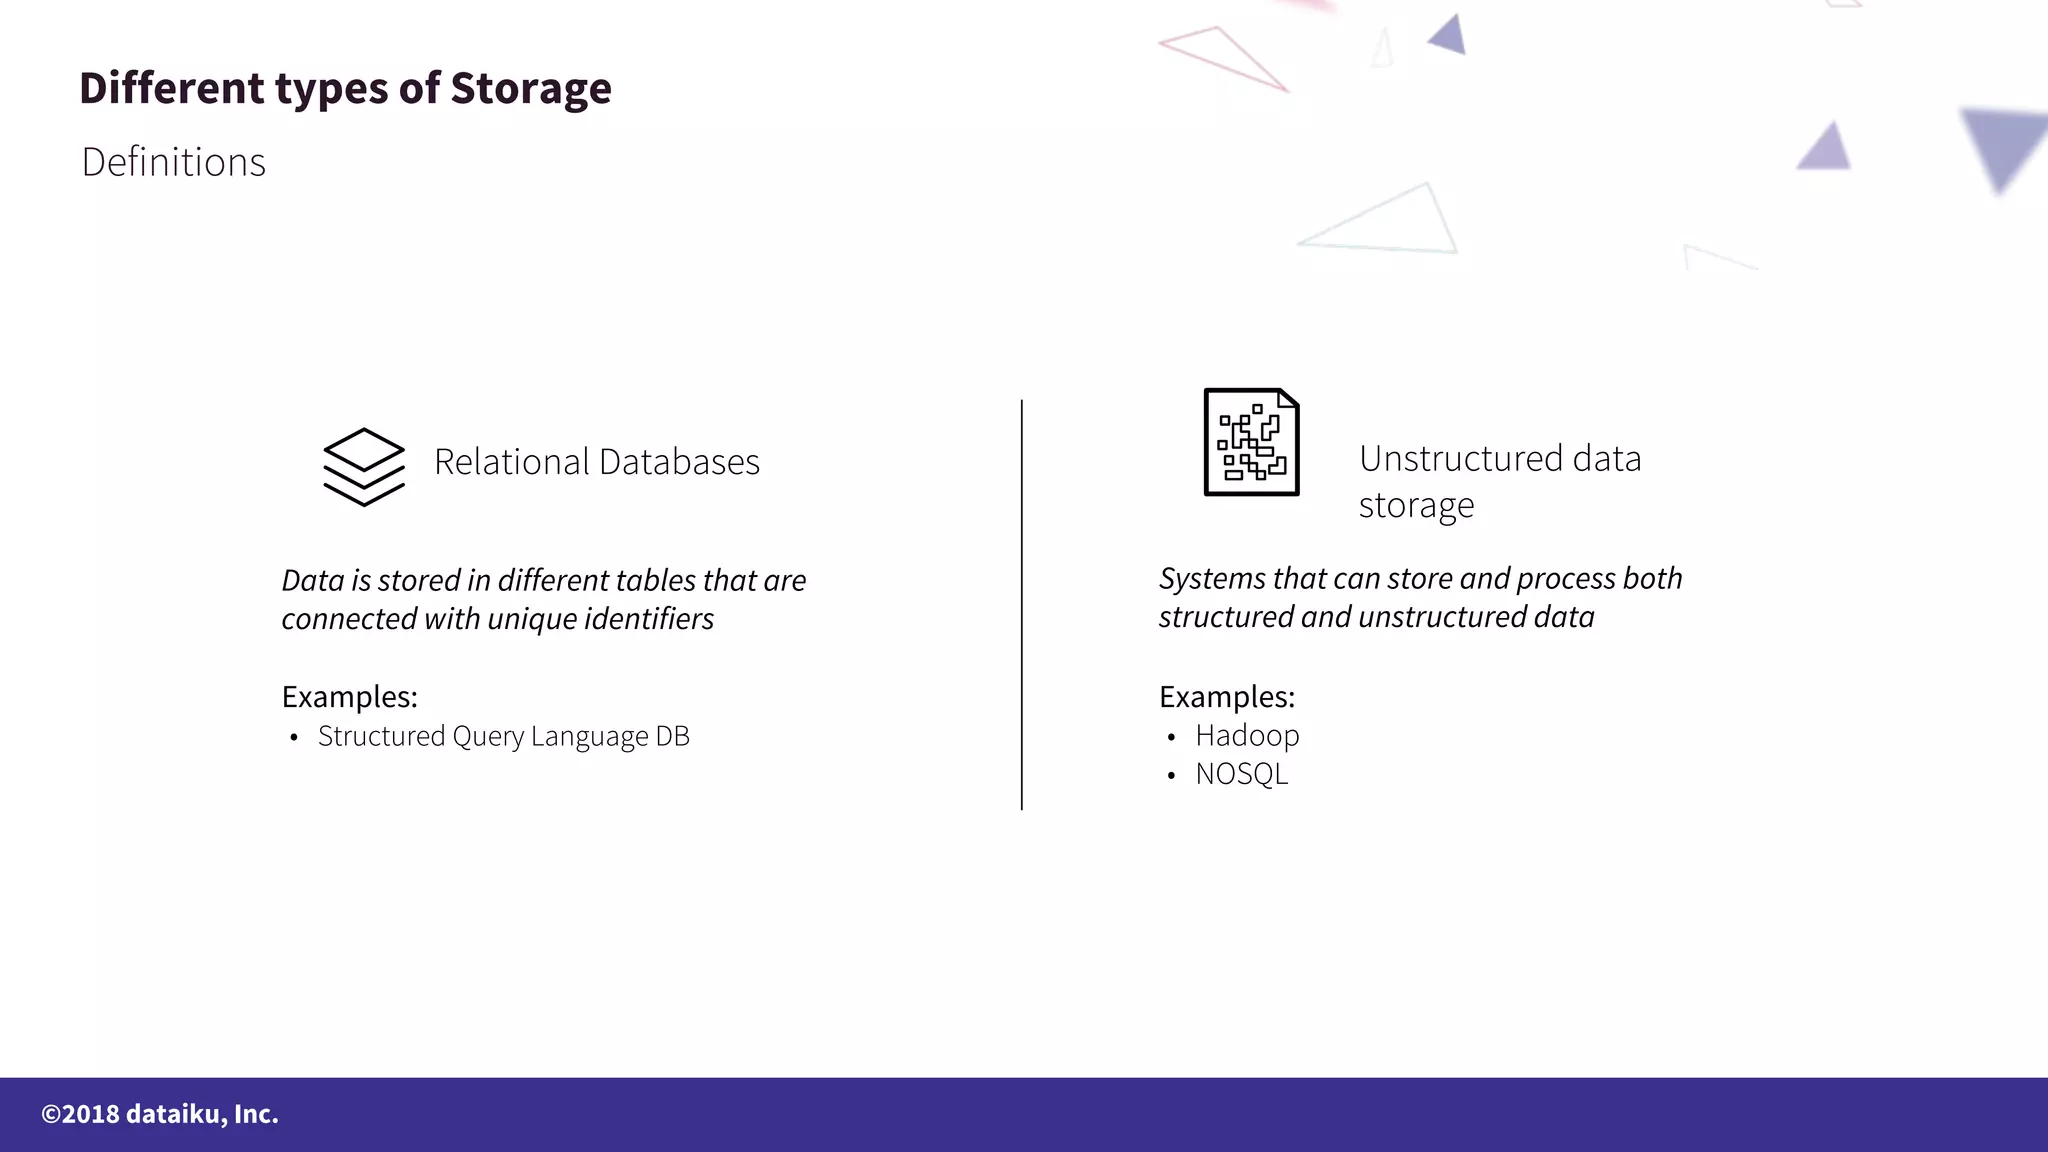
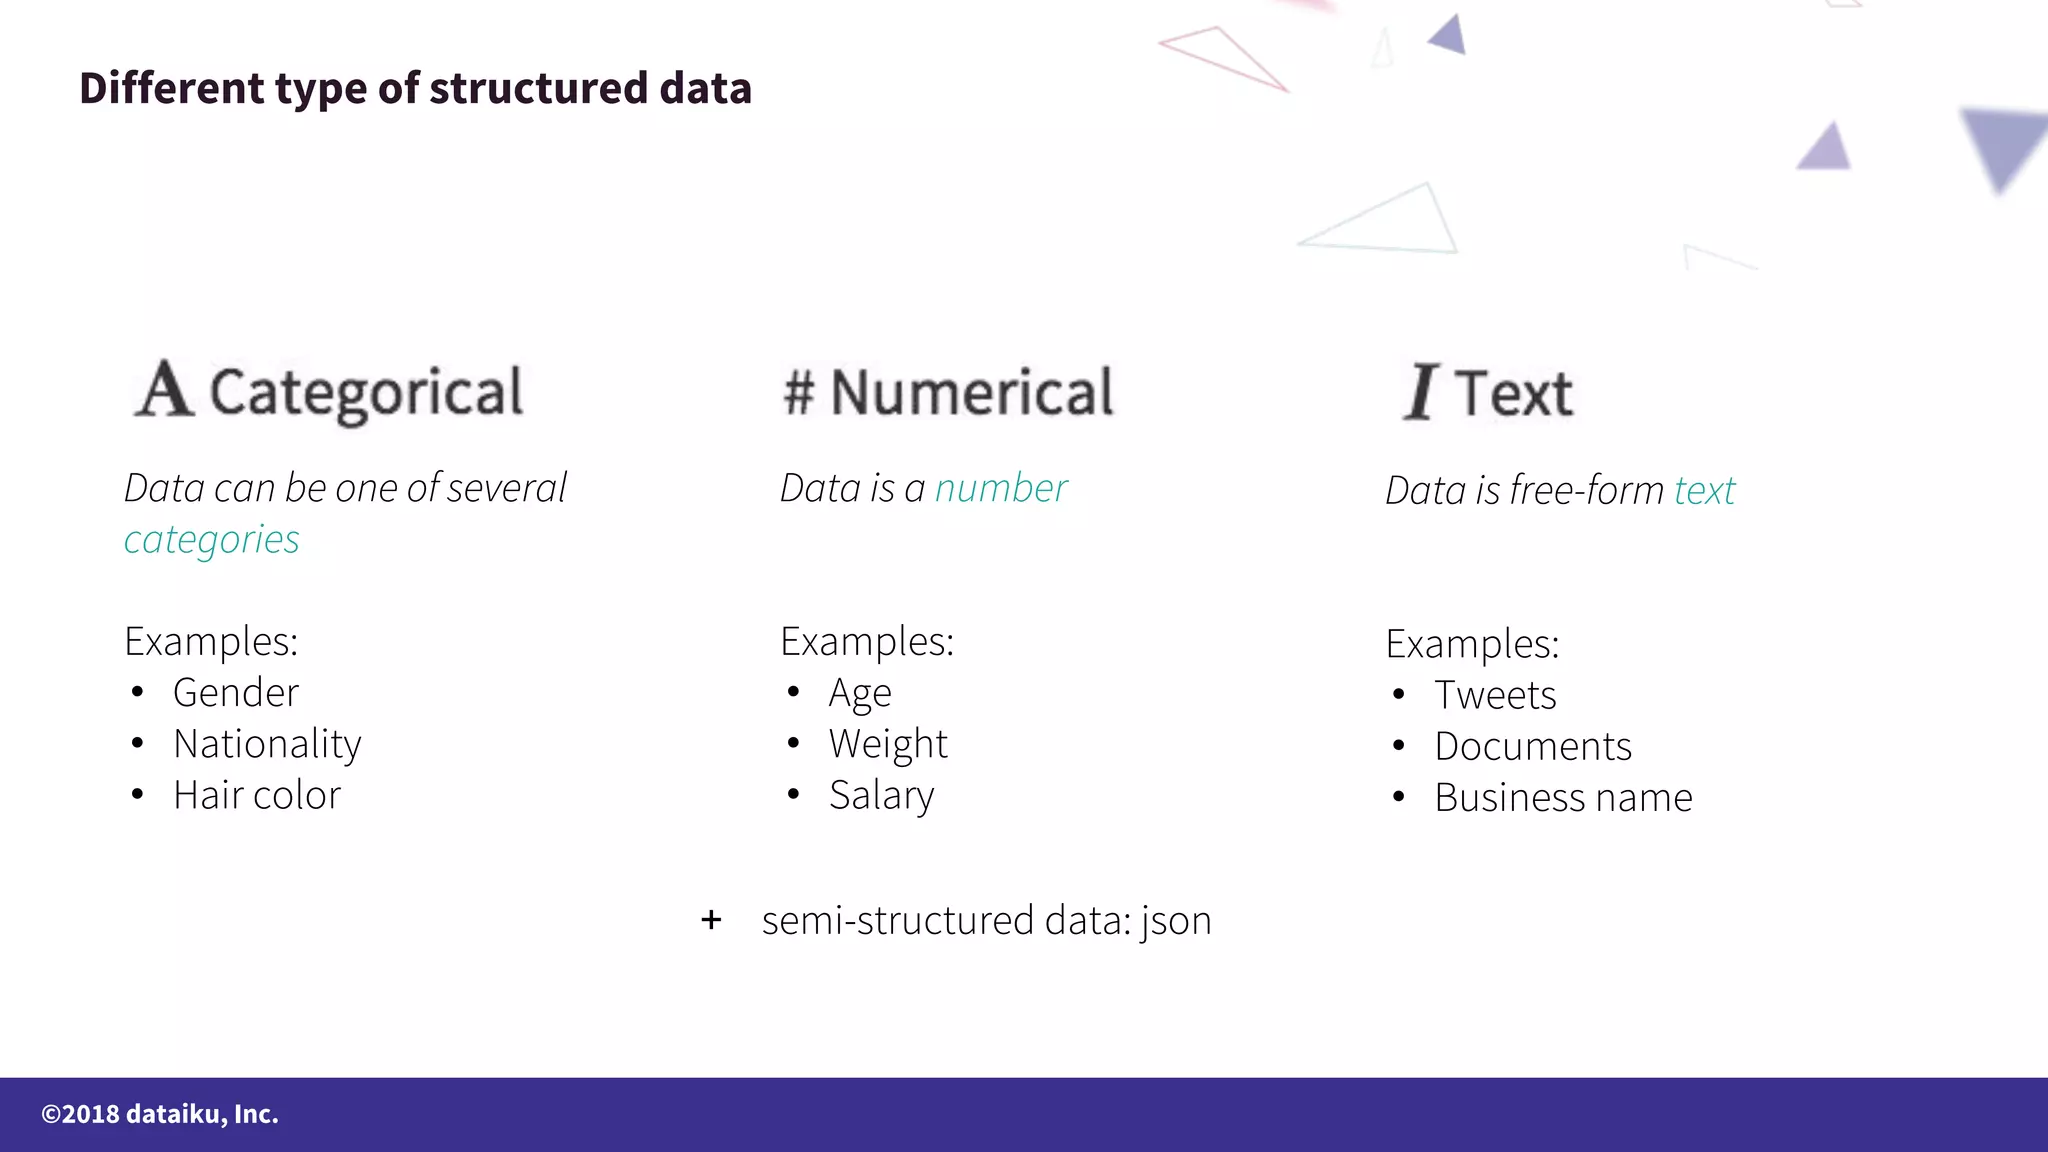
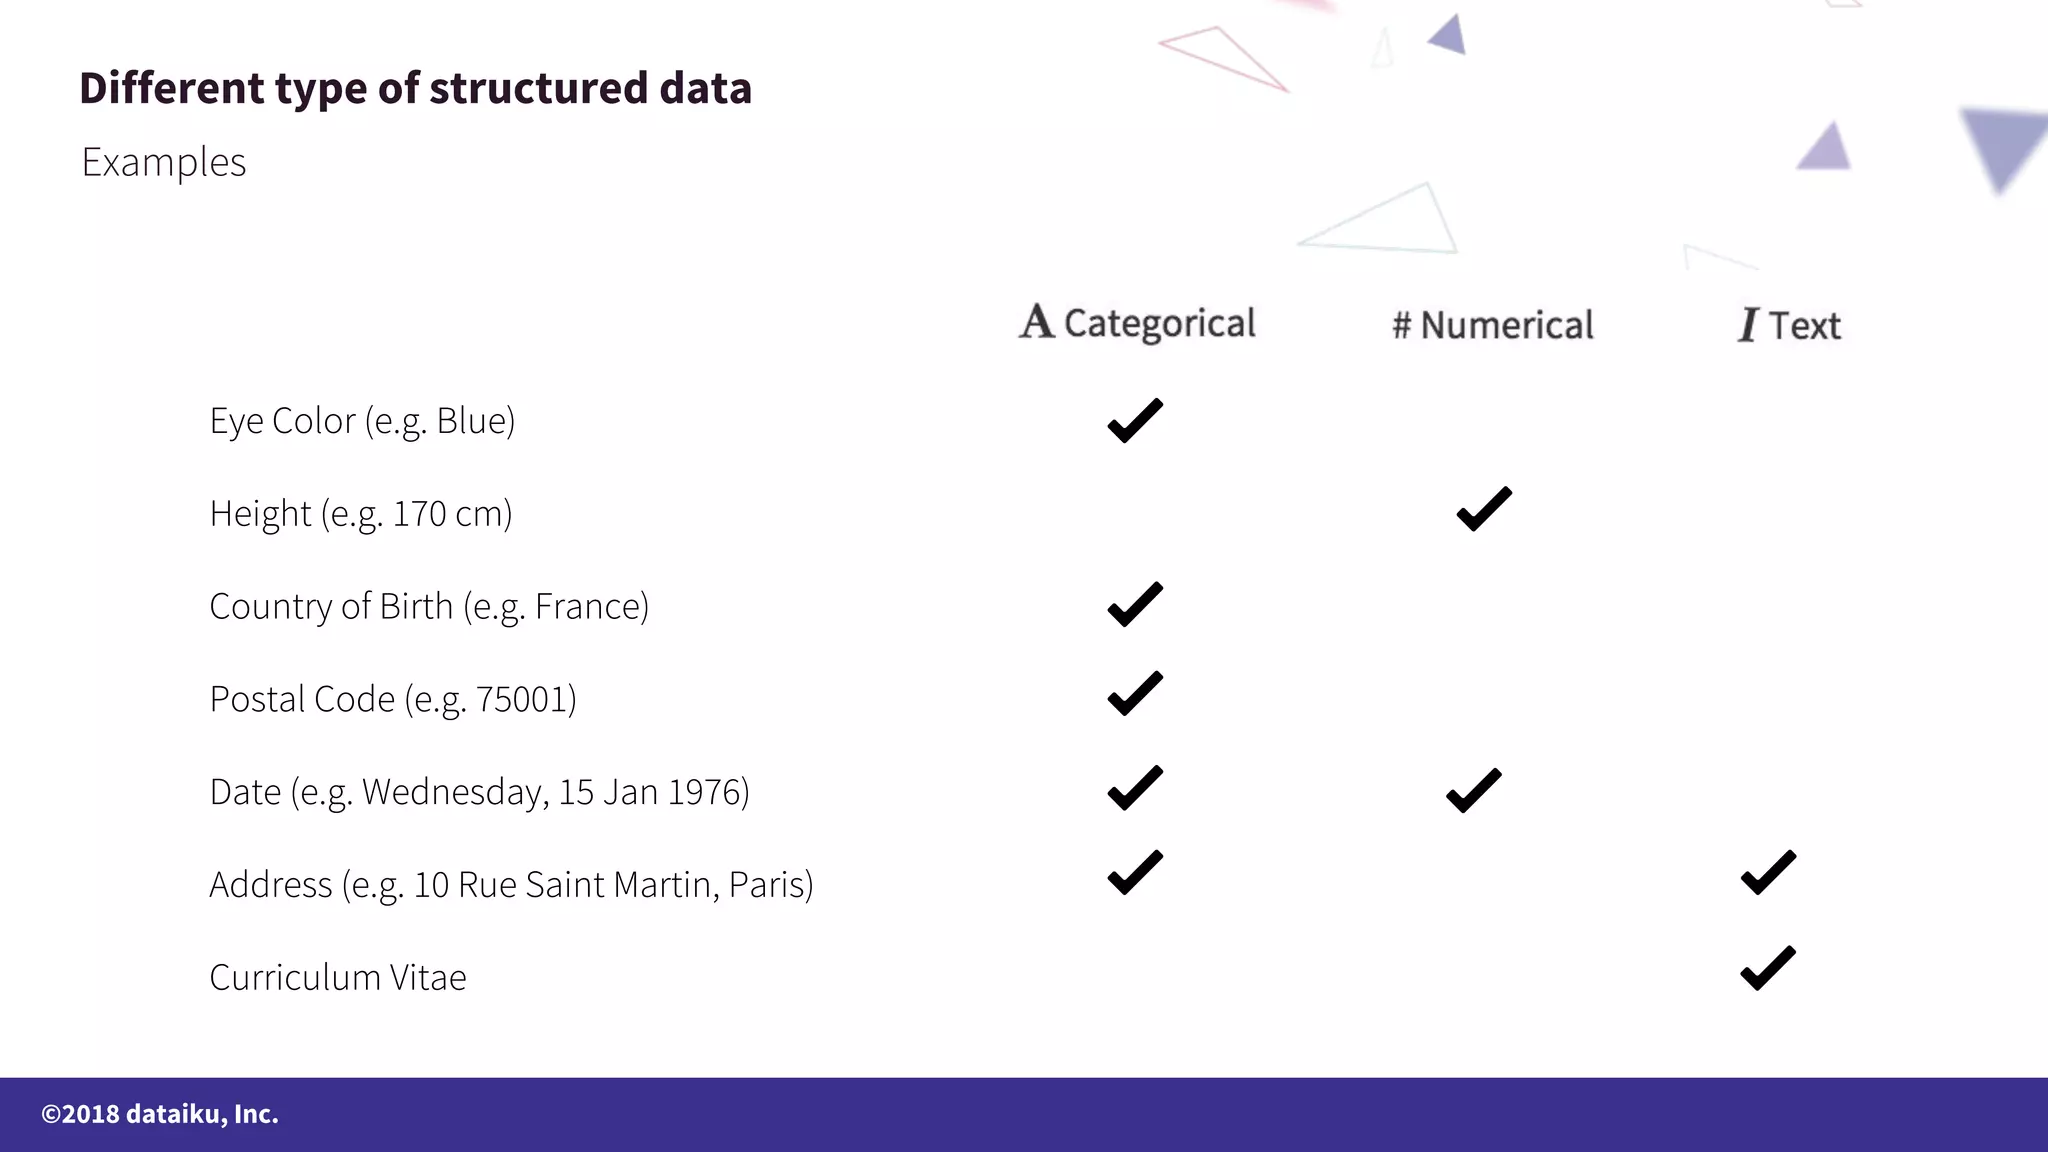

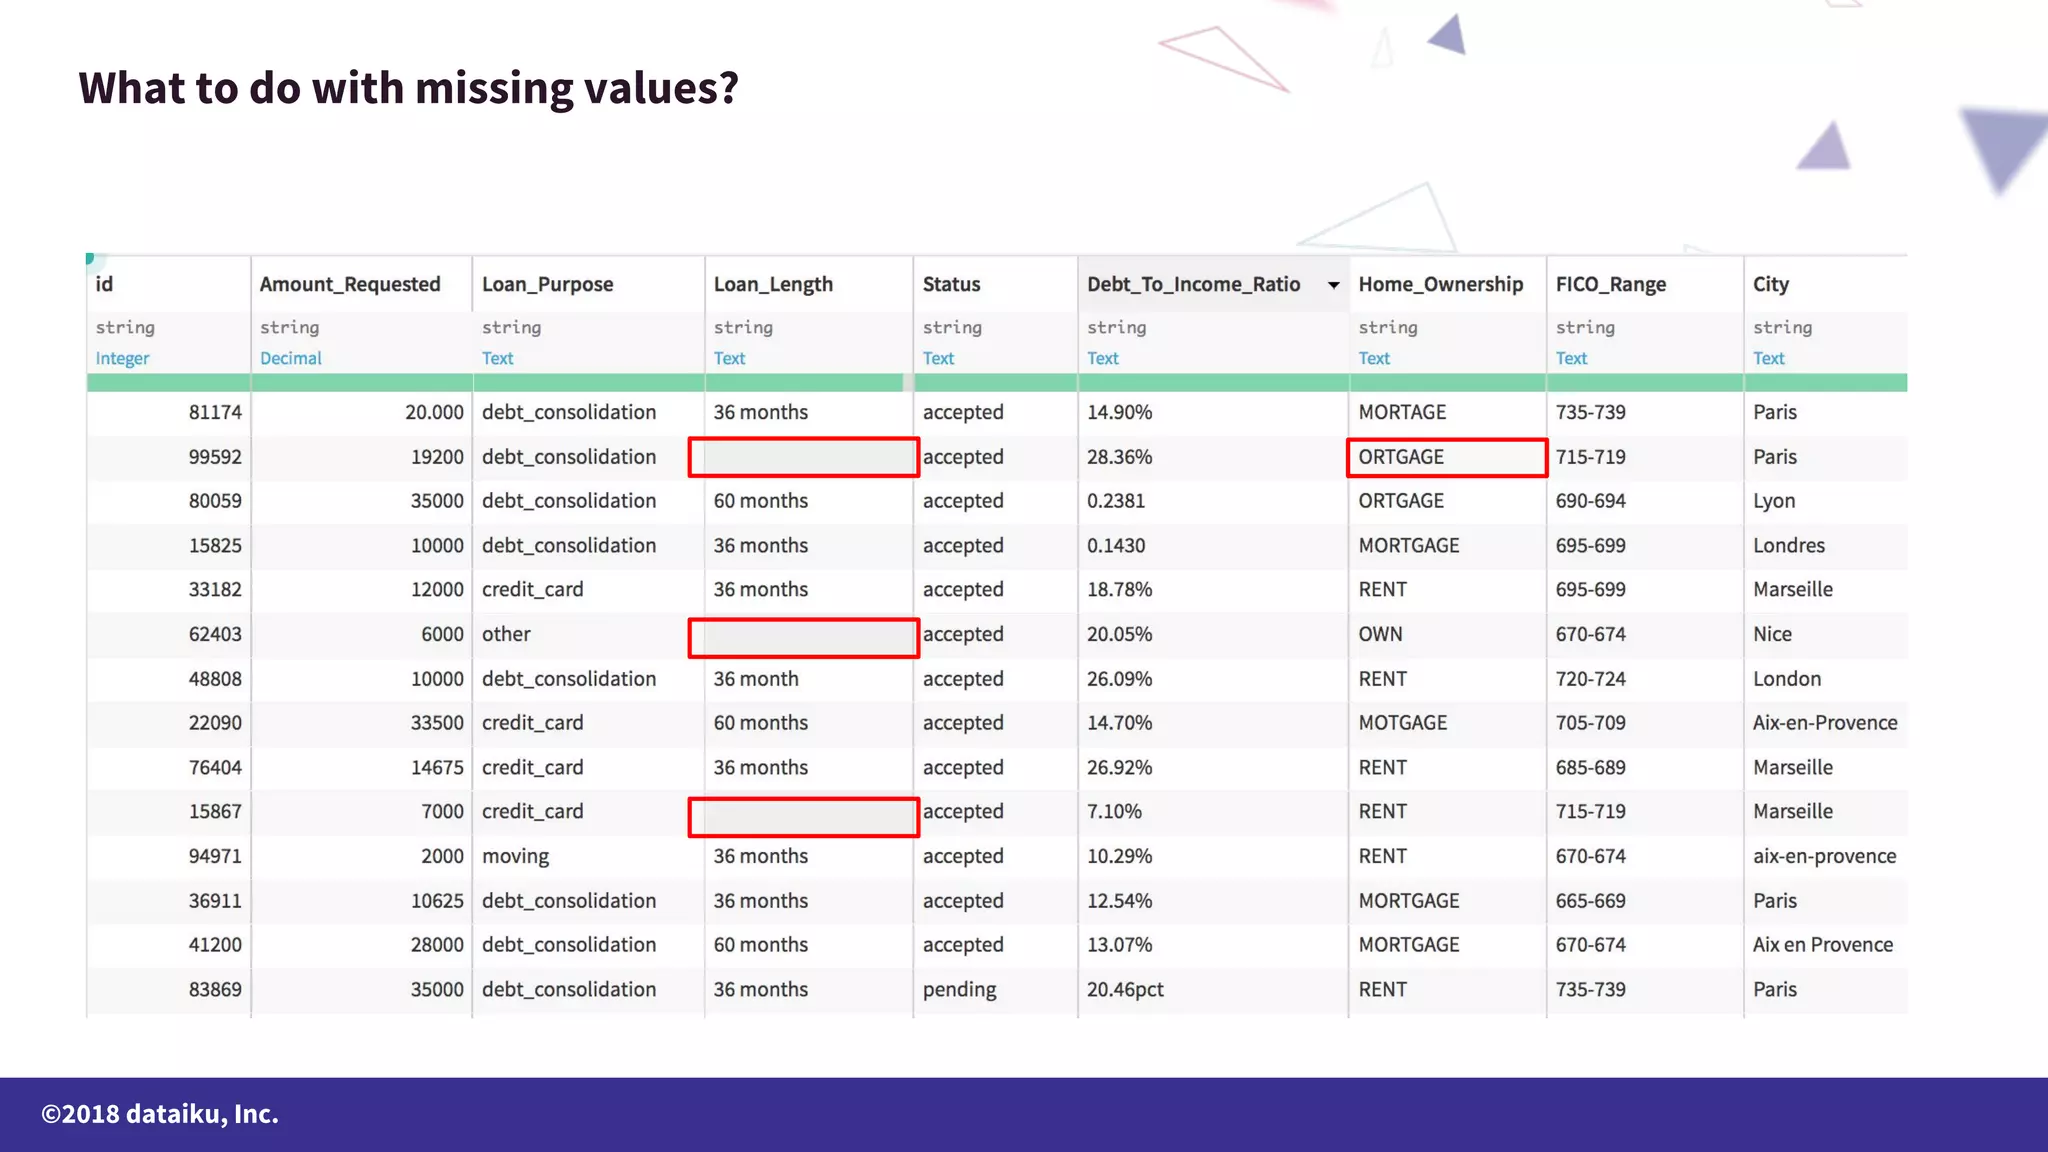
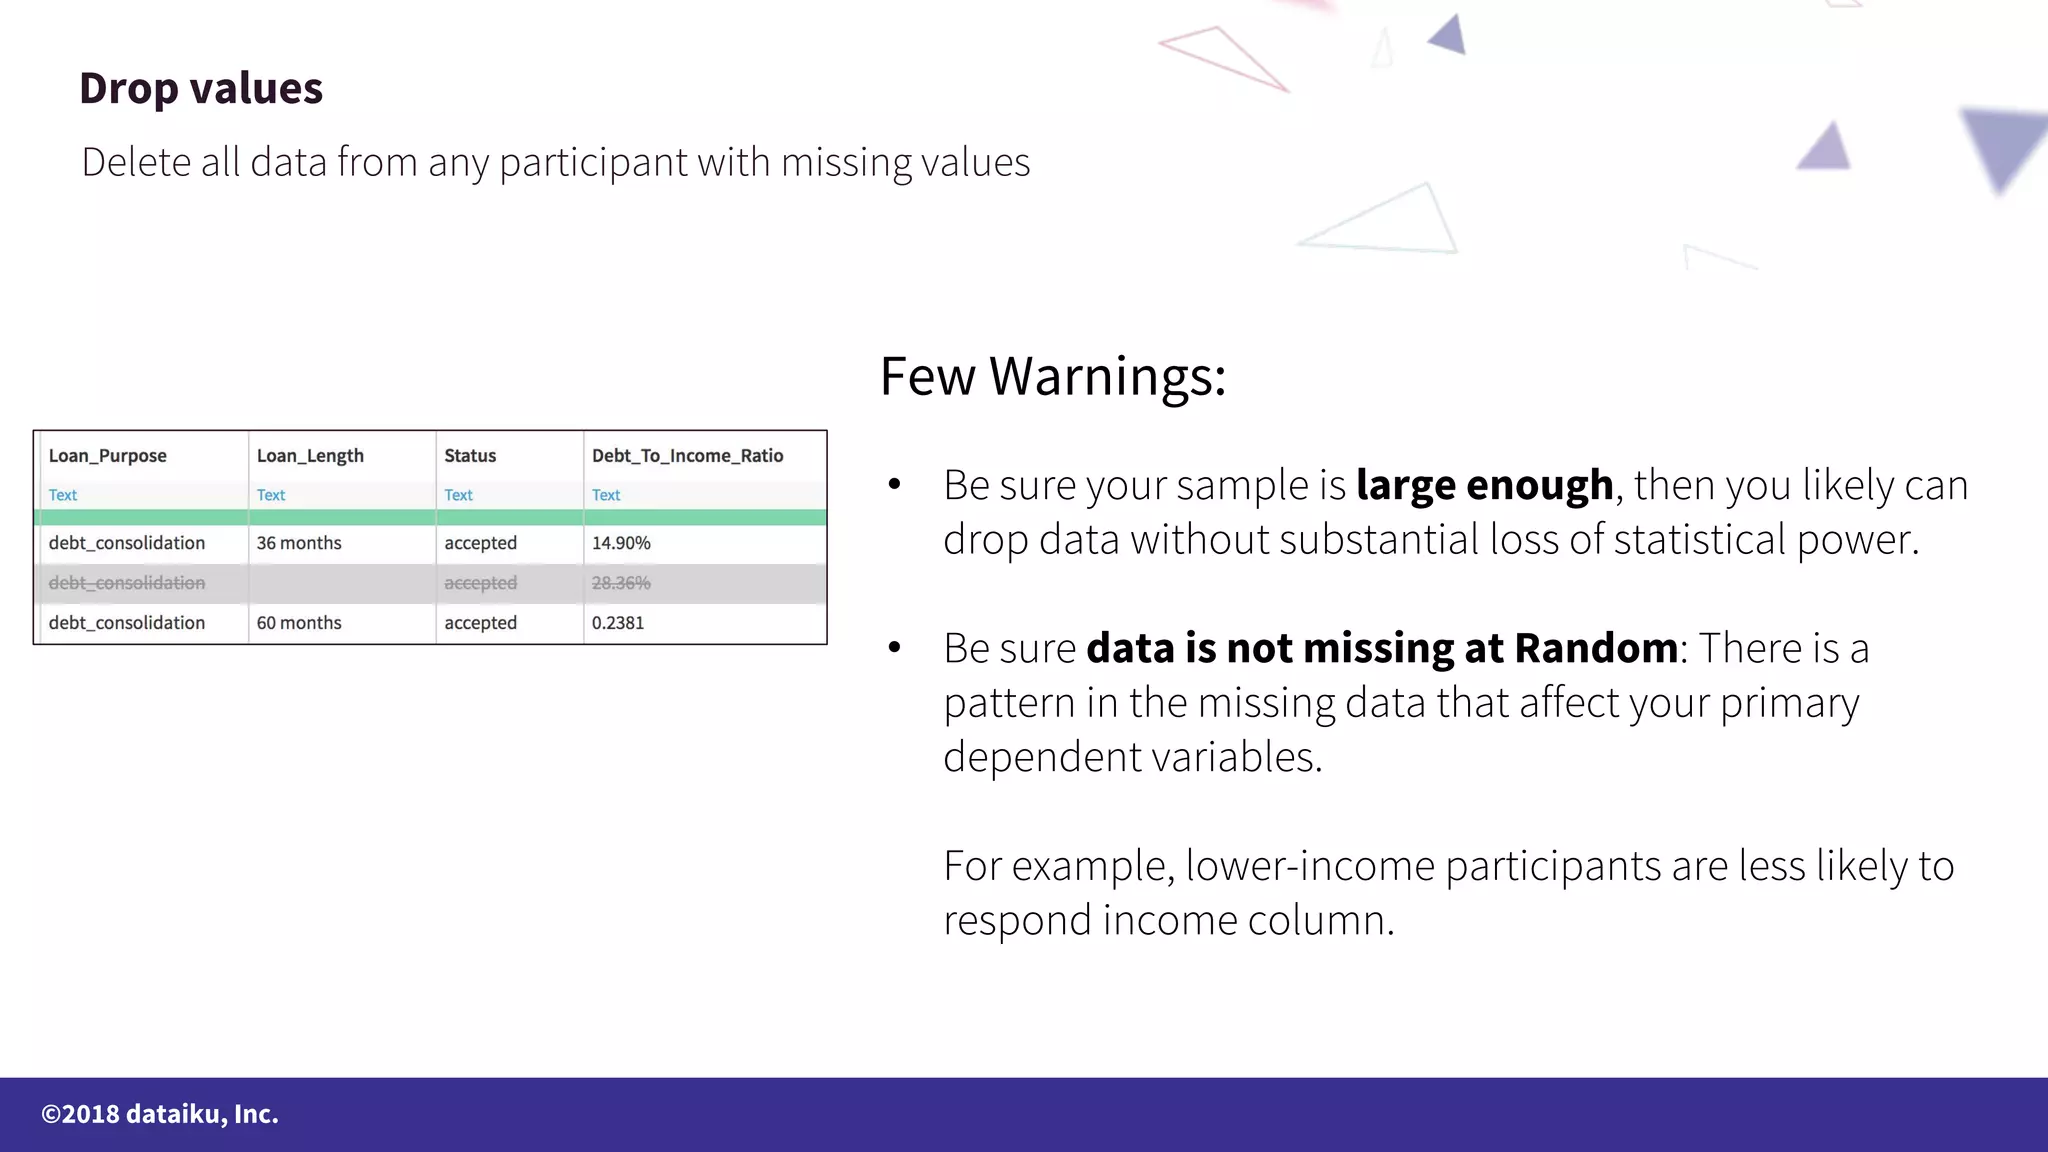
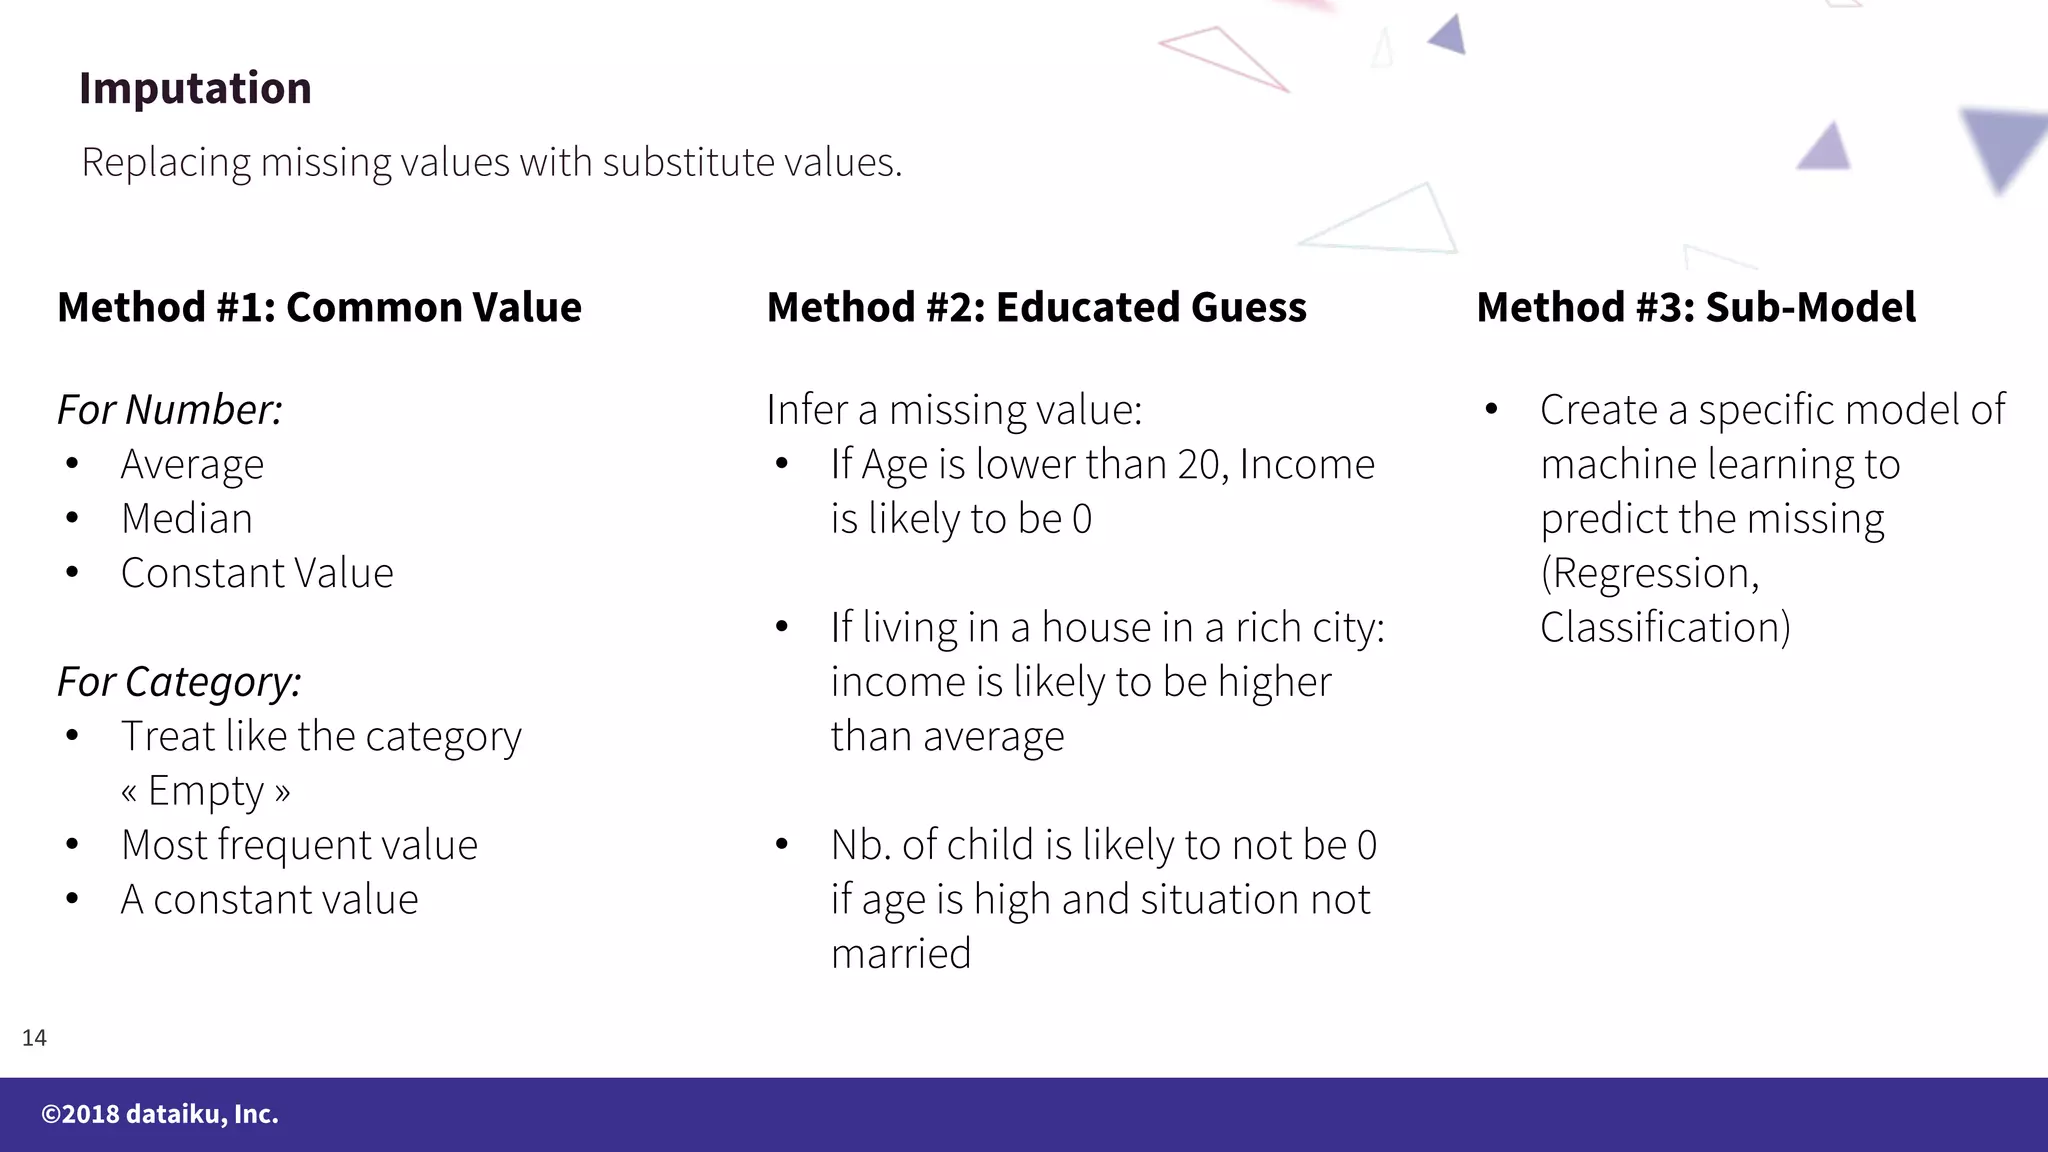
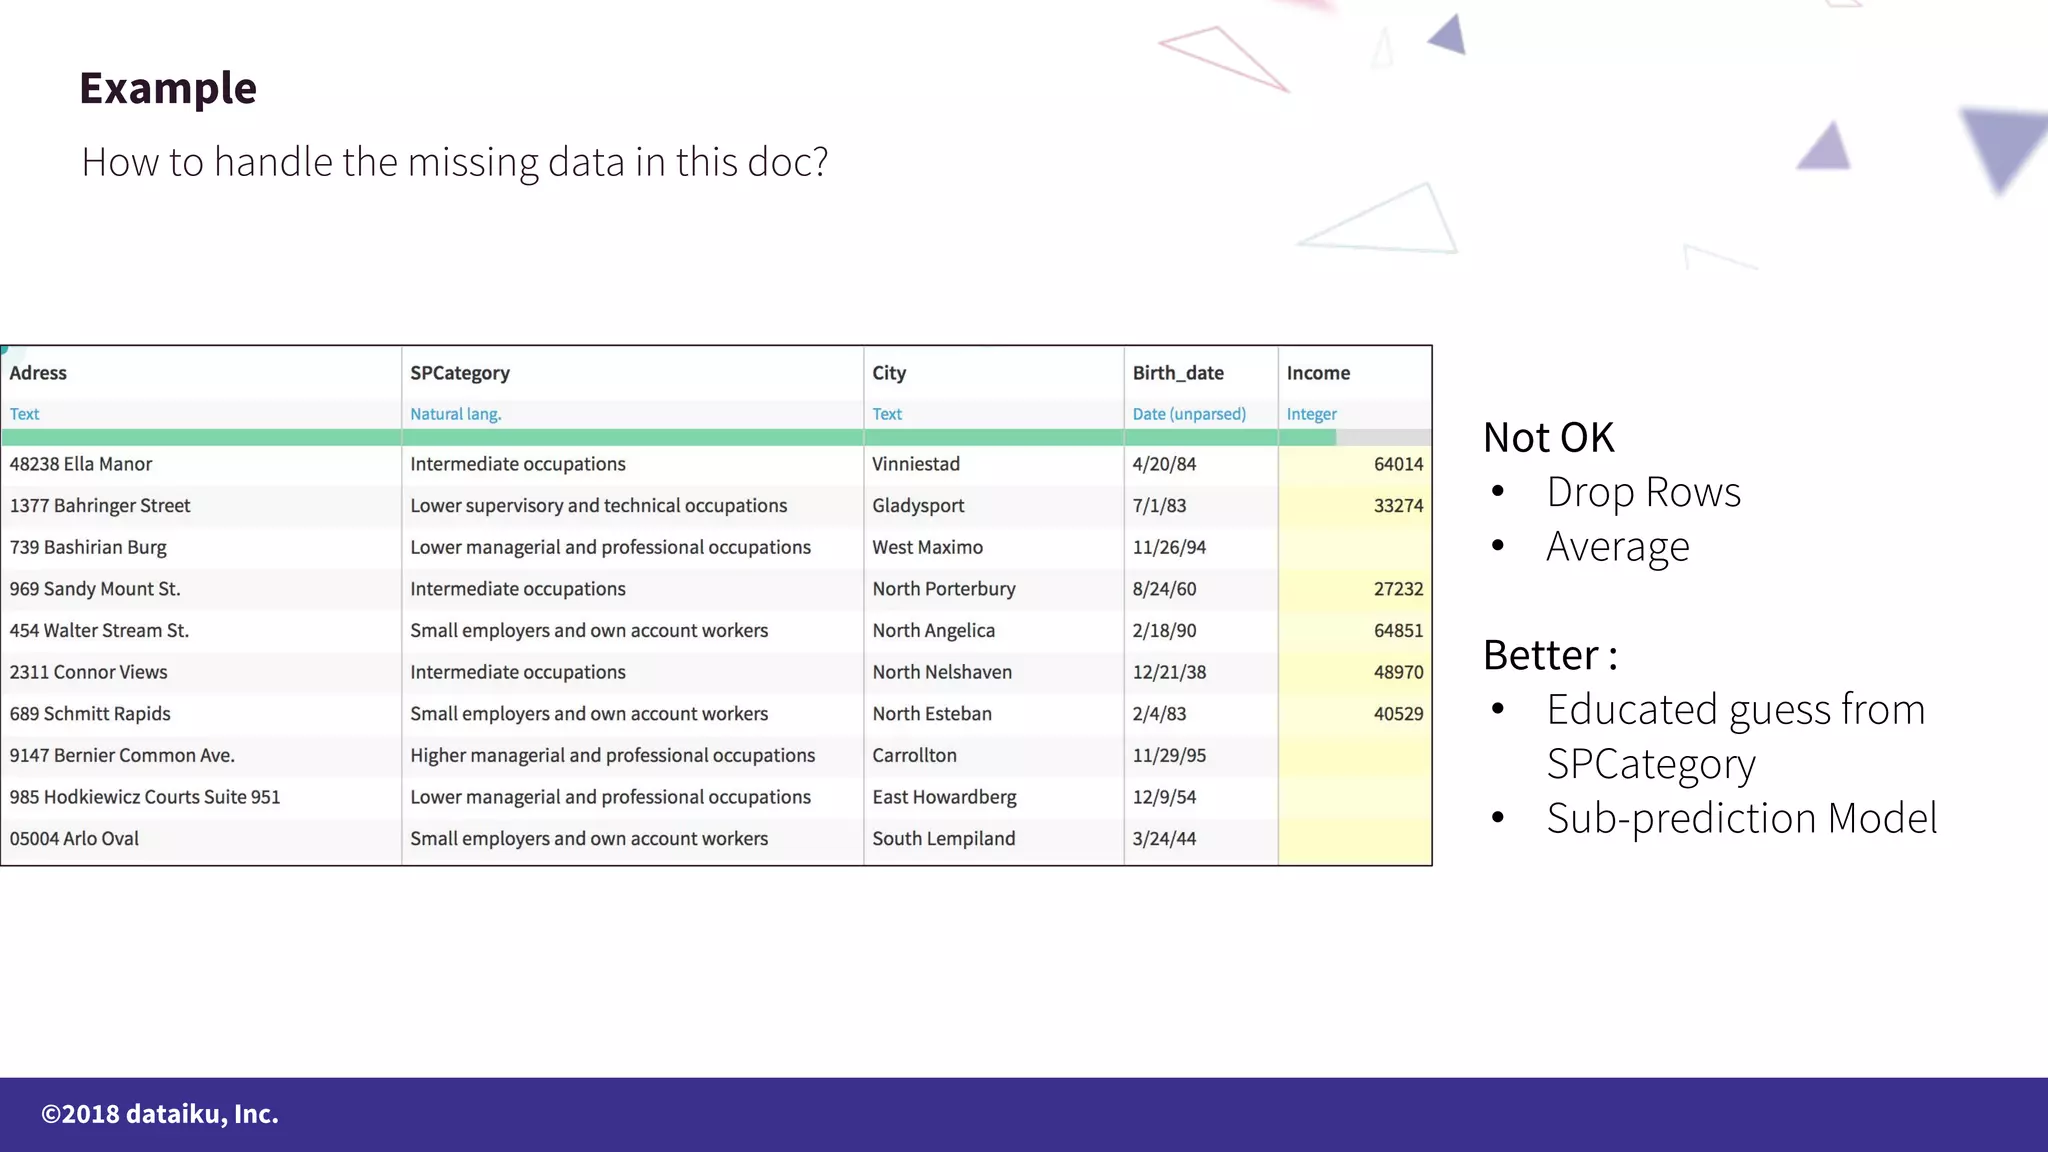
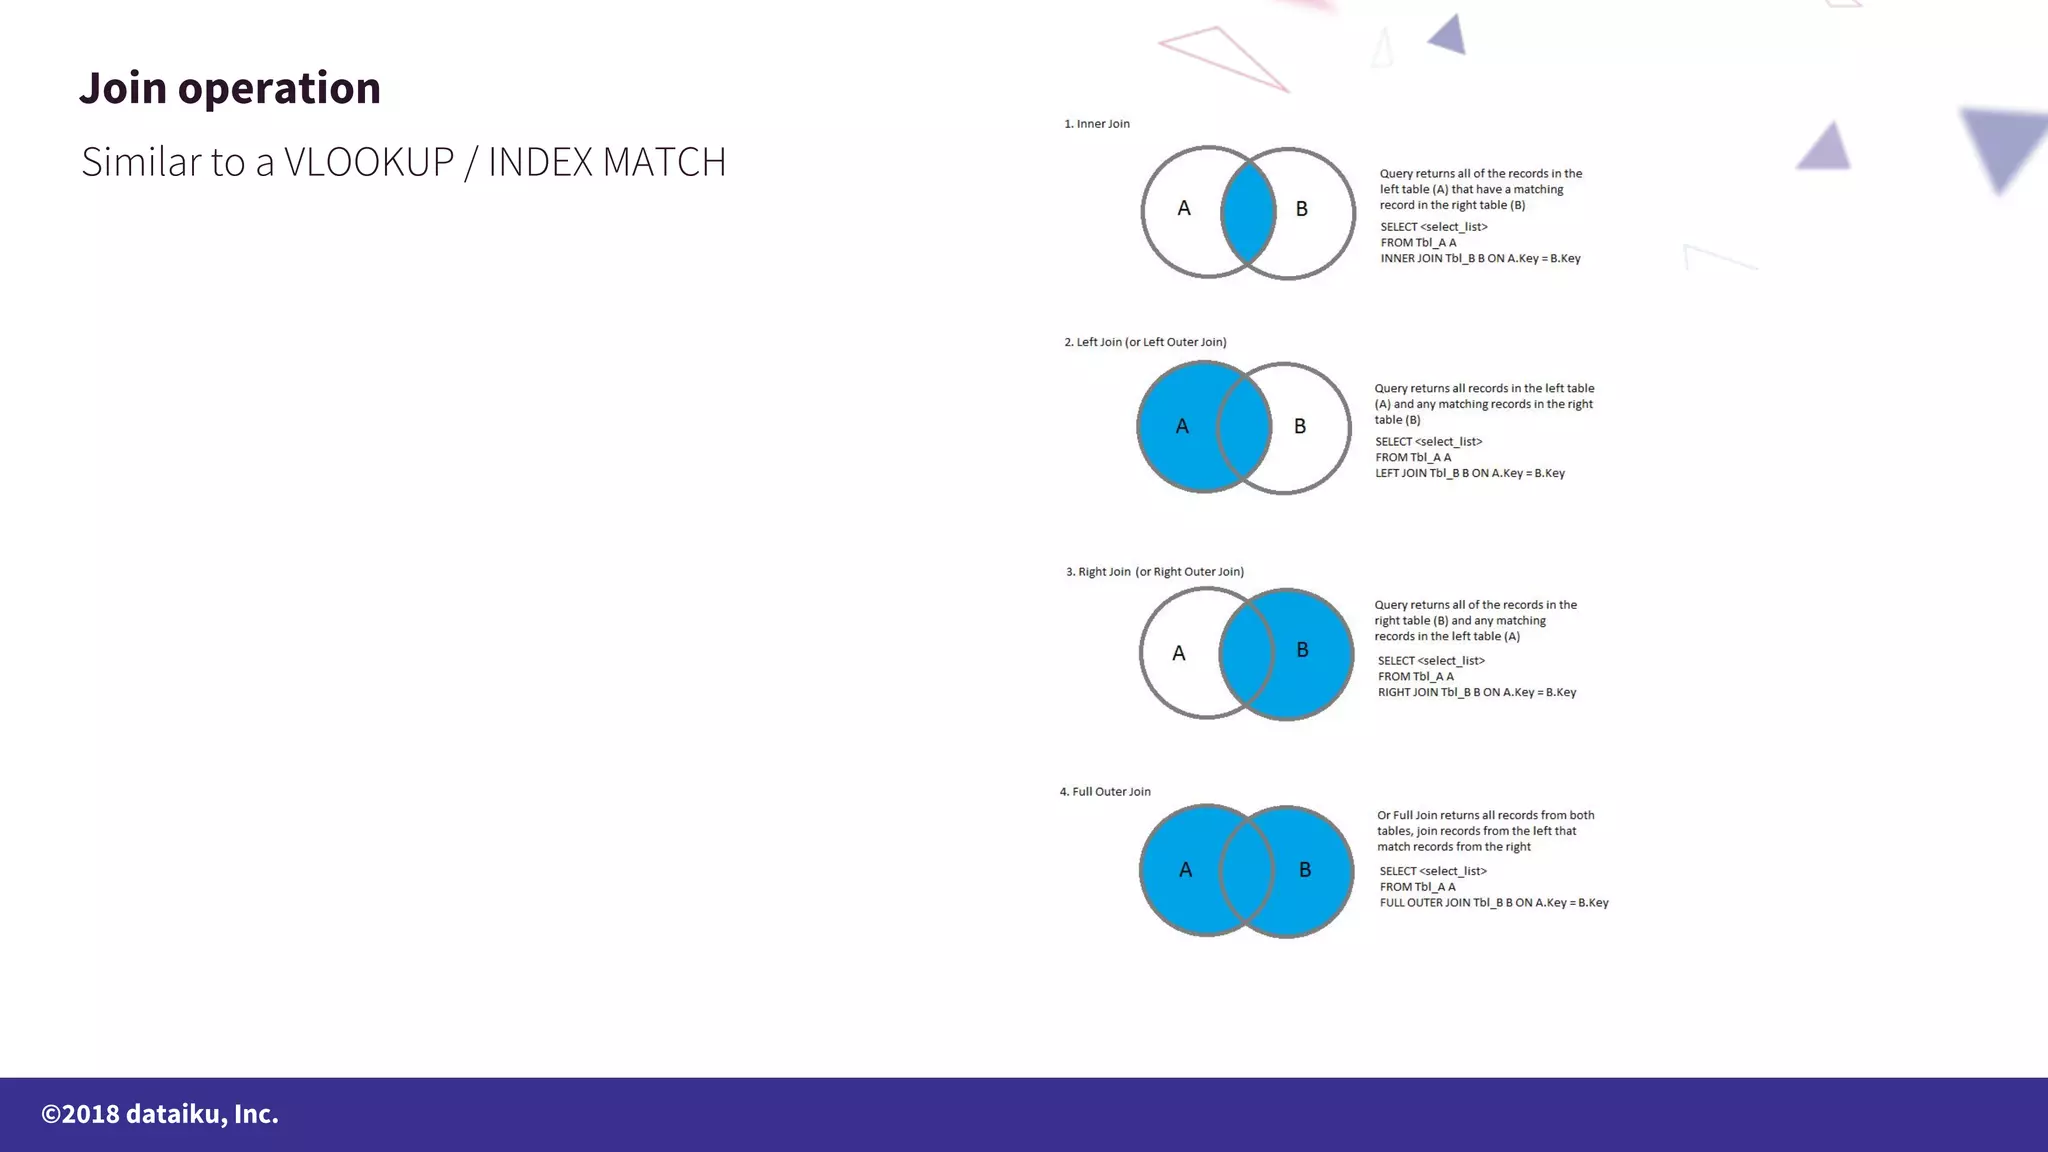
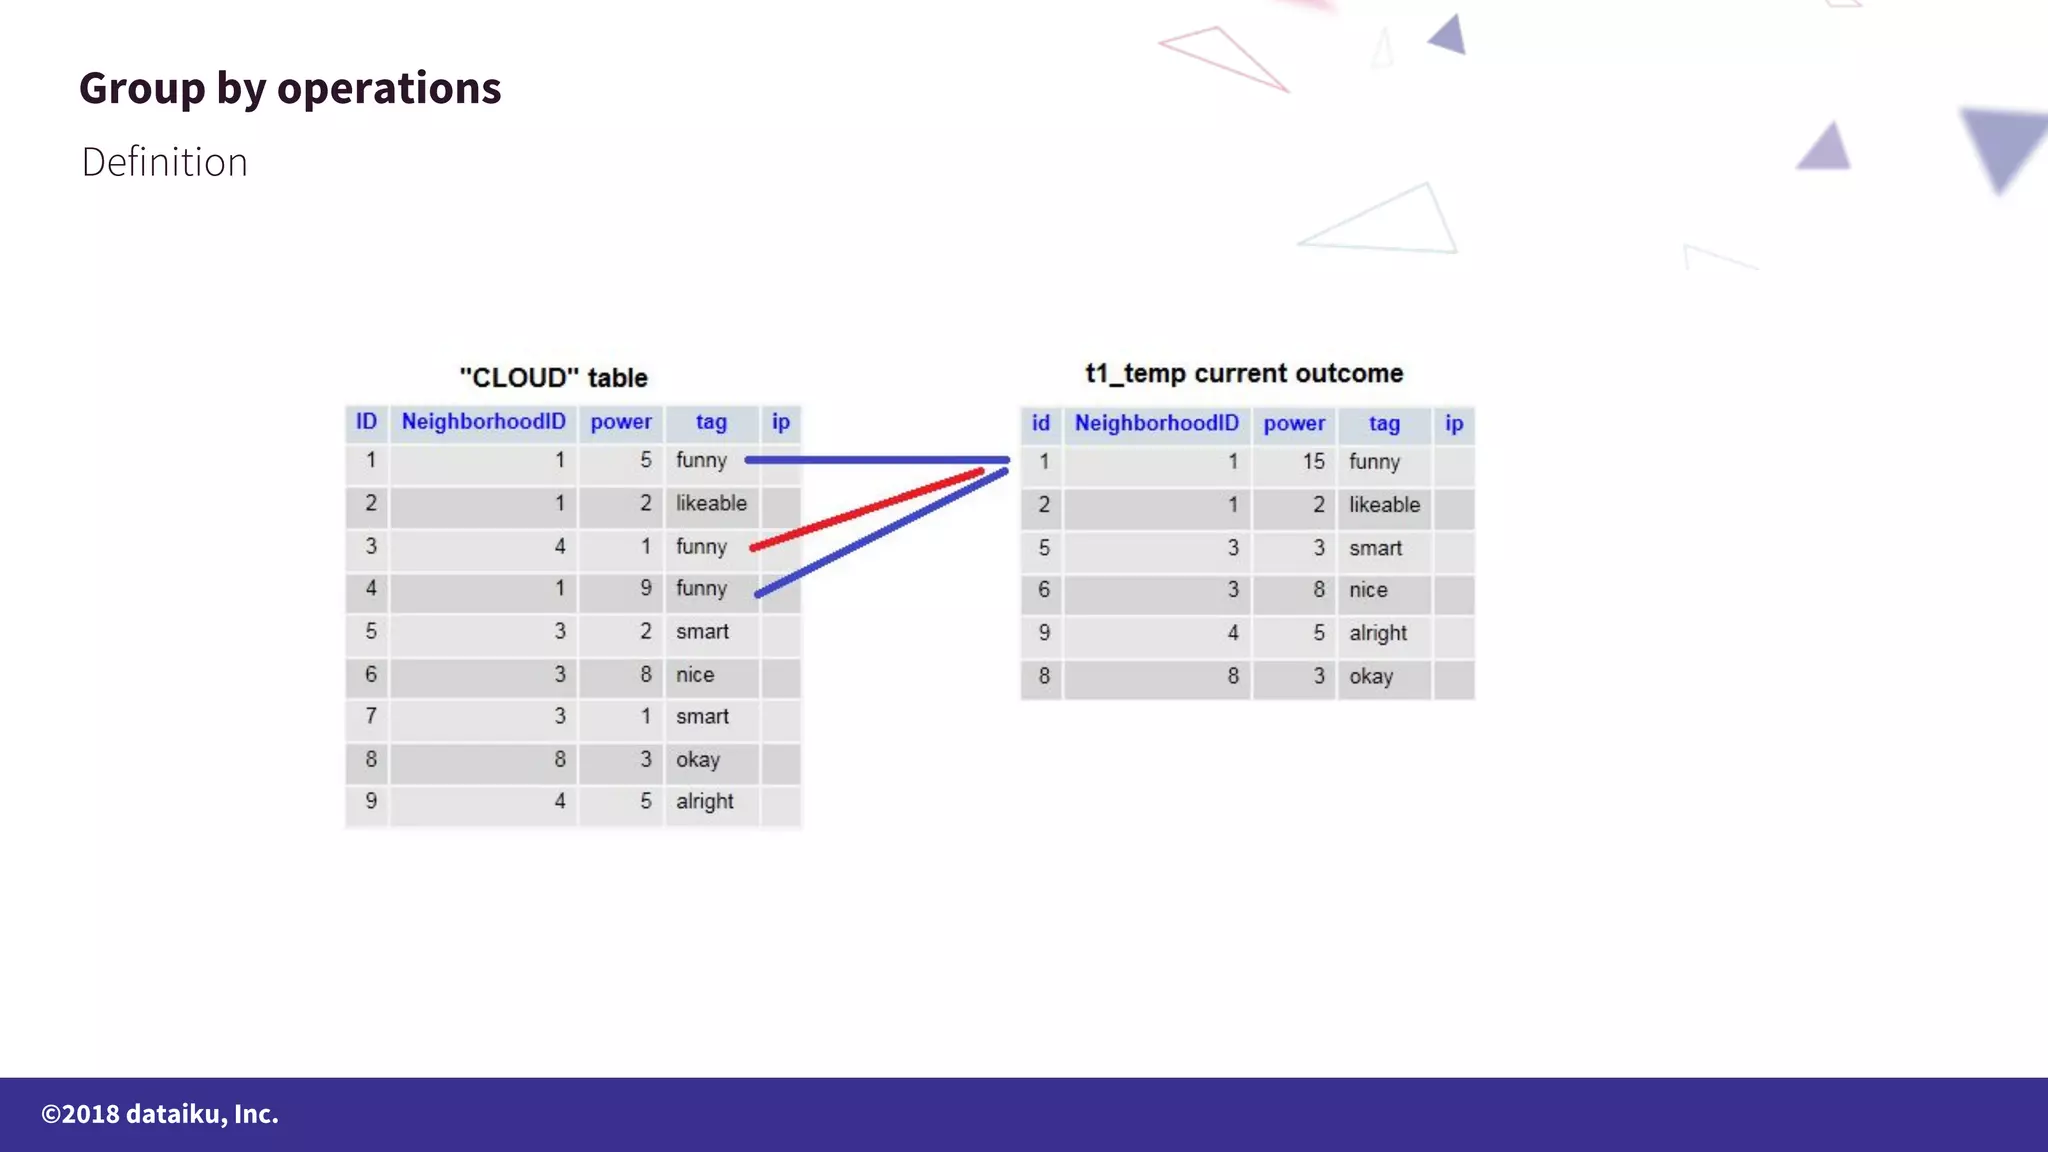


The document outlines a data science online course schedule focusing on data preparation and feature creation over four weeks. It covers fundamental concepts such as data types, handling missing values, and various data storage methods while emphasizing the importance of data preparation in a data science workflow. Additionally, it introduces techniques for data grouping, joining, dummification, and rescaling for model building.