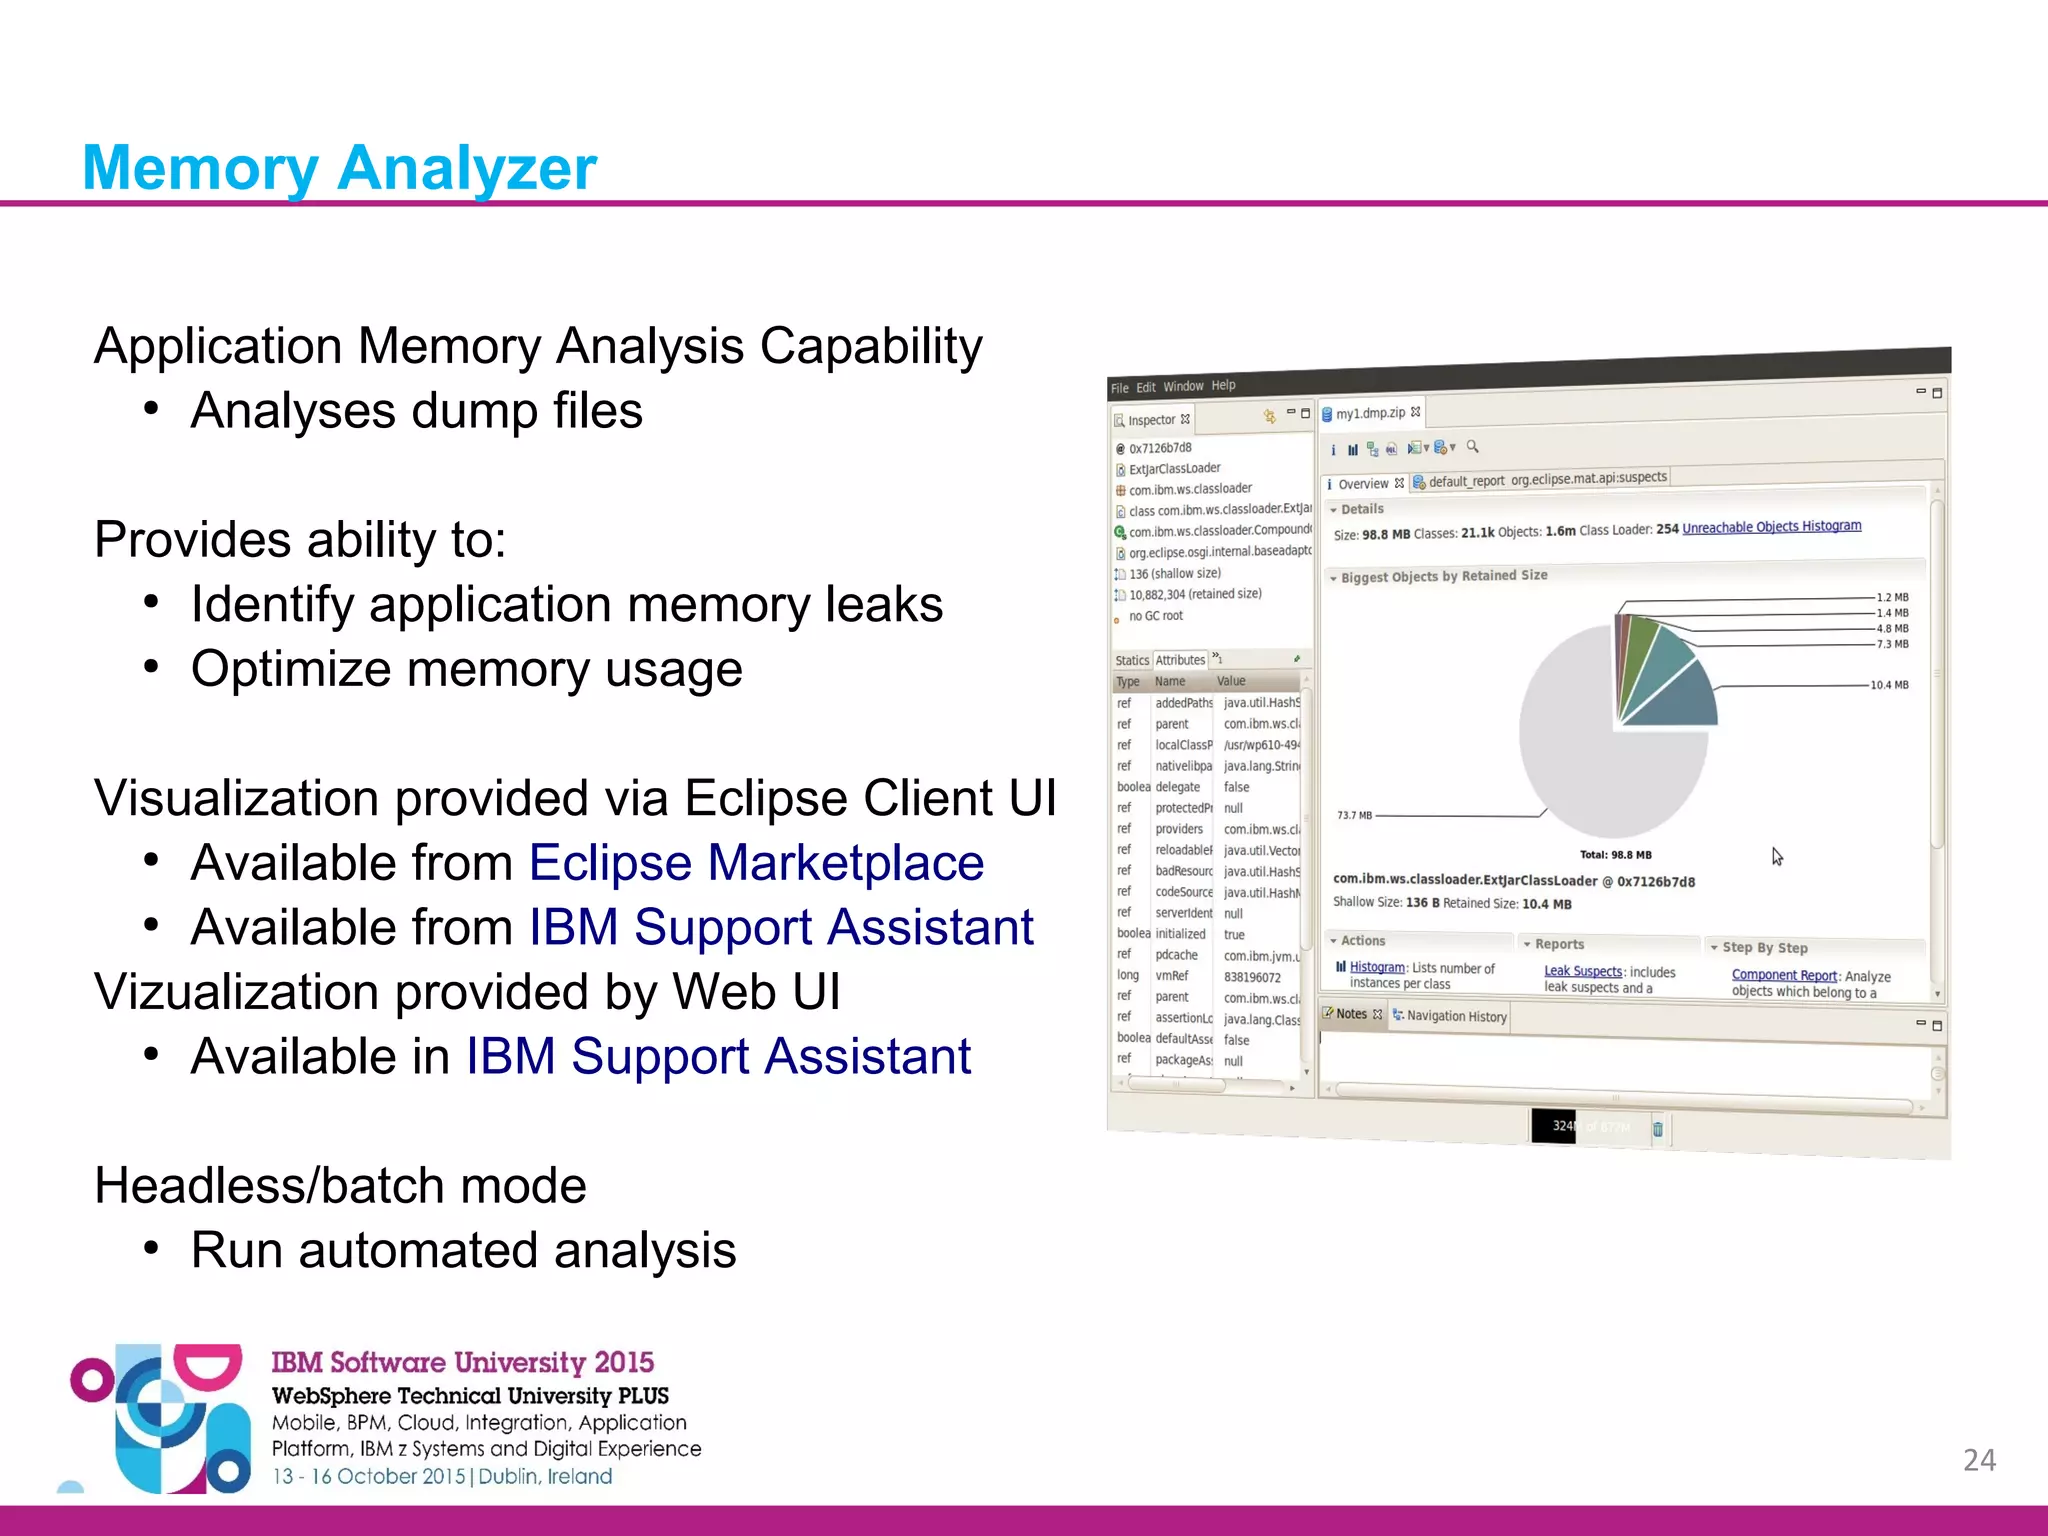
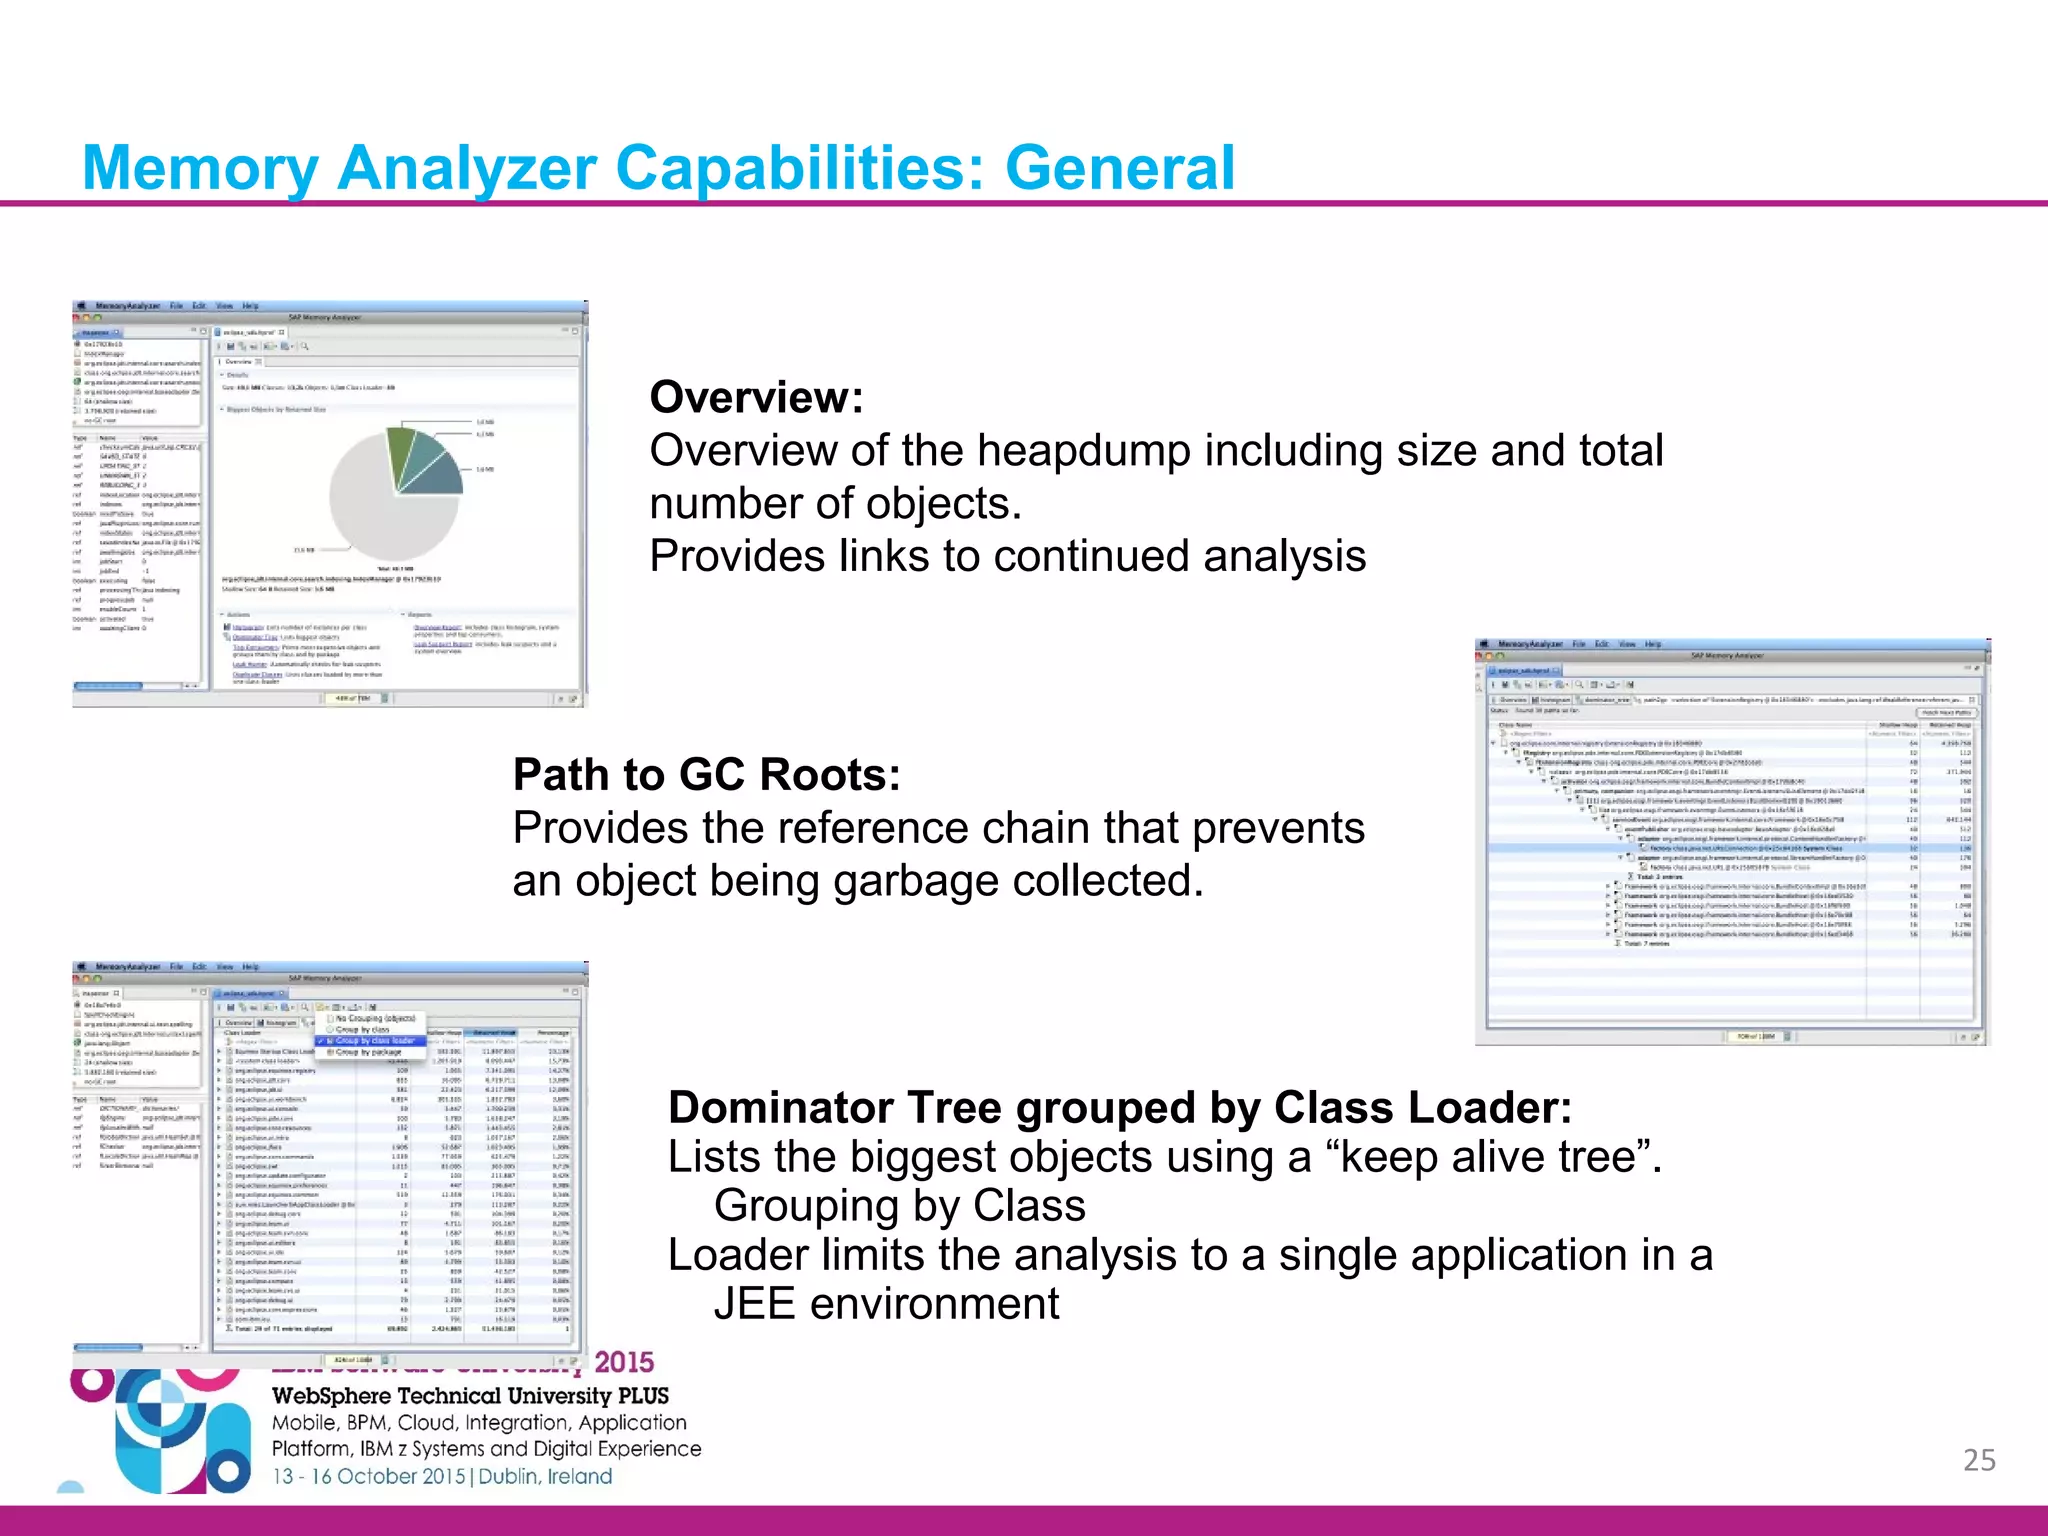
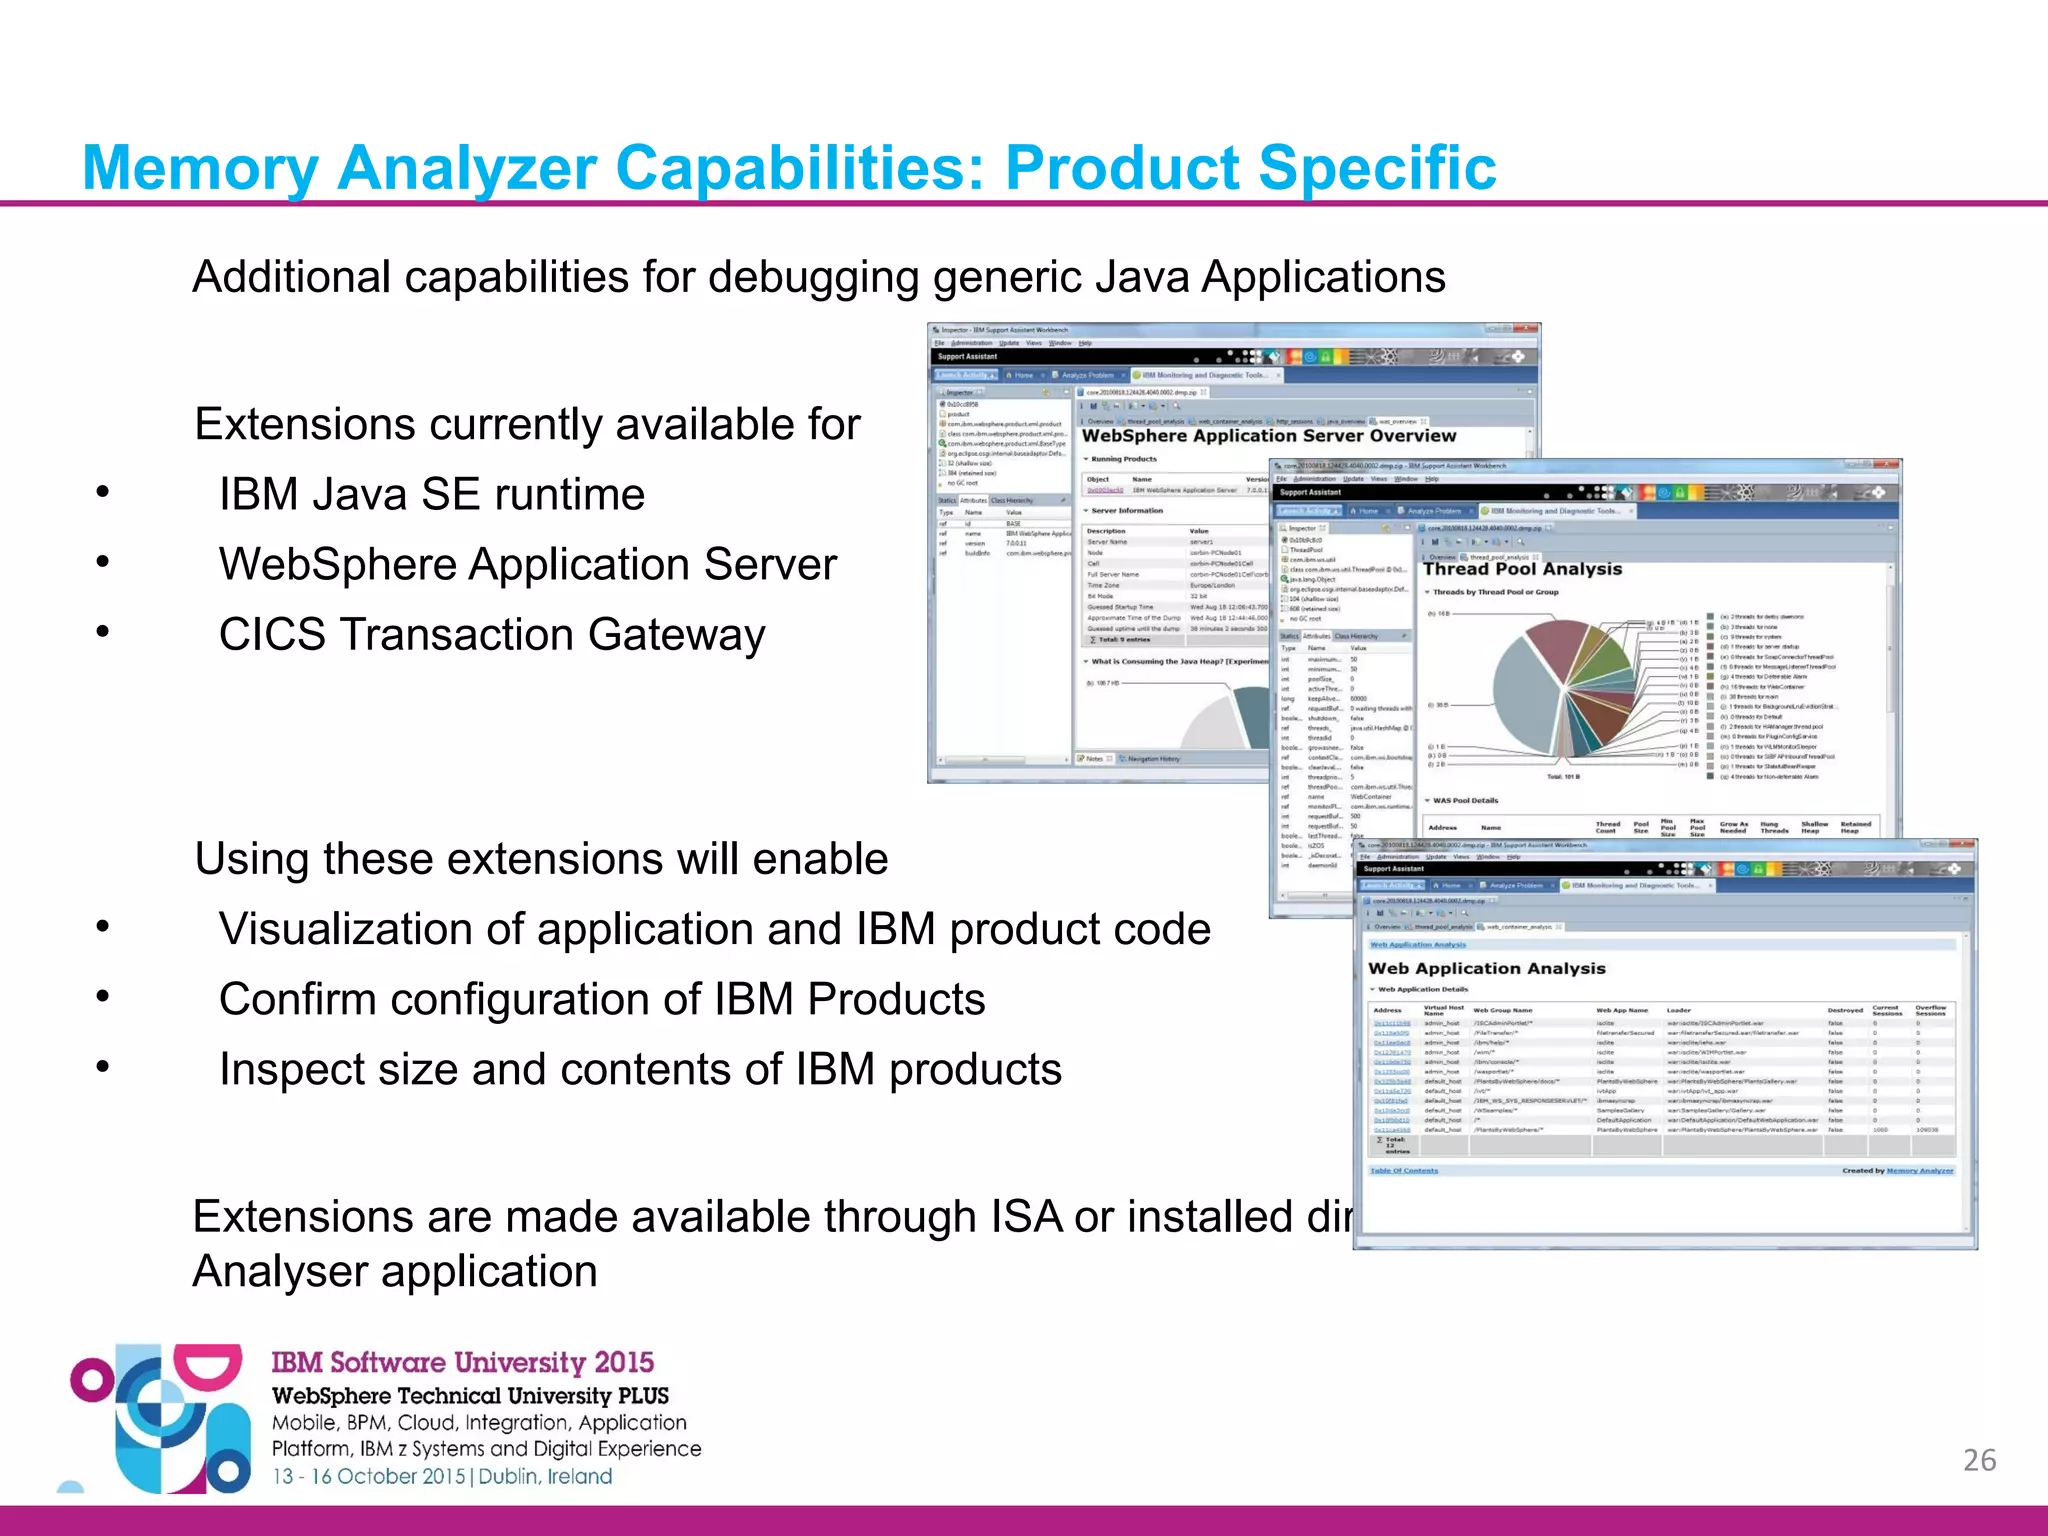
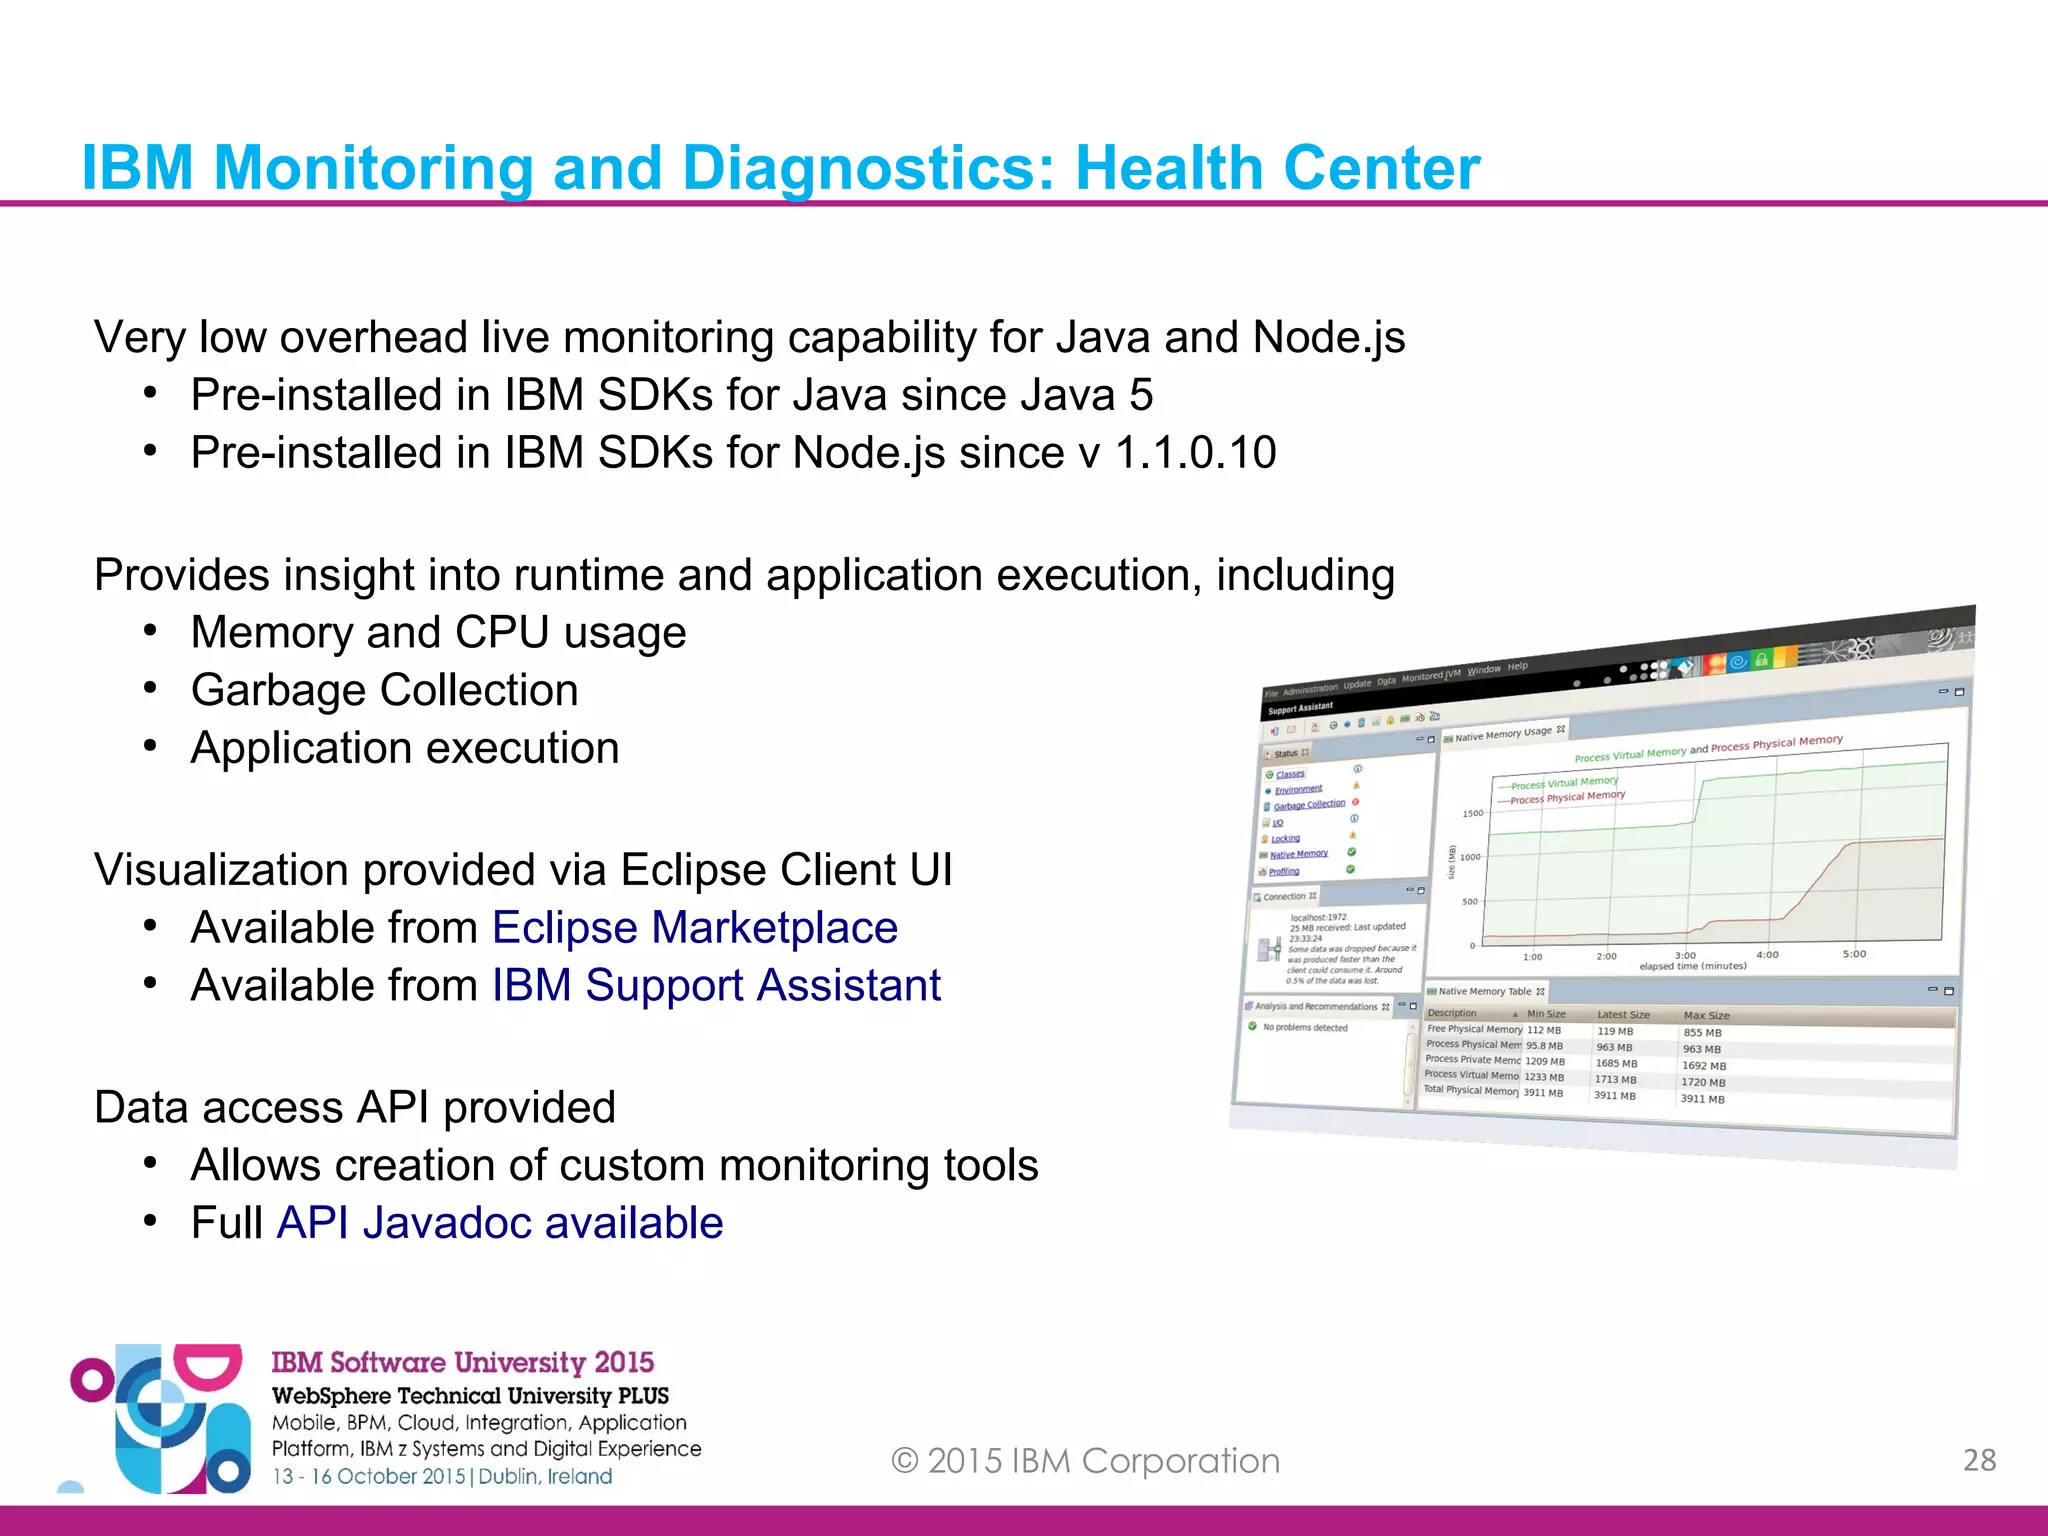
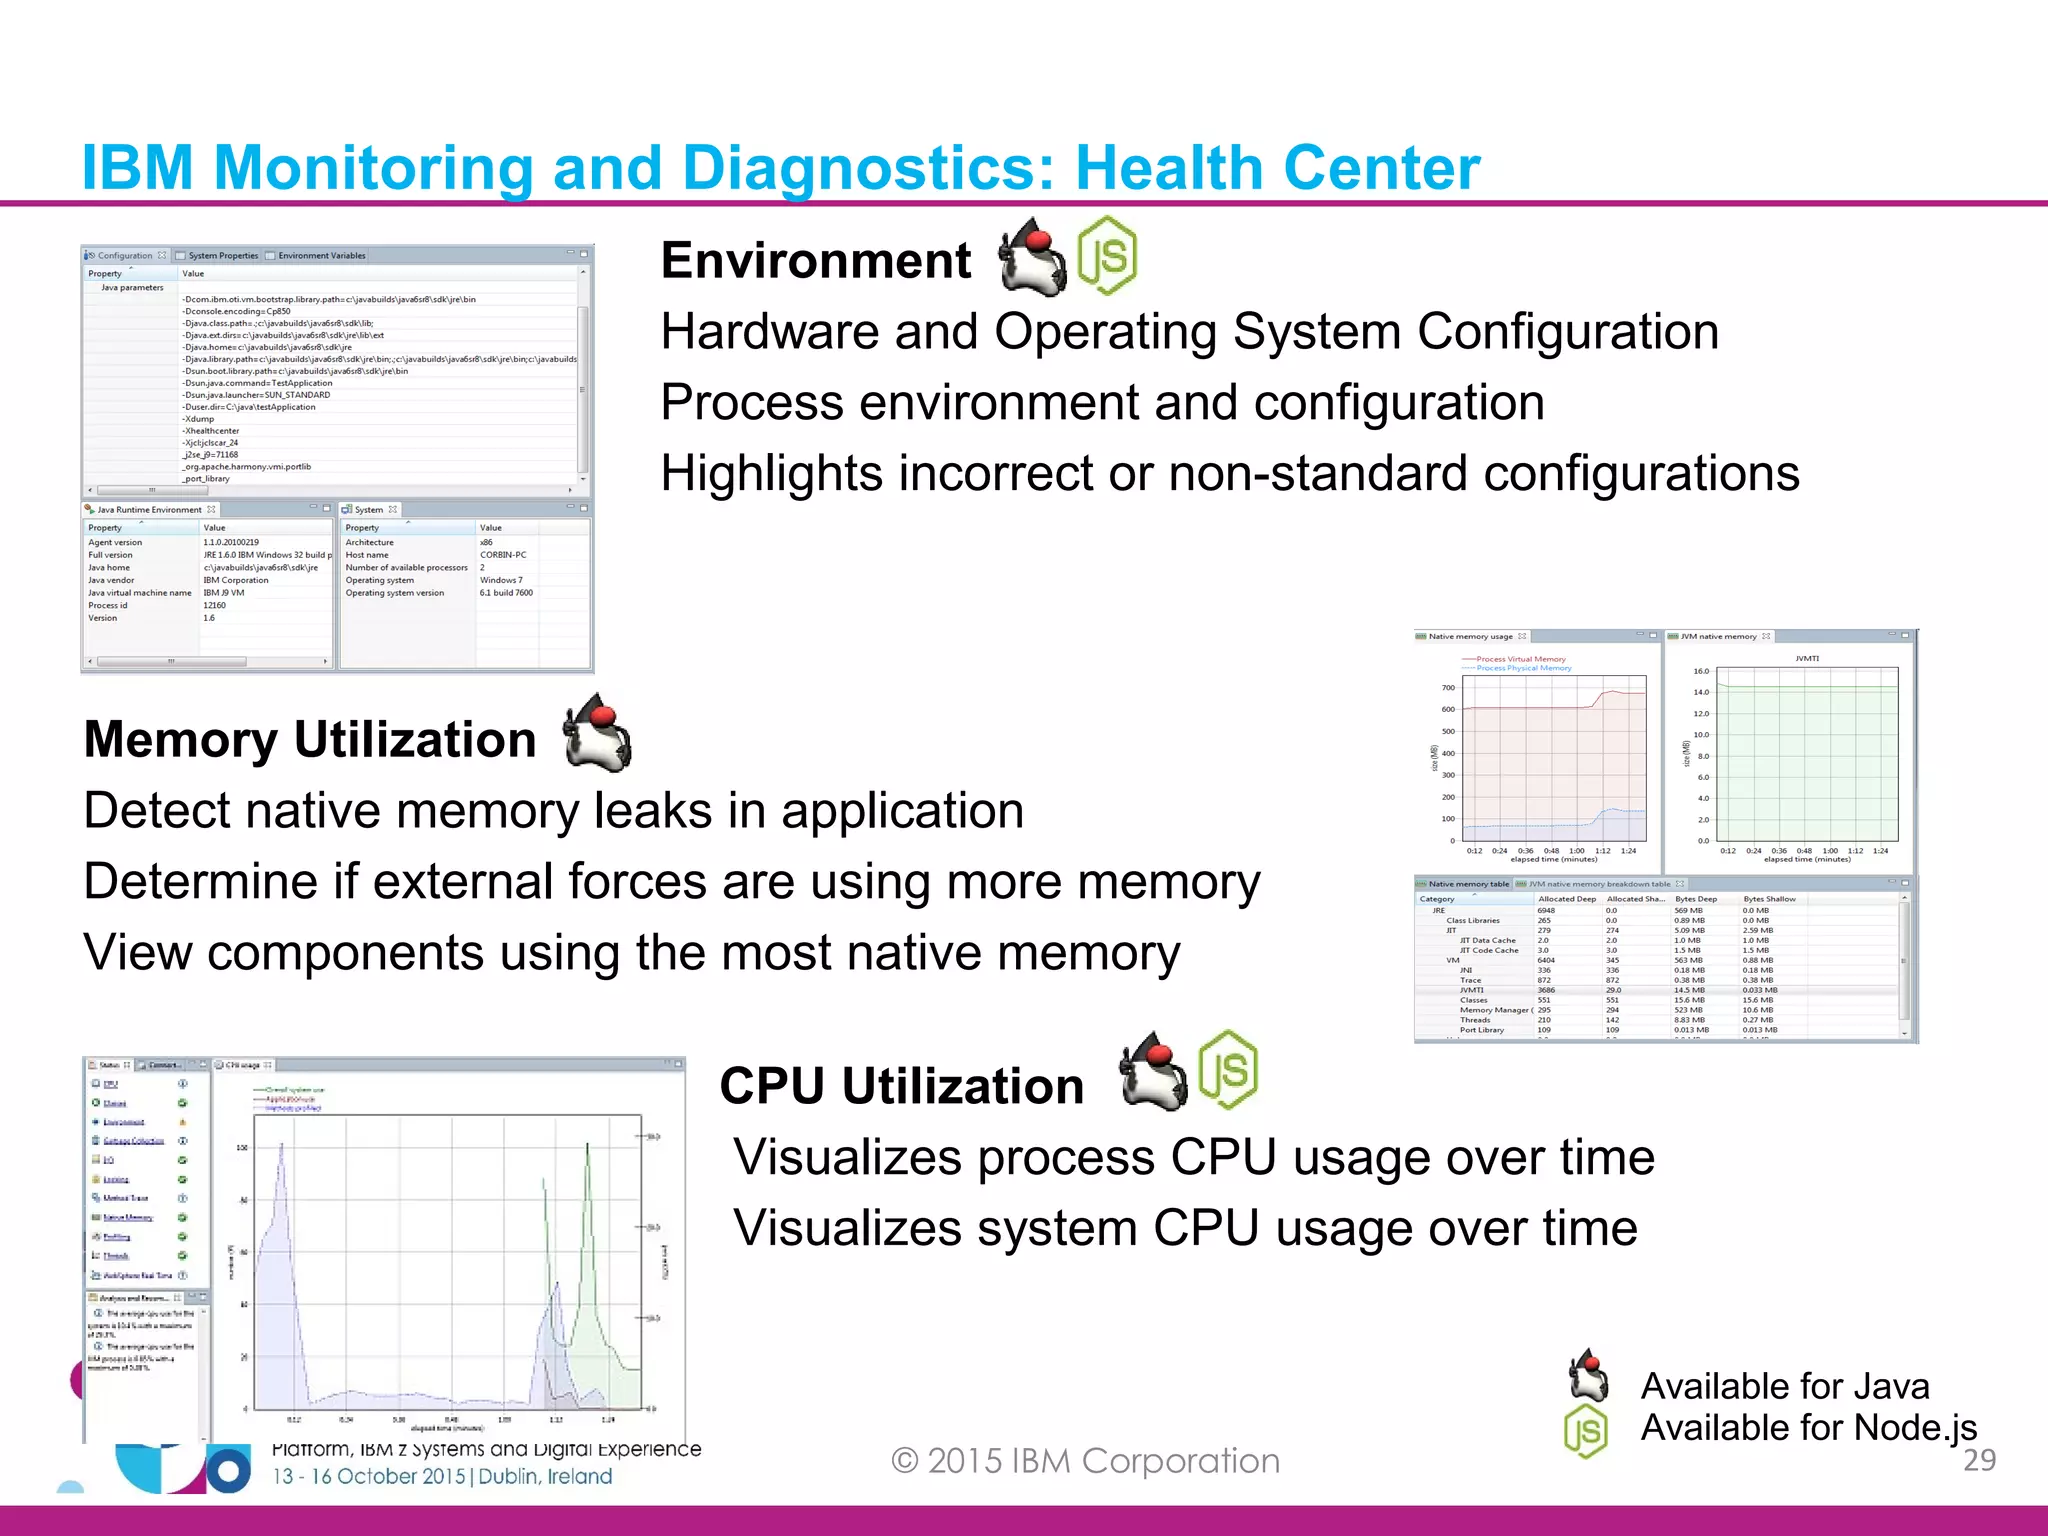
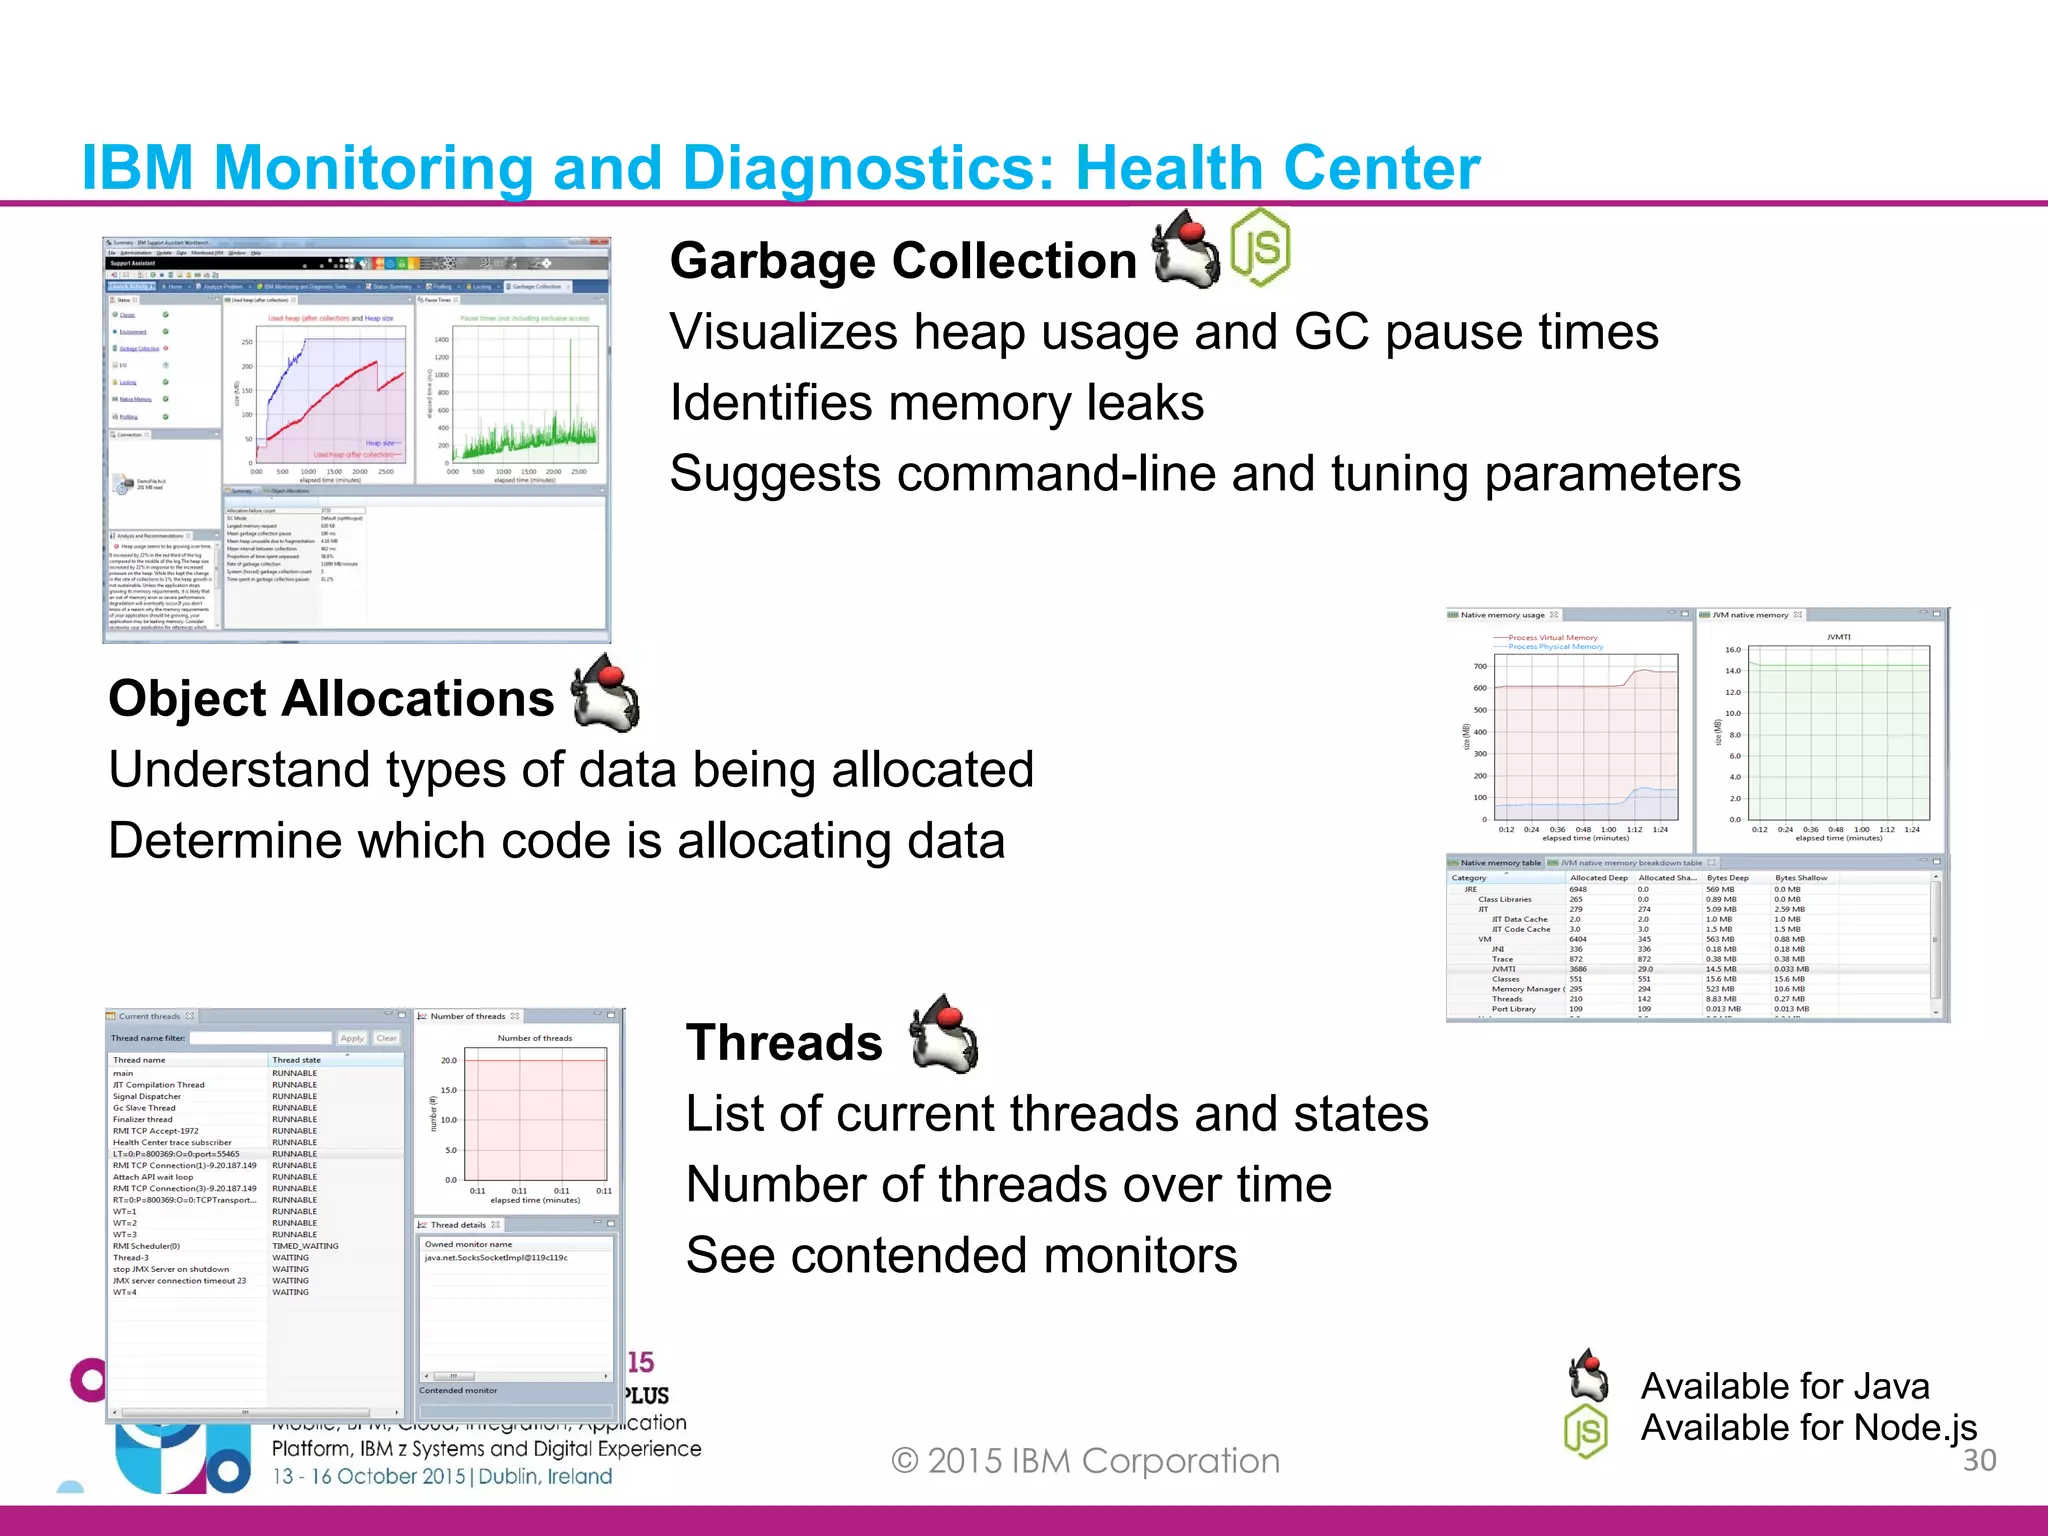
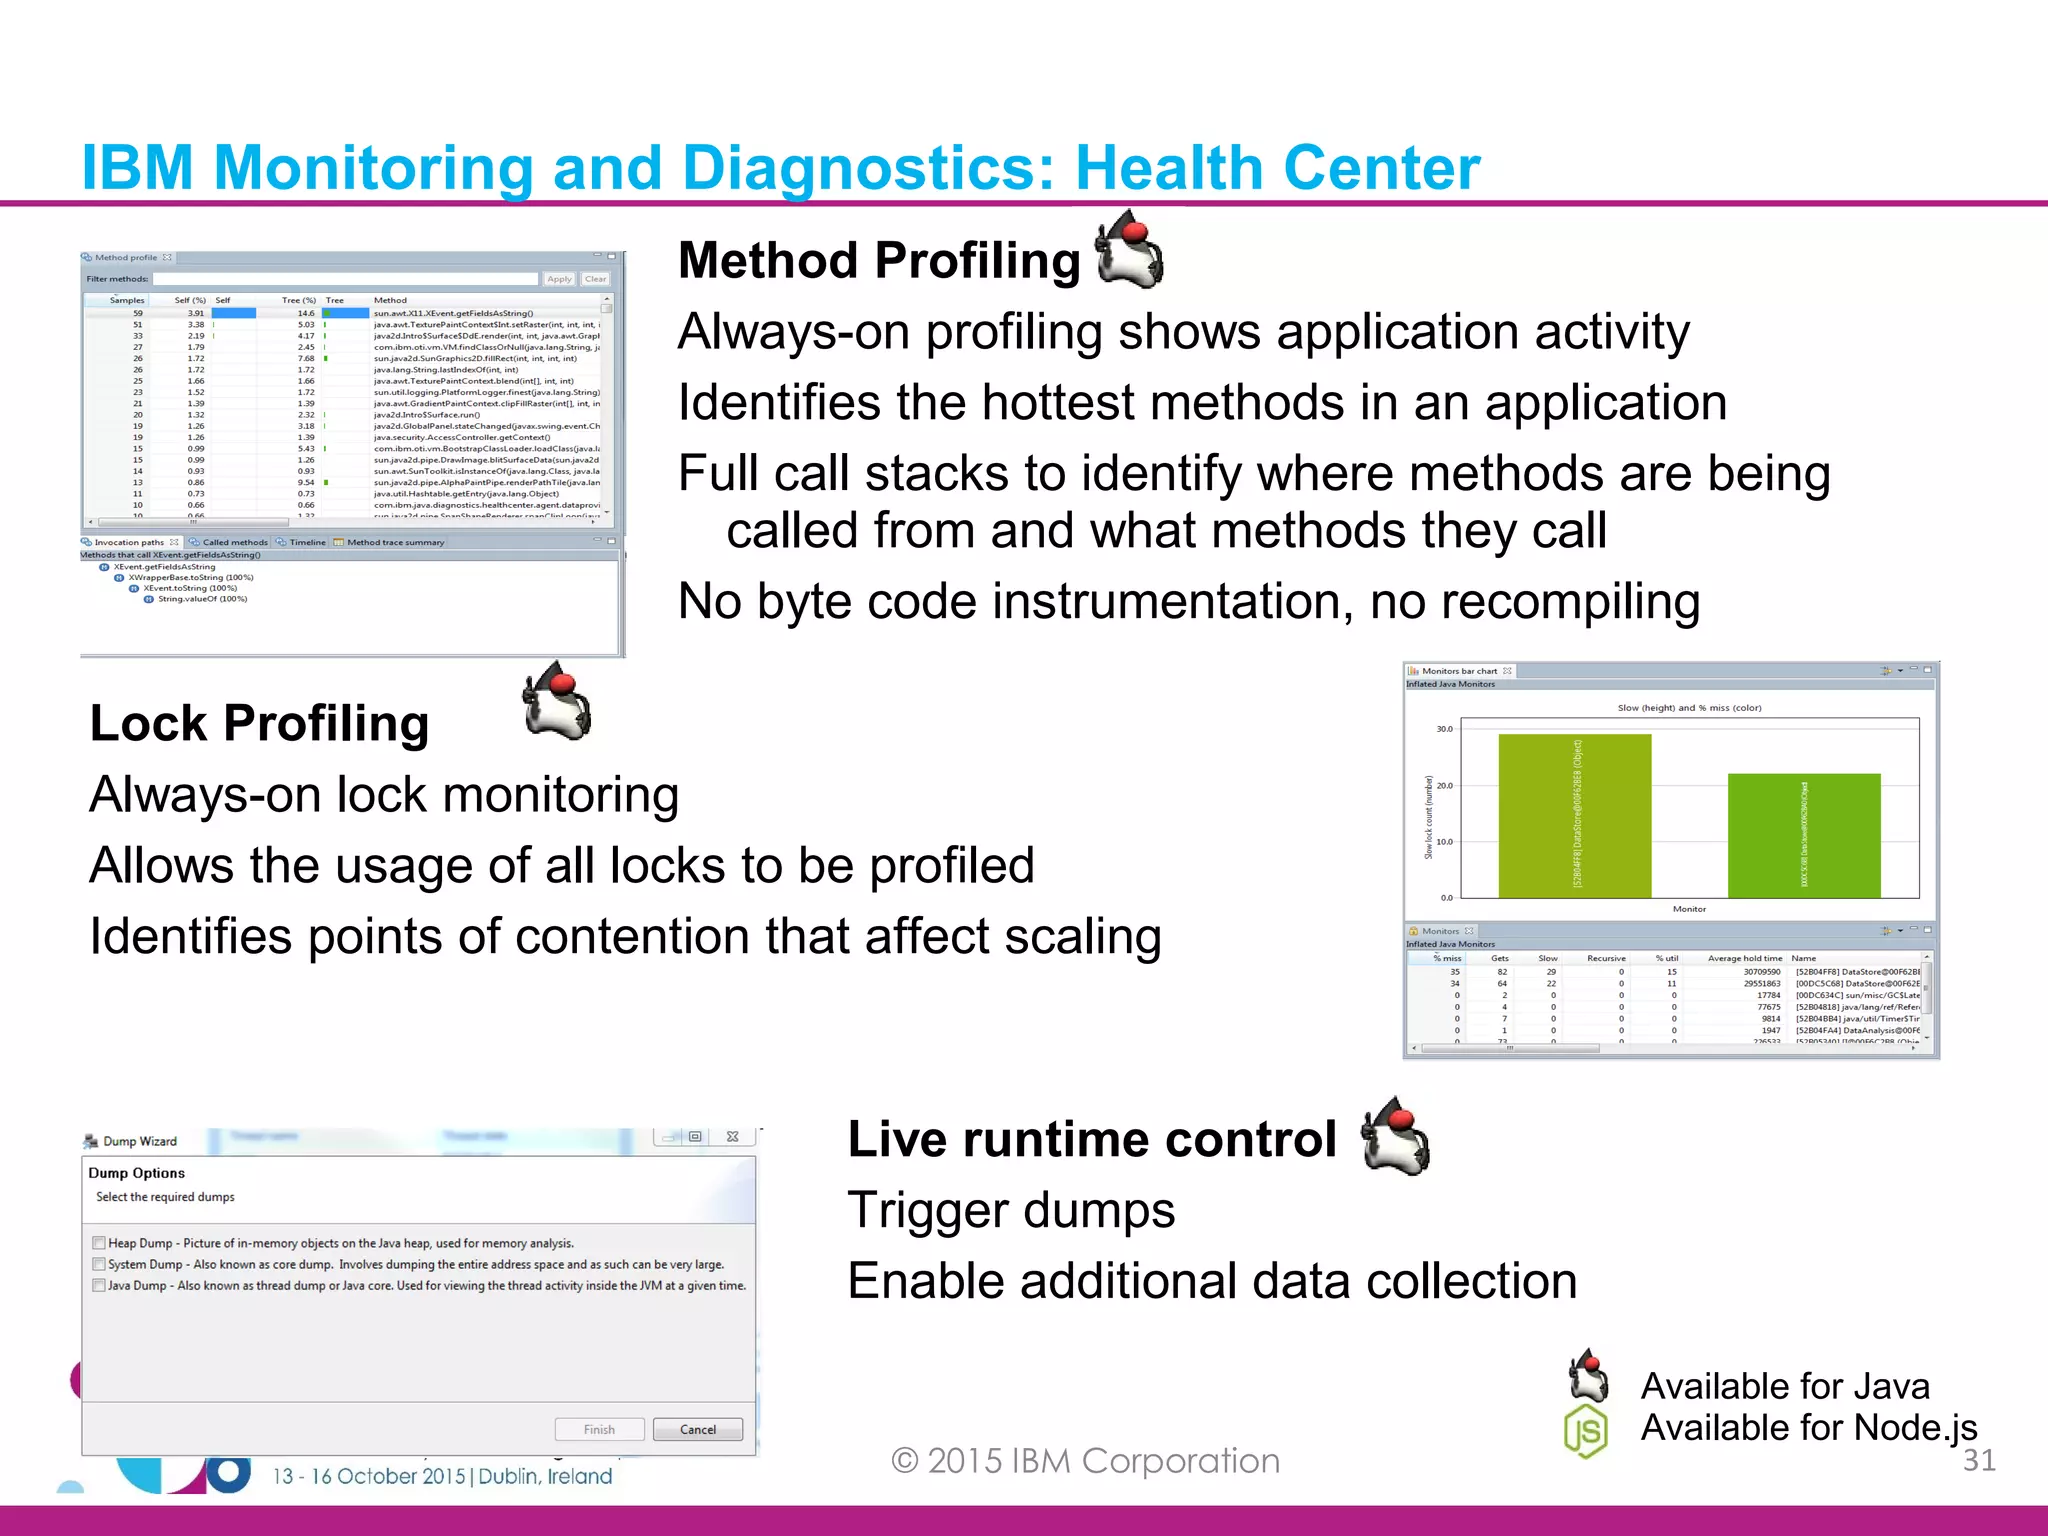
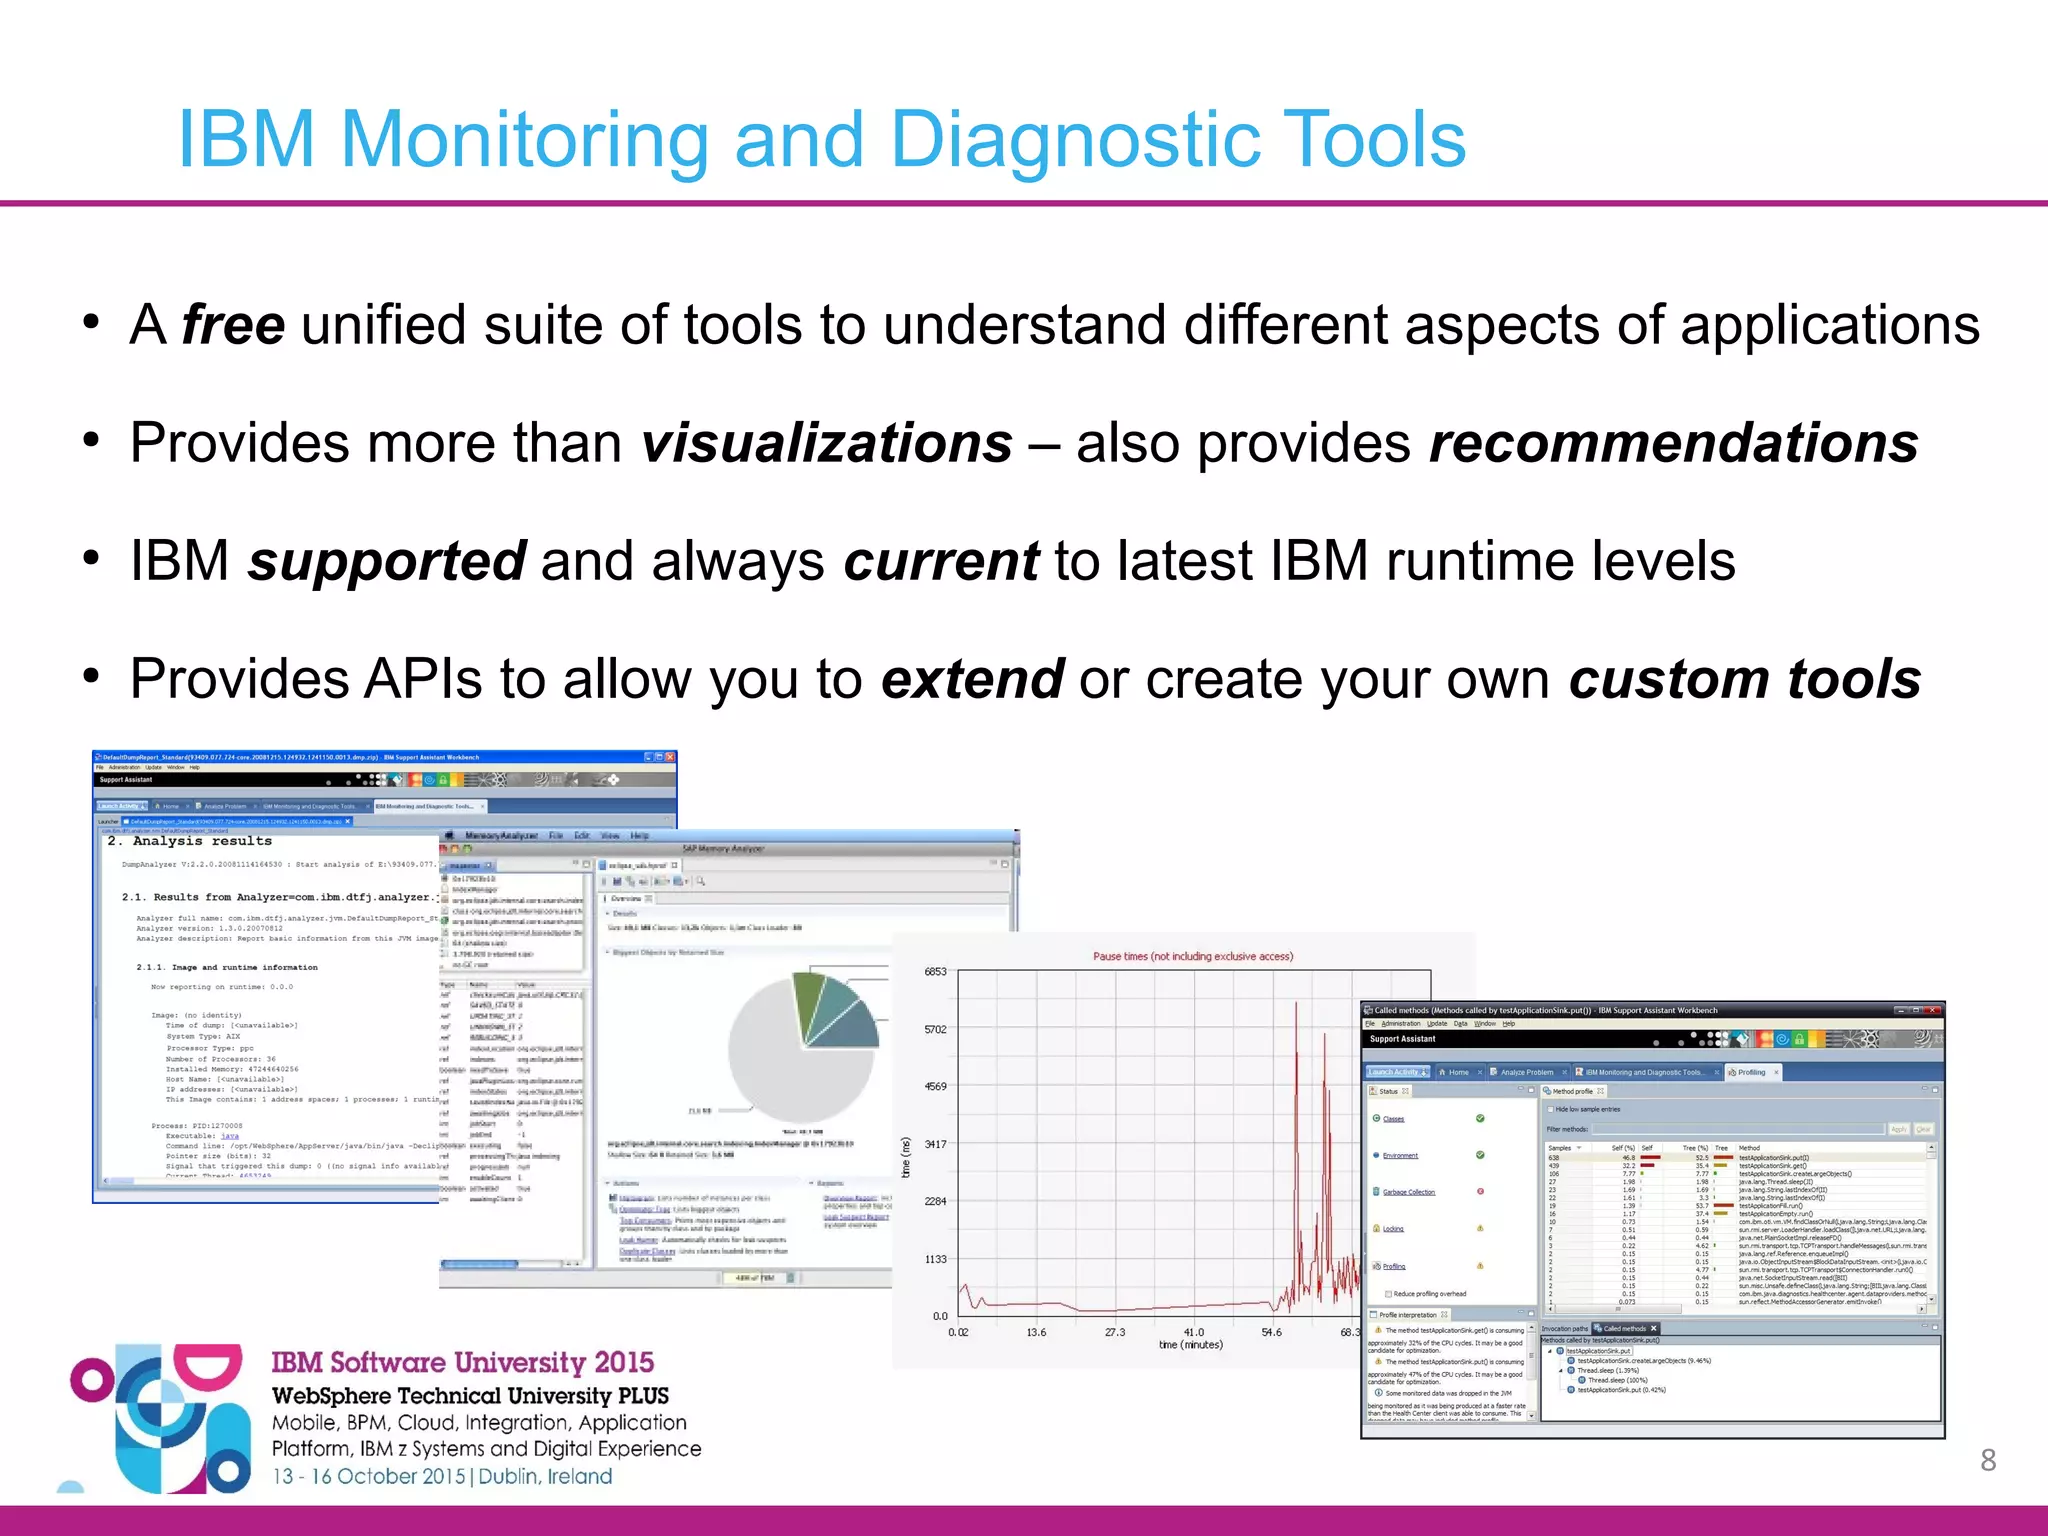
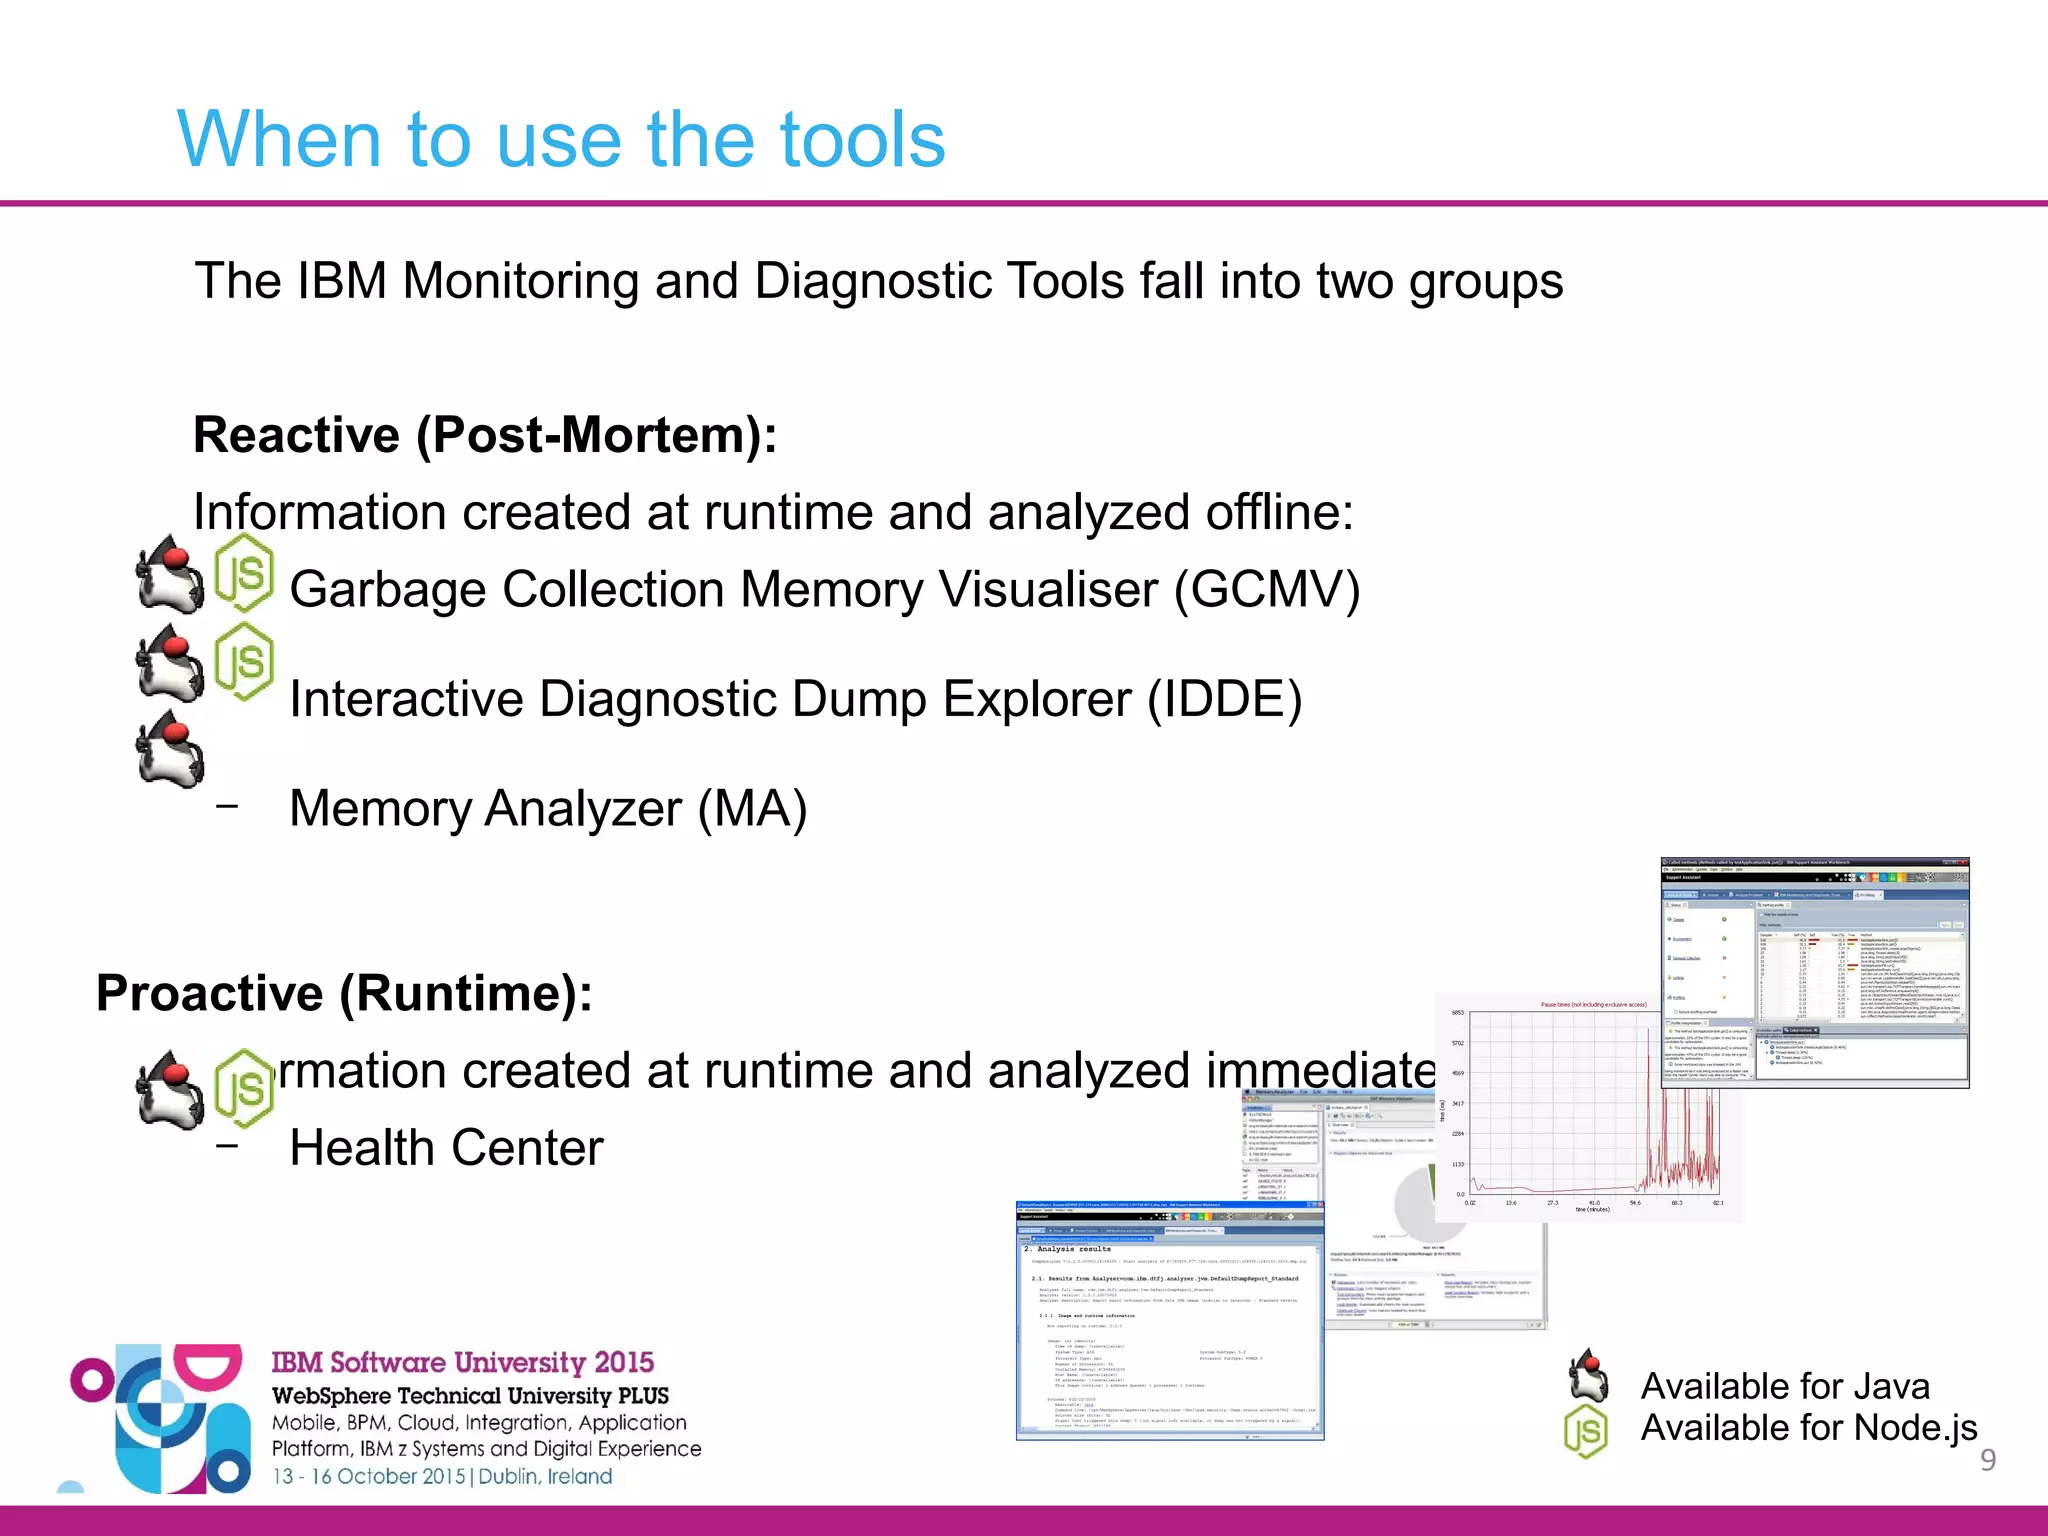
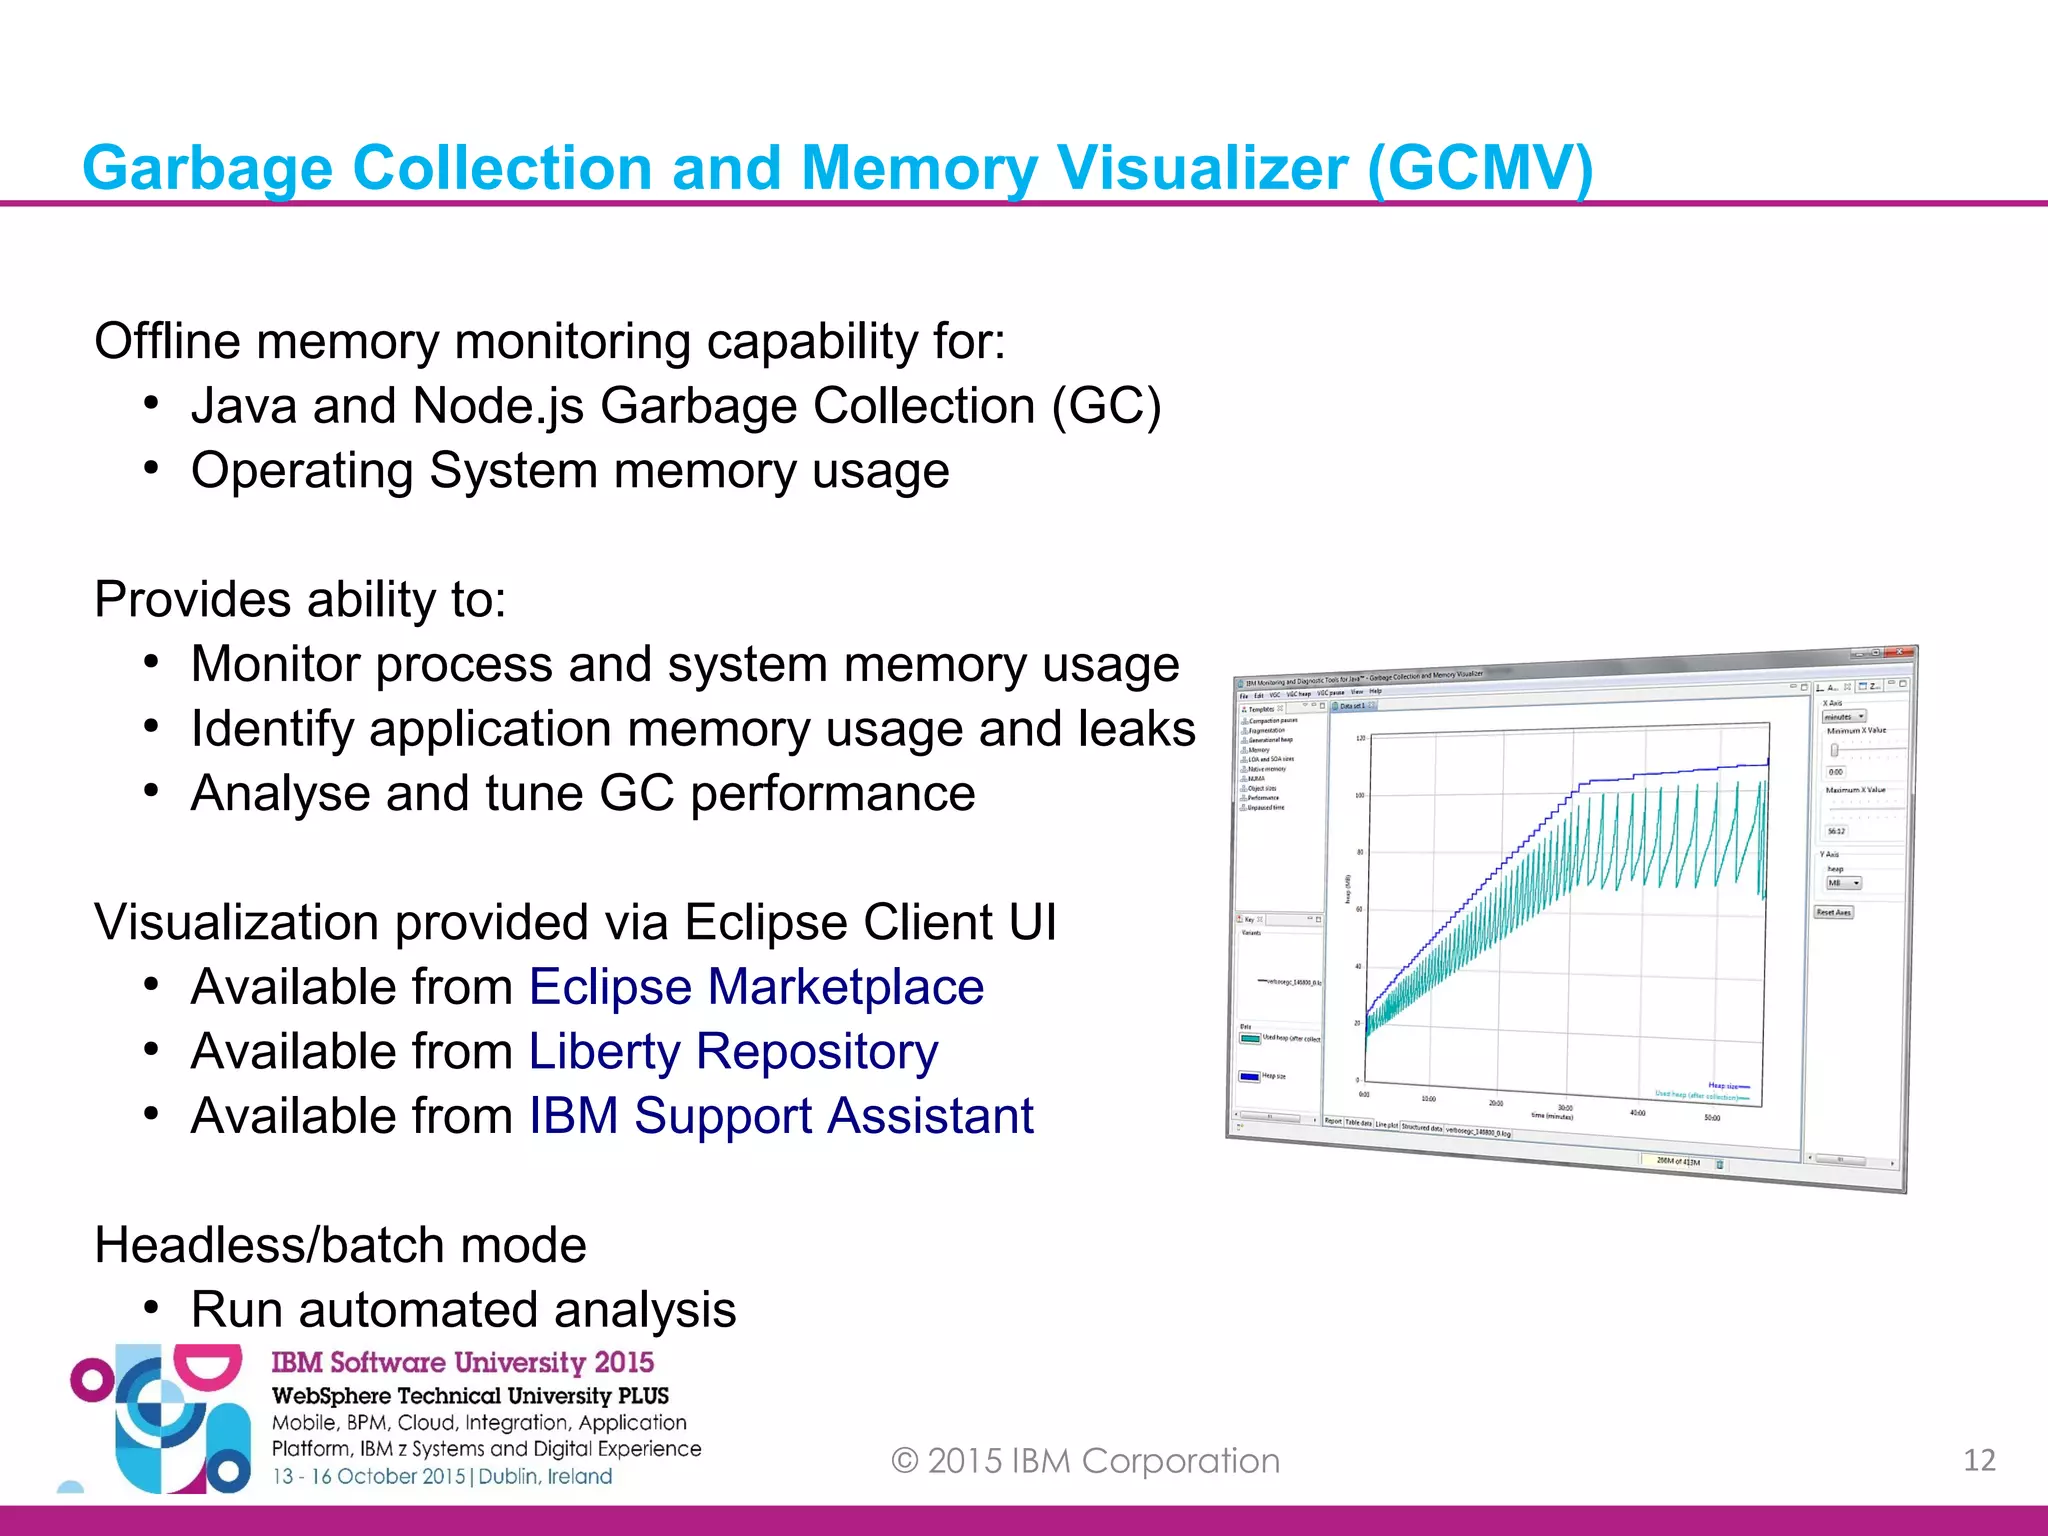
IBM S oftware Univers ity 2015 WebS phere Tec hnic al Univers ity PL US Mobile, BPM, Cloud, Integration, Application Platform, IBM z Systems and Digital Experience 13 – 16 October 2015|Dublin, Ireland A165 Introduction to the IBM Monitoring and Diagnostic Tools for Java and Javascript Toby Corbin
2 A Quick Survey
© 2015 IBM Corporation 3 Java JavaScript Both 0 0.1 0.2 0.3 0.4 0.5 0.6 0.7 0.8 0.9 1 PercentageofAudience What languages do you use?
© 2015 IBM Corporation 4 Health Center Other performance tools GCMV Other GC tools Memory Analyzer Other Memory tools IDDE Other debugger tools 0 0.1 0.2 0.3 0.4 0.5 0.6 0.7 0.8 0.9 1 PercentageofAudience What tools do you use?
© 2015 IBM Corporation 5  Toby Corbin IBM Runtime Monitoring and Diagnostics Architect - 14 years working with Java and JVM technologies - 8 years working with monitoring and diagnostic tooling  Recent work focus: - Java monitoring, diagnostics and troubleshooting - Java integration into the cloud - JavaScript monitoring, diagnostics and troubleshooting  My contact information: - corbint@uk.ibm.com Introduction to the Speaker
© 2015 IBM Corporation 6 Agenda ● Introduce the IBM tools for monitoring, debugging and diagnosing problems ● Provide understand of the capabilities of each tool ● Show how the tools can be used to solve real problems
7 Tools Overview
8 ● A free unified suite of tools to understand different aspects of applications ● Provides more than visualizations – also provides recommendations ● IBM supported and always current to latest IBM runtime levels ● Provides APIs to allow you to extend or create your own custom tools IBM Monitoring and Diagnostic Tools
9 The IBM Monitoring and Diagnostic Tools fall into two groups Reactive (Post-Mortem): Information created at runtime and analyzed offline: – Garbage Collection Memory Visualiser (GCMV) – Interactive Diagnostic Dump Explorer (IDDE) – Memory Analyzer (MA) Proactive (Runtime): Information created at runtime and analyzed immediately: – Health Center When to use the tools Available for Java Available for Node.js
10 How to get the tools: Available from multiple routes: ● Eclipse Marketplace ● Liberty Repository ● IBM Support Assistant
11 Reactive Tools (Post-Mortem)
© 2015 IBM Corporation 12 Offline memory monitoring capability for: ● Java and Node.js Garbage Collection (GC) ● Operating System memory usage Provides ability to: ● Monitor process and system memory usage ● Identify application memory usage and leaks ● Analyse and tune GC performance Visualization provided via Eclipse Client UI ● Available from Eclipse Marketplace ● Available from Liberty Repository ● Available from IBM Support Assistant Headless/batch mode ● Run automated analysis Garbage Collection and Memory Visualizer (GCMV)
© 2015 IBM Corporation 13 GCMV Capabilities Available for Java Available for Node.js Garbage Collection Garbage Collection performance and memory usage Graphical visualization including cropping and zooming Statistical analysis of data Recommendations for tuning garbage collection Memory leak detection Memory Usage Process and System memory usage Graphical visualization including cropping and zooming Statistical analysis of data Memory leak detection
© 2015 IBM Corporation 14 #!/bin/sh PID=$1 INTERVAL=3 # Echo time at start of monitoring. echo timestamp = `date +%s` # Echo the interval frequency. echo "ps interval = $INTERVAL" # Run the system command at intervals. while ([ -d /proc/$PID ]) do ps -p $PID -o pid,vsz,rss sleep $INTERVAL done #!/bin/sh PID=$1 INTERVAL=3 # Echo time at start of monitoring. echo timestamp = `date +%s` # Echo the interval frequency. echo "svmon interval = $INTERVAL" # Run the system command at intervals. while ([ -d /proc/$PID ]) do svmon -r -m -P $PID sleep $INTERVAL done #!/bin/sh PID=$1 INTERVAL=3 # Echo time at start of monitoring. echo timestamp = `date +%s` # Echo the interval frequency. echo "svmon interval = $INTERVAL" # Run the system command at intervals. while true ; do ps -p $PID -o pid,vsz sleep $INTERVAL done Run perfmon Select “Performance Logs and Alerts > Counter Logs” Create a log file name, eg. Memory Usage Click “Add Counters...” Select “Process > Virtual Bytes” from Counters Select you process from Instances Select “Add” and “Close” Click “Log Files” and “Text File (Comma delimited)” Select “Schedule” and then “Manually” in Start log Start logging by clicking “Start” Linux AIX Windows zOS Note: Scripts are provided in the Help documentation Collecting Process Memory Data
© 2015 IBM Corporation 15 -Xverbosegclog:[FILE_NAME] --trace_gc --trace_gc_nvp --trace_gc_verbose Java : IBM SDKs Node.js Java: Oracle and Open JDKs Note: Scripts are provided in the Help documentation Log verbose GC data to a given file name -Xverbosegclog:[FILE_NAME],[FILES],[ENTRIES] Log verbose GC data to a rolling number of files, each With a maximum number of GC cycle entries -Xverbosegclog:vgc.%Y%m%d.%H%M%S.%pid.txt Log data to a file name including token substitutions -XX:+PrintGCDateStamps -XX:+PrintGCDetails -XX:+PrintGCTimeStamps -Xloggc:[FILE_NAME] Log verbose GC data to a given file name Enable collection of date and time stamped GC data Log detailed verbose GC data to the console --trace_gc --trace_gc_nvp --trace_gc_verbose [APPLICATION] > [FILE_NAME] 2>&1 Capture the console to a given file name Collecting Garbage Collection Data
© 2015 IBM Corporation 16 Performance Overhead (IBM SDK for Java) Measured using WebSphere App Server and the DayTrader benchmark with 50 clients Running WAS 8.5.5, IBM Java 7 SR5, AIX 7.1, POWER7 Throughput determined by number of completed transactions on 4 saturated CPUs 0 500 1000 1500 2000 2500 3000 3500 4000 Throughput Runs Min Max Stddev Without verbose:gc 3743.953 8 3637.019 3855.971 71.6304964862 With verbose:gc
© 2015 IBM Corporation 17 Performance Overhead (IBM SDK for Java) Measured using WebSphere App Server and the DayTrader benchmark with 50 clients Running WAS 8.5.5, IBM Java 7 SR5, AIX 7.1, POWER7 Throughput determined by number of completed transactions on 4 saturated CPUs 0 500 1000 1500 2000 2500 3000 3500 4000 Throughput Runs Min Max Stddev Without verbose:gc 3743.953 8 3637.019 3855.971 71.6304964862 With verbose:gc 3748.779 8 3654.9945 3877.9495 83.5641336842 0.1289% ?
© 2015 IBM Corporation 18 GUI based, cross platform, dump debugger for use with ● IBM SDKs for Java since Java 5 ● IBM SDKs for Node.js since v 1.1.0 Provides ability to: ● Analyse crash dumps for root cause ● View field and values store in objects ● Understand the state of your application Visualization provided via Eclipse Client UI ● Available from Eclipse Marketplace ● Available from Liberty Repository ● Available from IBM Support Assistant Supports analysis of dumps created on: ● AIX, Linux, Windows or z/OS Provides local or remote analysis using server/client Interactive Diagnostics Data Explorer (IDDE)
© 2015 IBM Corporation 19 IDDE: Example Process Commands Available for Java Available for Node.js Search Memory find <type> <value> <address> find a value in memory findnext find the next instance findall <type> <value> <address> find all instances View Memory ranges list available memory ranges hexdump <address> dump memory as hex and ascii <struct> <address> format memory as a struct View Threads threads list all threads stack <thread> show stack trace for thread
© 2015 IBM Corporation 20 IDDE: Example Runtime Commands Available for Java Available for Node.js Runtime Overview javaoverview Java information nodeoverview Node.js information Memory Overview javameminfo Java Memory summary jsmeminfo Node.js memory summary
© 2015 IBM Corporation 21 IDDE: Example Object Commands Available for Java Available for Node.js List Objects javaobjects List Java objects jslistobjects List Node.js objects Print Objects javaobject Print Java object jsobject Print Node.js object
© 2015 IBM Corporation 22 Generating Dump Files Available for Java Available for Node.js Operating System Mechanisms ● AIX: gencore ● Linux: gcore ● Windows: userdump.exe or Task Manager ● z/OS SVCDUMP/Console Dump Runtime Mechanisms Java Dump Engine Java Trace Engine Java Dump API Health Center --abort-on-uncaught-exception
© IBM Corporation٢٠١٥ ٢٣ 0 2000 4000 6000 8000 10000 12000 14000 16000 0 50 100 150 200 250 300 350 Linux 64 bit PPC Same Disk RAM Disk GB Network Core Size (MB) TimetoGenerate(s) Generating Dump Files Dump writing speed dominated by IO performance: ~10s per GB providing physical memory is available Otherwise dictated by disk write speed Can be minimized by good configuration of system: ● Memory assigned to file caching ● Use of ramdisks System dumps compress very well: Usually to 10% of original size
24 Memory Analyzer Application Memory Analysis Capability ● Analyses dump files Provides ability to: ● Identify application memory leaks ● Optimize memory usage Visualization provided via Eclipse Client UI ● Available from Eclipse Marketplace ● Available from IBM Support Assistant Vizualization provided by Web UI ● Available in IBM Support Assistant Headless/batch mode ● Run automated analysis
25 Overview: Overview of the heapdump including size and total number of objects. Provides links to continued analysis Path to GC Roots: Provides the reference chain that prevents an object being garbage collected. Dominator Tree grouped by Class Loader: Lists the biggest objects using a “keep alive tree”. Grouping by Class Loader limits the analysis to a single application in a JEE environment Memory Analyzer Capabilities: General
26 Additional capabilities for debugging generic Java Applications Extensions currently available for  IBM Java SE runtime  WebSphere Application Server  CICS Transaction Gateway Using these extensions will enable  Visualization of application and IBM product code  Confirm configuration of IBM Products  Inspect size and contents of IBM products Extensions are made available through ISA or installed directly into the Memory Analyser application Memory Analyzer Capabilities: Product Specific
© 2015 IBM Corporation 27 Proactive Tools (Runtime)
© 2015 IBM Corporation 28 Very low overhead live monitoring capability for Java and Node.js ● Pre-installed in IBM SDKs for Java since Java 5 ● Pre-installed in IBM SDKs for Node.js since v 1.1.0.10 Provides insight into runtime and application execution, including ● Memory and CPU usage ● Garbage Collection ● Application execution Visualization provided via Eclipse Client UI ● Available from Eclipse Marketplace ● Available from IBM Support Assistant Data access API provided ● Allows creation of custom monitoring tools ● Full API Javadoc available IBM Monitoring and Diagnostics: Health Center
© 2015 IBM Corporation 29 IBM Monitoring and Diagnostics: Health Center Available for Java Available for Node.js Memory Utilization Detect native memory leaks in application Determine if external forces are using more memory View components using the most native memory Environment Hardware and Operating System Configuration Process environment and configuration Highlights incorrect or non-standard configurations CPU Utilization Visualizes process CPU usage over time Visualizes system CPU usage over time
© 2015 IBM Corporation 30 IBM Monitoring and Diagnostics: Health Center Available for Java Available for Node.js Object Allocations Understand types of data being allocated Determine which code is allocating data Threads List of current threads and states Number of threads over time See contended monitors Garbage Collection Visualizes heap usage and GC pause times Identifies memory leaks Suggests command-line and tuning parameters
© 2015 IBM Corporation 31 IBM Monitoring and Diagnostics: Health Center Available for Java Available for Node.js Lock Profiling Always-on lock monitoring Allows the usage of all locks to be profiled Identifies points of contention that affect scaling Live runtime control Trigger dumps Enable additional data collection Method Profiling Always-on profiling shows application activity Identifies the hottest methods in an application Full call stacks to identify where methods are being called from and what methods they call No byte code instrumentation, no recompiling
© 2015 IBM Corporation 32 IBM SDK for Java: Using Command line: Add -Xhealthcenter option Using “late attach” java -jar healthcenter.jar -PID=<pid> Starting Health Center IBM SDK for Node.js: Command line: Use node-hc executable Programmatically: require(“/usr/local/lib/node_modules /healthcenter”).start() Available for Java Available for Node.js
© 2015 IBM Corporation 33 Point to Point Using JMX connection directly to application Publish/Subscribe Using MQTT messages and a pub/sub broker Deployment Modes Available for Java Available for Node.js Pub/Sub Broker Topic namespace: /ibm/healthcenter /<namespace>/<agent_id>/<datatype> Node.js Application Liberty Java (J9) Application Liberty Java (J9) Application JMX MQTT MQTT MQTT MQTT MQTT
© 2015 IBM Corporation 34 Performance Overhead (Java) Measured using WebSphere App Server and the DayTrader benchmark with 50 clients Running WAS 8.5.5, IBM Java 7 SR5, AIX 7.1, POWER7 Throughput determined by number of completed transactions on 4 saturated CPUs 80 85 90 95 100 105 100 Baseline Network Client Headless Headless with ZIP
© 2015 IBM Corporation 35 Performance Overhead (Java) Measured using WebSphere App Server and the DayTrader benchmark with 50 clients Running WAS 8.5.5, IBM Java 7 SR5, AIX 7.1, POWER7 Throughput determined by number of completed transactions on 4 saturated CPUs 80 85 90 95 100 105 100.4 Baseline Network Client Headless Headless with ZIP
© 2015 IBM Corporation 36 Performance Overhead (Java) Measured using WebSphere App Server and the DayTrader benchmark with 50 clients Running WAS 8.5.5, IBM Java 7 SR5, AIX 7.1, POWER7 Throughput determined by number of completed transactions on 4 saturated CPUs 80 85 90 95 100 105 99.01 Baseline Network Client Headless Headless with ZIP
© 2015 IBM Corporation 37 Performance Overhead (Java) Measured using WebSphere App Server and the DayTrader benchmark with 50 clients Running WAS 8.5.5, IBM Java 7 SR5, AIX 7.1, POWER7 Throughput determined by number of completed transactions on 4 saturated CPUs 80 85 90 95 100 105 96.99 Baseline Network Client Headless Headless with ZIP
The 2.2 release of Health Center provides an API ● Allows developers to access Health Center data in their applications // Create the connection object: ConnectionProperties conn1 = new ConnectionProperties("localhost", 1973); // Connect to the Health Center agent, using the previous connection // settings: HealthCenter hcObject = HealthCenterFactory.connect(conn1, true); // Get garbage collection data and print: GCData gcData = hcObject.getGCData(); System.out.println("GC Mode is " + gcData.getGCMode().toString()); Access Health Center data with the API
RAD v9 Usage of Health Center Data  Enable “Health Center Agent”  Select “Sample based profiling”  Method CPU usage collected  Displayed in real time  Accessed using API
40 Demo
41  IBM is building a set of integrated monitoring and diagnostic tools – Taking a ground up approach, integrating with the runtime  Working to make these common across runtimes – Remove the need to “learn” how to monitor and diagnose new languages  What Next?? Summary
Toby Corbin Thank you very much. IBM corbint@uk.ibm.com © 2015 IBM Corporation 42
© 2015 IBM Corporation 43 Your feedback is valuable Please complete your session or lab evaluation! Session number A165 Introduction to the IBM Monitoring and Diagnostic tools for Java and Javascript Provide your evaluations by: Evaluation forms: Fill out a form at the end of each session Paper forms are located in each of the session or lab rooms Complete the session survey on Event Connect Portal: https://ibmeventconnect.com/dubli nevent2015 Select Sessions, then Session Finder, and complete the survey - Or -

A165 tools for java and javascript

  • 1.
    IBM S oftwareUnivers ity 2015 WebS phere Tec hnic al Univers ity PL US Mobile, BPM, Cloud, Integration, Application Platform, IBM z Systems and Digital Experience 13 – 16 October 2015|Dublin, Ireland A165 Introduction to the IBM Monitoring and Diagnostic Tools for Java and Javascript Toby Corbin
  • 2.
  • 3.
    © 2015 IBMCorporation 3 Java JavaScript Both 0 0.1 0.2 0.3 0.4 0.5 0.6 0.7 0.8 0.9 1 PercentageofAudience What languages do you use?
  • 4.
    © 2015 IBMCorporation 4 Health Center Other performance tools GCMV Other GC tools Memory Analyzer Other Memory tools IDDE Other debugger tools 0 0.1 0.2 0.3 0.4 0.5 0.6 0.7 0.8 0.9 1 PercentageofAudience What tools do you use?
  • 5.
    © 2015 IBMCorporation 5  Toby Corbin IBM Runtime Monitoring and Diagnostics Architect - 14 years working with Java and JVM technologies - 8 years working with monitoring and diagnostic tooling  Recent work focus: - Java monitoring, diagnostics and troubleshooting - Java integration into the cloud - JavaScript monitoring, diagnostics and troubleshooting  My contact information: - corbint@uk.ibm.com Introduction to the Speaker
  • 6.
    © 2015 IBMCorporation 6 Agenda ● Introduce the IBM tools for monitoring, debugging and diagnosing problems ● Provide understand of the capabilities of each tool ● Show how the tools can be used to solve real problems
  • 7.
  • 8.
    8 ● A free unifiedsuite of tools to understand different aspects of applications ● Provides more than visualizations – also provides recommendations ● IBM supported and always current to latest IBM runtime levels ● Provides APIs to allow you to extend or create your own custom tools IBM Monitoring and Diagnostic Tools
  • 9.
    9 The IBM Monitoringand Diagnostic Tools fall into two groups Reactive (Post-Mortem): Information created at runtime and analyzed offline: – Garbage Collection Memory Visualiser (GCMV) – Interactive Diagnostic Dump Explorer (IDDE) – Memory Analyzer (MA) Proactive (Runtime): Information created at runtime and analyzed immediately: – Health Center When to use the tools Available for Java Available for Node.js
  • 10.
    10 How to getthe tools: Available from multiple routes: ● Eclipse Marketplace ● Liberty Repository ● IBM Support Assistant
  • 11.
  • 12.
    © 2015 IBMCorporation 12 Offline memory monitoring capability for: ● Java and Node.js Garbage Collection (GC) ● Operating System memory usage Provides ability to: ● Monitor process and system memory usage ● Identify application memory usage and leaks ● Analyse and tune GC performance Visualization provided via Eclipse Client UI ● Available from Eclipse Marketplace ● Available from Liberty Repository ● Available from IBM Support Assistant Headless/batch mode ● Run automated analysis Garbage Collection and Memory Visualizer (GCMV)
  • 13.
    © 2015 IBMCorporation 13 GCMV Capabilities Available for Java Available for Node.js Garbage Collection Garbage Collection performance and memory usage Graphical visualization including cropping and zooming Statistical analysis of data Recommendations for tuning garbage collection Memory leak detection Memory Usage Process and System memory usage Graphical visualization including cropping and zooming Statistical analysis of data Memory leak detection
  • 14.
    © 2015 IBMCorporation 14 #!/bin/sh PID=$1 INTERVAL=3 # Echo time at start of monitoring. echo timestamp = `date +%s` # Echo the interval frequency. echo "ps interval = $INTERVAL" # Run the system command at intervals. while ([ -d /proc/$PID ]) do ps -p $PID -o pid,vsz,rss sleep $INTERVAL done #!/bin/sh PID=$1 INTERVAL=3 # Echo time at start of monitoring. echo timestamp = `date +%s` # Echo the interval frequency. echo "svmon interval = $INTERVAL" # Run the system command at intervals. while ([ -d /proc/$PID ]) do svmon -r -m -P $PID sleep $INTERVAL done #!/bin/sh PID=$1 INTERVAL=3 # Echo time at start of monitoring. echo timestamp = `date +%s` # Echo the interval frequency. echo "svmon interval = $INTERVAL" # Run the system command at intervals. while true ; do ps -p $PID -o pid,vsz sleep $INTERVAL done Run perfmon Select “Performance Logs and Alerts > Counter Logs” Create a log file name, eg. Memory Usage Click “Add Counters...” Select “Process > Virtual Bytes” from Counters Select you process from Instances Select “Add” and “Close” Click “Log Files” and “Text File (Comma delimited)” Select “Schedule” and then “Manually” in Start log Start logging by clicking “Start” Linux AIX Windows zOS Note: Scripts are provided in the Help documentation Collecting Process Memory Data
  • 15.
    © 2015 IBMCorporation 15 -Xverbosegclog:[FILE_NAME] --trace_gc --trace_gc_nvp --trace_gc_verbose Java : IBM SDKs Node.js Java: Oracle and Open JDKs Note: Scripts are provided in the Help documentation Log verbose GC data to a given file name -Xverbosegclog:[FILE_NAME],[FILES],[ENTRIES] Log verbose GC data to a rolling number of files, each With a maximum number of GC cycle entries -Xverbosegclog:vgc.%Y%m%d.%H%M%S.%pid.txt Log data to a file name including token substitutions -XX:+PrintGCDateStamps -XX:+PrintGCDetails -XX:+PrintGCTimeStamps -Xloggc:[FILE_NAME] Log verbose GC data to a given file name Enable collection of date and time stamped GC data Log detailed verbose GC data to the console --trace_gc --trace_gc_nvp --trace_gc_verbose [APPLICATION] > [FILE_NAME] 2>&1 Capture the console to a given file name Collecting Garbage Collection Data
  • 16.
    © 2015 IBMCorporation 16 Performance Overhead (IBM SDK for Java) Measured using WebSphere App Server and the DayTrader benchmark with 50 clients Running WAS 8.5.5, IBM Java 7 SR5, AIX 7.1, POWER7 Throughput determined by number of completed transactions on 4 saturated CPUs 0 500 1000 1500 2000 2500 3000 3500 4000 Throughput Runs Min Max Stddev Without verbose:gc 3743.953 8 3637.019 3855.971 71.6304964862 With verbose:gc
  • 17.
    © 2015 IBMCorporation 17 Performance Overhead (IBM SDK for Java) Measured using WebSphere App Server and the DayTrader benchmark with 50 clients Running WAS 8.5.5, IBM Java 7 SR5, AIX 7.1, POWER7 Throughput determined by number of completed transactions on 4 saturated CPUs 0 500 1000 1500 2000 2500 3000 3500 4000 Throughput Runs Min Max Stddev Without verbose:gc 3743.953 8 3637.019 3855.971 71.6304964862 With verbose:gc 3748.779 8 3654.9945 3877.9495 83.5641336842 0.1289% ?
  • 18.
    © 2015 IBMCorporation 18 GUI based, cross platform, dump debugger for use with ● IBM SDKs for Java since Java 5 ● IBM SDKs for Node.js since v 1.1.0 Provides ability to: ● Analyse crash dumps for root cause ● View field and values store in objects ● Understand the state of your application Visualization provided via Eclipse Client UI ● Available from Eclipse Marketplace ● Available from Liberty Repository ● Available from IBM Support Assistant Supports analysis of dumps created on: ● AIX, Linux, Windows or z/OS Provides local or remote analysis using server/client Interactive Diagnostics Data Explorer (IDDE)
  • 19.
    © 2015 IBMCorporation 19 IDDE: Example Process Commands Available for Java Available for Node.js Search Memory find <type> <value> <address> find a value in memory findnext find the next instance findall <type> <value> <address> find all instances View Memory ranges list available memory ranges hexdump <address> dump memory as hex and ascii <struct> <address> format memory as a struct View Threads threads list all threads stack <thread> show stack trace for thread
  • 20.
    © 2015 IBMCorporation 20 IDDE: Example Runtime Commands Available for Java Available for Node.js Runtime Overview javaoverview Java information nodeoverview Node.js information Memory Overview javameminfo Java Memory summary jsmeminfo Node.js memory summary
  • 21.
    © 2015 IBMCorporation 21 IDDE: Example Object Commands Available for Java Available for Node.js List Objects javaobjects List Java objects jslistobjects List Node.js objects Print Objects javaobject Print Java object jsobject Print Node.js object
  • 22.
    © 2015 IBMCorporation 22 Generating Dump Files Available for Java Available for Node.js Operating System Mechanisms ● AIX: gencore ● Linux: gcore ● Windows: userdump.exe or Task Manager ● z/OS SVCDUMP/Console Dump Runtime Mechanisms Java Dump Engine Java Trace Engine Java Dump API Health Center --abort-on-uncaught-exception
  • 23.
    © IBM Corporation٢٠١٥٢٣ 0 2000 4000 6000 8000 10000 12000 14000 16000 0 50 100 150 200 250 300 350 Linux 64 bit PPC Same Disk RAM Disk GB Network Core Size (MB) TimetoGenerate(s) Generating Dump Files Dump writing speed dominated by IO performance: ~10s per GB providing physical memory is available Otherwise dictated by disk write speed Can be minimized by good configuration of system: ● Memory assigned to file caching ● Use of ramdisks System dumps compress very well: Usually to 10% of original size
  • 24.
    24 Memory Analyzer Application MemoryAnalysis Capability ● Analyses dump files Provides ability to: ● Identify application memory leaks ● Optimize memory usage Visualization provided via Eclipse Client UI ● Available from Eclipse Marketplace ● Available from IBM Support Assistant Vizualization provided by Web UI ● Available in IBM Support Assistant Headless/batch mode ● Run automated analysis
  • 25.
    25 Overview: Overview of theheapdump including size and total number of objects. Provides links to continued analysis Path to GC Roots: Provides the reference chain that prevents an object being garbage collected. Dominator Tree grouped by Class Loader: Lists the biggest objects using a “keep alive tree”. Grouping by Class Loader limits the analysis to a single application in a JEE environment Memory Analyzer Capabilities: General
  • 26.
    26 Additional capabilities fordebugging generic Java Applications Extensions currently available for  IBM Java SE runtime  WebSphere Application Server  CICS Transaction Gateway Using these extensions will enable  Visualization of application and IBM product code  Confirm configuration of IBM Products  Inspect size and contents of IBM products Extensions are made available through ISA or installed directly into the Memory Analyser application Memory Analyzer Capabilities: Product Specific
  • 27.
    © 2015 IBMCorporation 27 Proactive Tools (Runtime)
  • 28.
    © 2015 IBMCorporation 28 Very low overhead live monitoring capability for Java and Node.js ● Pre-installed in IBM SDKs for Java since Java 5 ● Pre-installed in IBM SDKs for Node.js since v 1.1.0.10 Provides insight into runtime and application execution, including ● Memory and CPU usage ● Garbage Collection ● Application execution Visualization provided via Eclipse Client UI ● Available from Eclipse Marketplace ● Available from IBM Support Assistant Data access API provided ● Allows creation of custom monitoring tools ● Full API Javadoc available IBM Monitoring and Diagnostics: Health Center
  • 29.
    © 2015 IBMCorporation 29 IBM Monitoring and Diagnostics: Health Center Available for Java Available for Node.js Memory Utilization Detect native memory leaks in application Determine if external forces are using more memory View components using the most native memory Environment Hardware and Operating System Configuration Process environment and configuration Highlights incorrect or non-standard configurations CPU Utilization Visualizes process CPU usage over time Visualizes system CPU usage over time
  • 30.
    © 2015 IBMCorporation 30 IBM Monitoring and Diagnostics: Health Center Available for Java Available for Node.js Object Allocations Understand types of data being allocated Determine which code is allocating data Threads List of current threads and states Number of threads over time See contended monitors Garbage Collection Visualizes heap usage and GC pause times Identifies memory leaks Suggests command-line and tuning parameters
  • 31.
    © 2015 IBMCorporation 31 IBM Monitoring and Diagnostics: Health Center Available for Java Available for Node.js Lock Profiling Always-on lock monitoring Allows the usage of all locks to be profiled Identifies points of contention that affect scaling Live runtime control Trigger dumps Enable additional data collection Method Profiling Always-on profiling shows application activity Identifies the hottest methods in an application Full call stacks to identify where methods are being called from and what methods they call No byte code instrumentation, no recompiling
  • 32.
    © 2015 IBMCorporation 32 IBM SDK for Java: Using Command line: Add -Xhealthcenter option Using “late attach” java -jar healthcenter.jar -PID=<pid> Starting Health Center IBM SDK for Node.js: Command line: Use node-hc executable Programmatically: require(“/usr/local/lib/node_modules /healthcenter”).start() Available for Java Available for Node.js
  • 33.
    © 2015 IBMCorporation 33 Point to Point Using JMX connection directly to application Publish/Subscribe Using MQTT messages and a pub/sub broker Deployment Modes Available for Java Available for Node.js Pub/Sub Broker Topic namespace: /ibm/healthcenter /<namespace>/<agent_id>/<datatype> Node.js Application Liberty Java (J9) Application Liberty Java (J9) Application JMX MQTT MQTT MQTT MQTT MQTT
  • 34.
    © 2015 IBMCorporation 34 Performance Overhead (Java) Measured using WebSphere App Server and the DayTrader benchmark with 50 clients Running WAS 8.5.5, IBM Java 7 SR5, AIX 7.1, POWER7 Throughput determined by number of completed transactions on 4 saturated CPUs 80 85 90 95 100 105 100 Baseline Network Client Headless Headless with ZIP
  • 35.
    © 2015 IBMCorporation 35 Performance Overhead (Java) Measured using WebSphere App Server and the DayTrader benchmark with 50 clients Running WAS 8.5.5, IBM Java 7 SR5, AIX 7.1, POWER7 Throughput determined by number of completed transactions on 4 saturated CPUs 80 85 90 95 100 105 100.4 Baseline Network Client Headless Headless with ZIP
  • 36.
    © 2015 IBMCorporation 36 Performance Overhead (Java) Measured using WebSphere App Server and the DayTrader benchmark with 50 clients Running WAS 8.5.5, IBM Java 7 SR5, AIX 7.1, POWER7 Throughput determined by number of completed transactions on 4 saturated CPUs 80 85 90 95 100 105 99.01 Baseline Network Client Headless Headless with ZIP
  • 37.
    © 2015 IBMCorporation 37 Performance Overhead (Java) Measured using WebSphere App Server and the DayTrader benchmark with 50 clients Running WAS 8.5.5, IBM Java 7 SR5, AIX 7.1, POWER7 Throughput determined by number of completed transactions on 4 saturated CPUs 80 85 90 95 100 105 96.99 Baseline Network Client Headless Headless with ZIP
  • 38.
    The 2.2 releaseof Health Center provides an API ● Allows developers to access Health Center data in their applications // Create the connection object: ConnectionProperties conn1 = new ConnectionProperties("localhost", 1973); // Connect to the Health Center agent, using the previous connection // settings: HealthCenter hcObject = HealthCenterFactory.connect(conn1, true); // Get garbage collection data and print: GCData gcData = hcObject.getGCData(); System.out.println("GC Mode is " + gcData.getGCMode().toString()); Access Health Center data with the API
  • 39.
    RAD v9 Usageof Health Center Data  Enable “Health Center Agent”  Select “Sample based profiling”  Method CPU usage collected  Displayed in real time  Accessed using API
  • 40.
  • 41.
    41  IBM is buildinga set of integrated monitoring and diagnostic tools – Taking a ground up approach, integrating with the runtime  Working to make these common across runtimes – Remove the need to “learn” how to monitor and diagnose new languages  What Next?? Summary
  • 42.
    Toby Corbin Thank youvery much. IBM corbint@uk.ibm.com © 2015 IBM Corporation 42
  • 43.
    © 2015 IBMCorporation 43 Your feedback is valuable Please complete your session or lab evaluation! Session number A165 Introduction to the IBM Monitoring and Diagnostic tools for Java and Javascript Provide your evaluations by: Evaluation forms: Fill out a form at the end of each session Paper forms are located in each of the session or lab rooms Complete the session survey on Event Connect Portal: https://ibmeventconnect.com/dubli nevent2015 Select Sessions, then Session Finder, and complete the survey - Or -