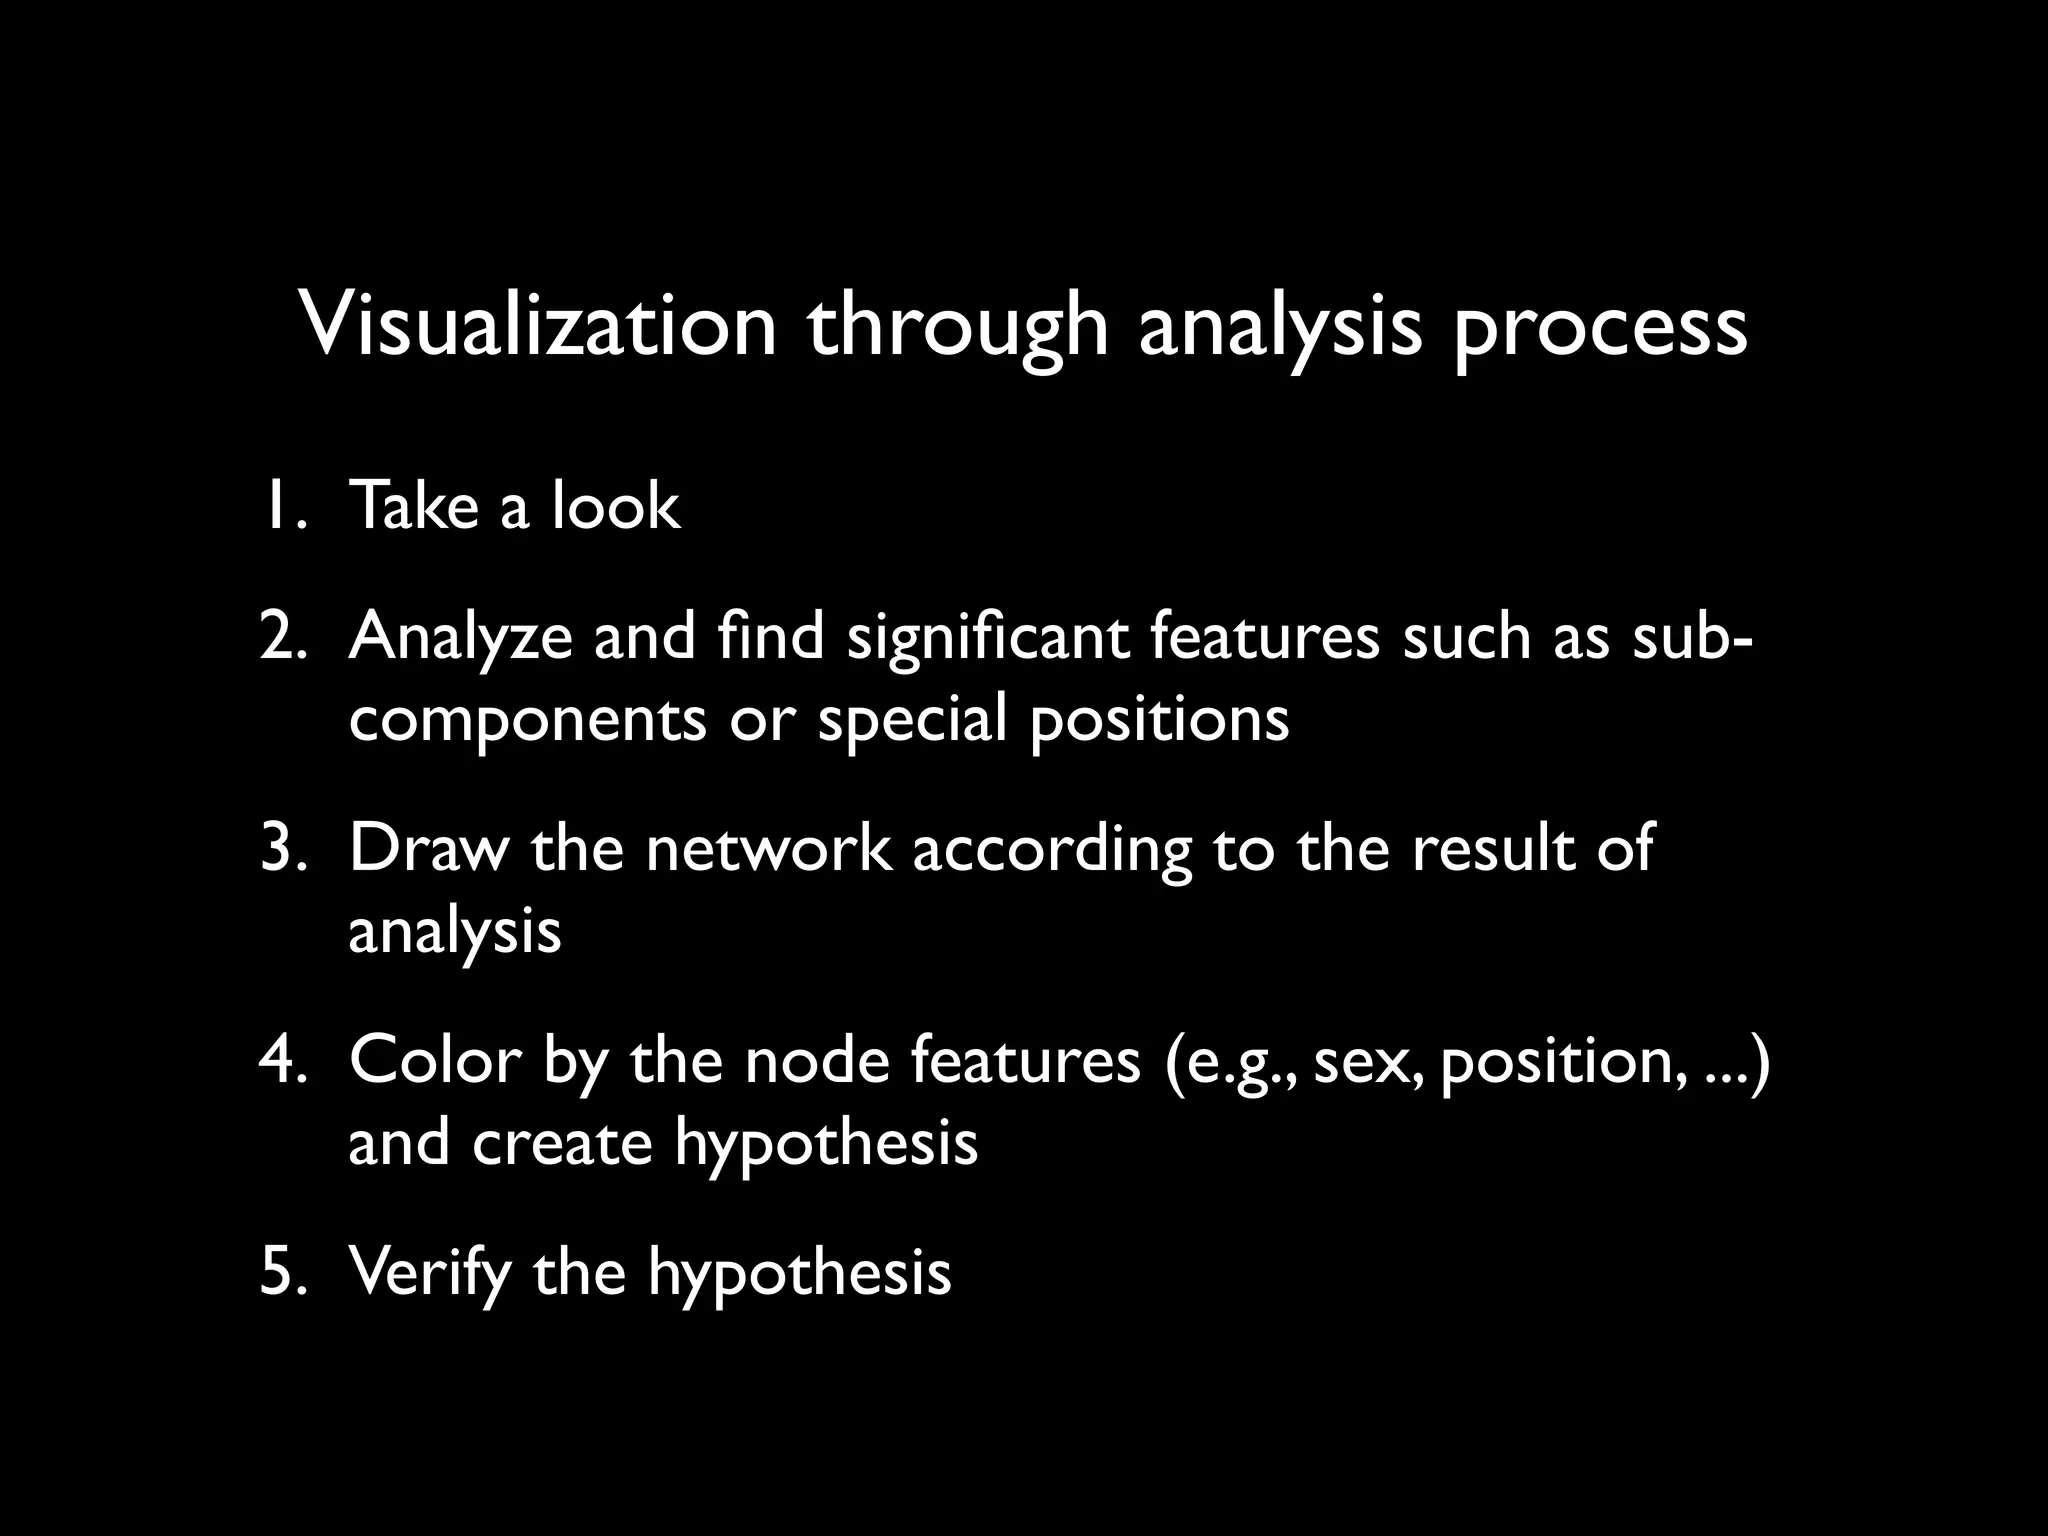
![• in-degree: how many directed edges (arcs) are incident on a node • out-degree: how may directed edges originate at a node • Degree sequence: [4, 4, 3, 7, …] Node properties](https://image.slidesharecdn.com/4-1networkanalysisbasic-130425091629-phpapp02/75/4-1-network-analysis-basic-2-2048.jpg)
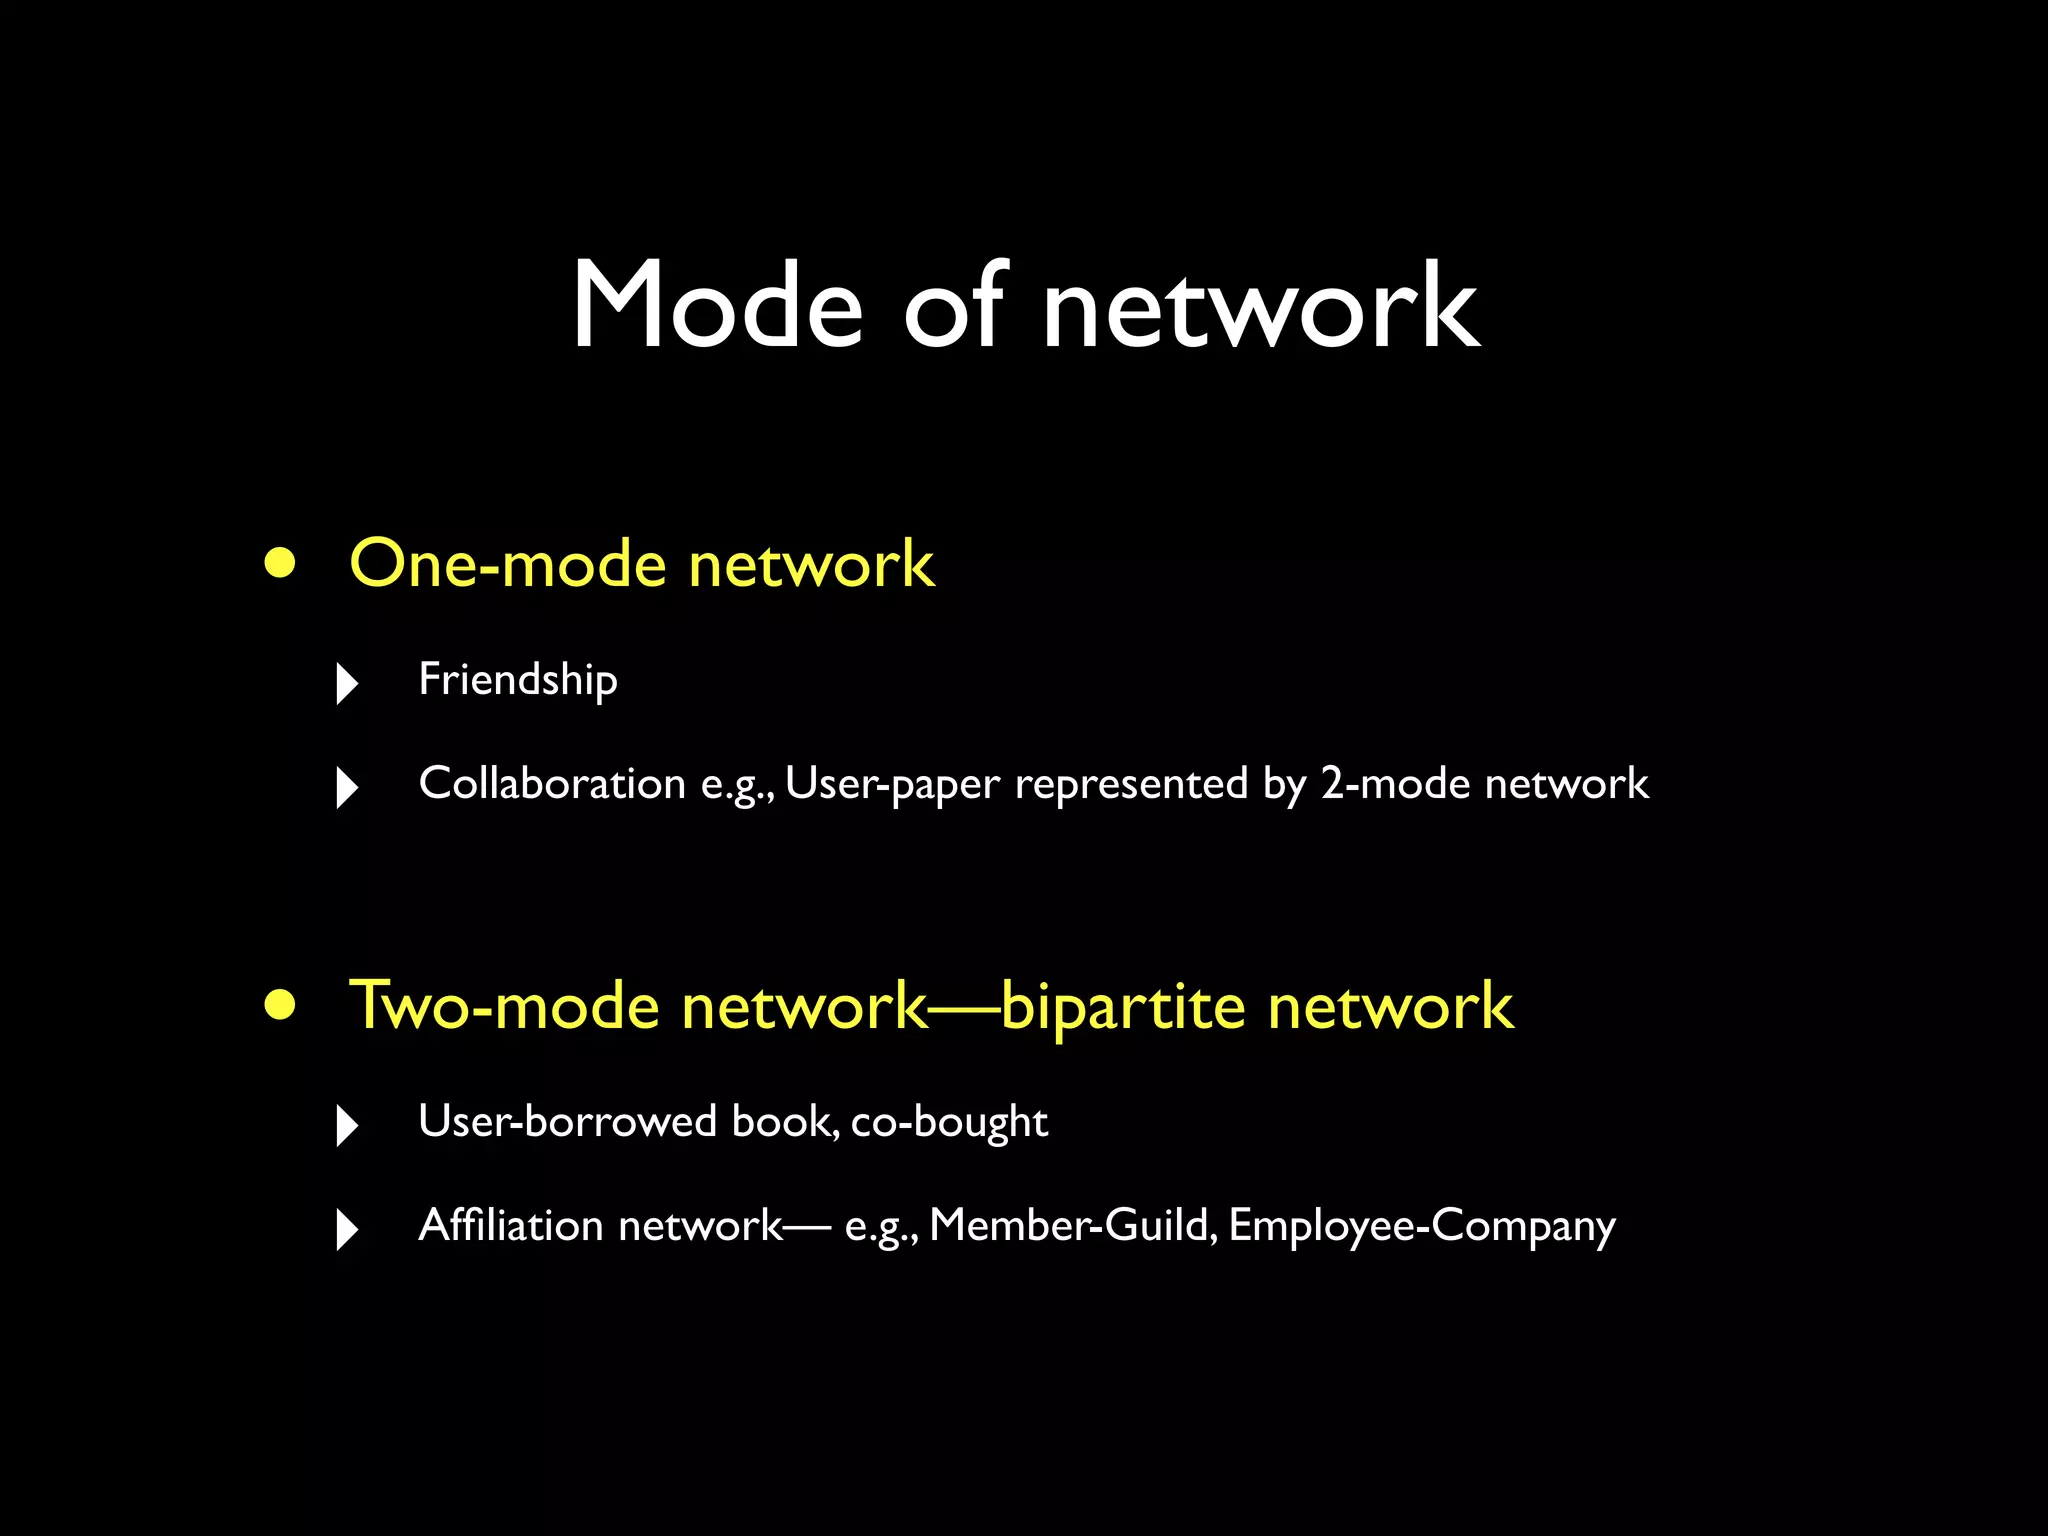
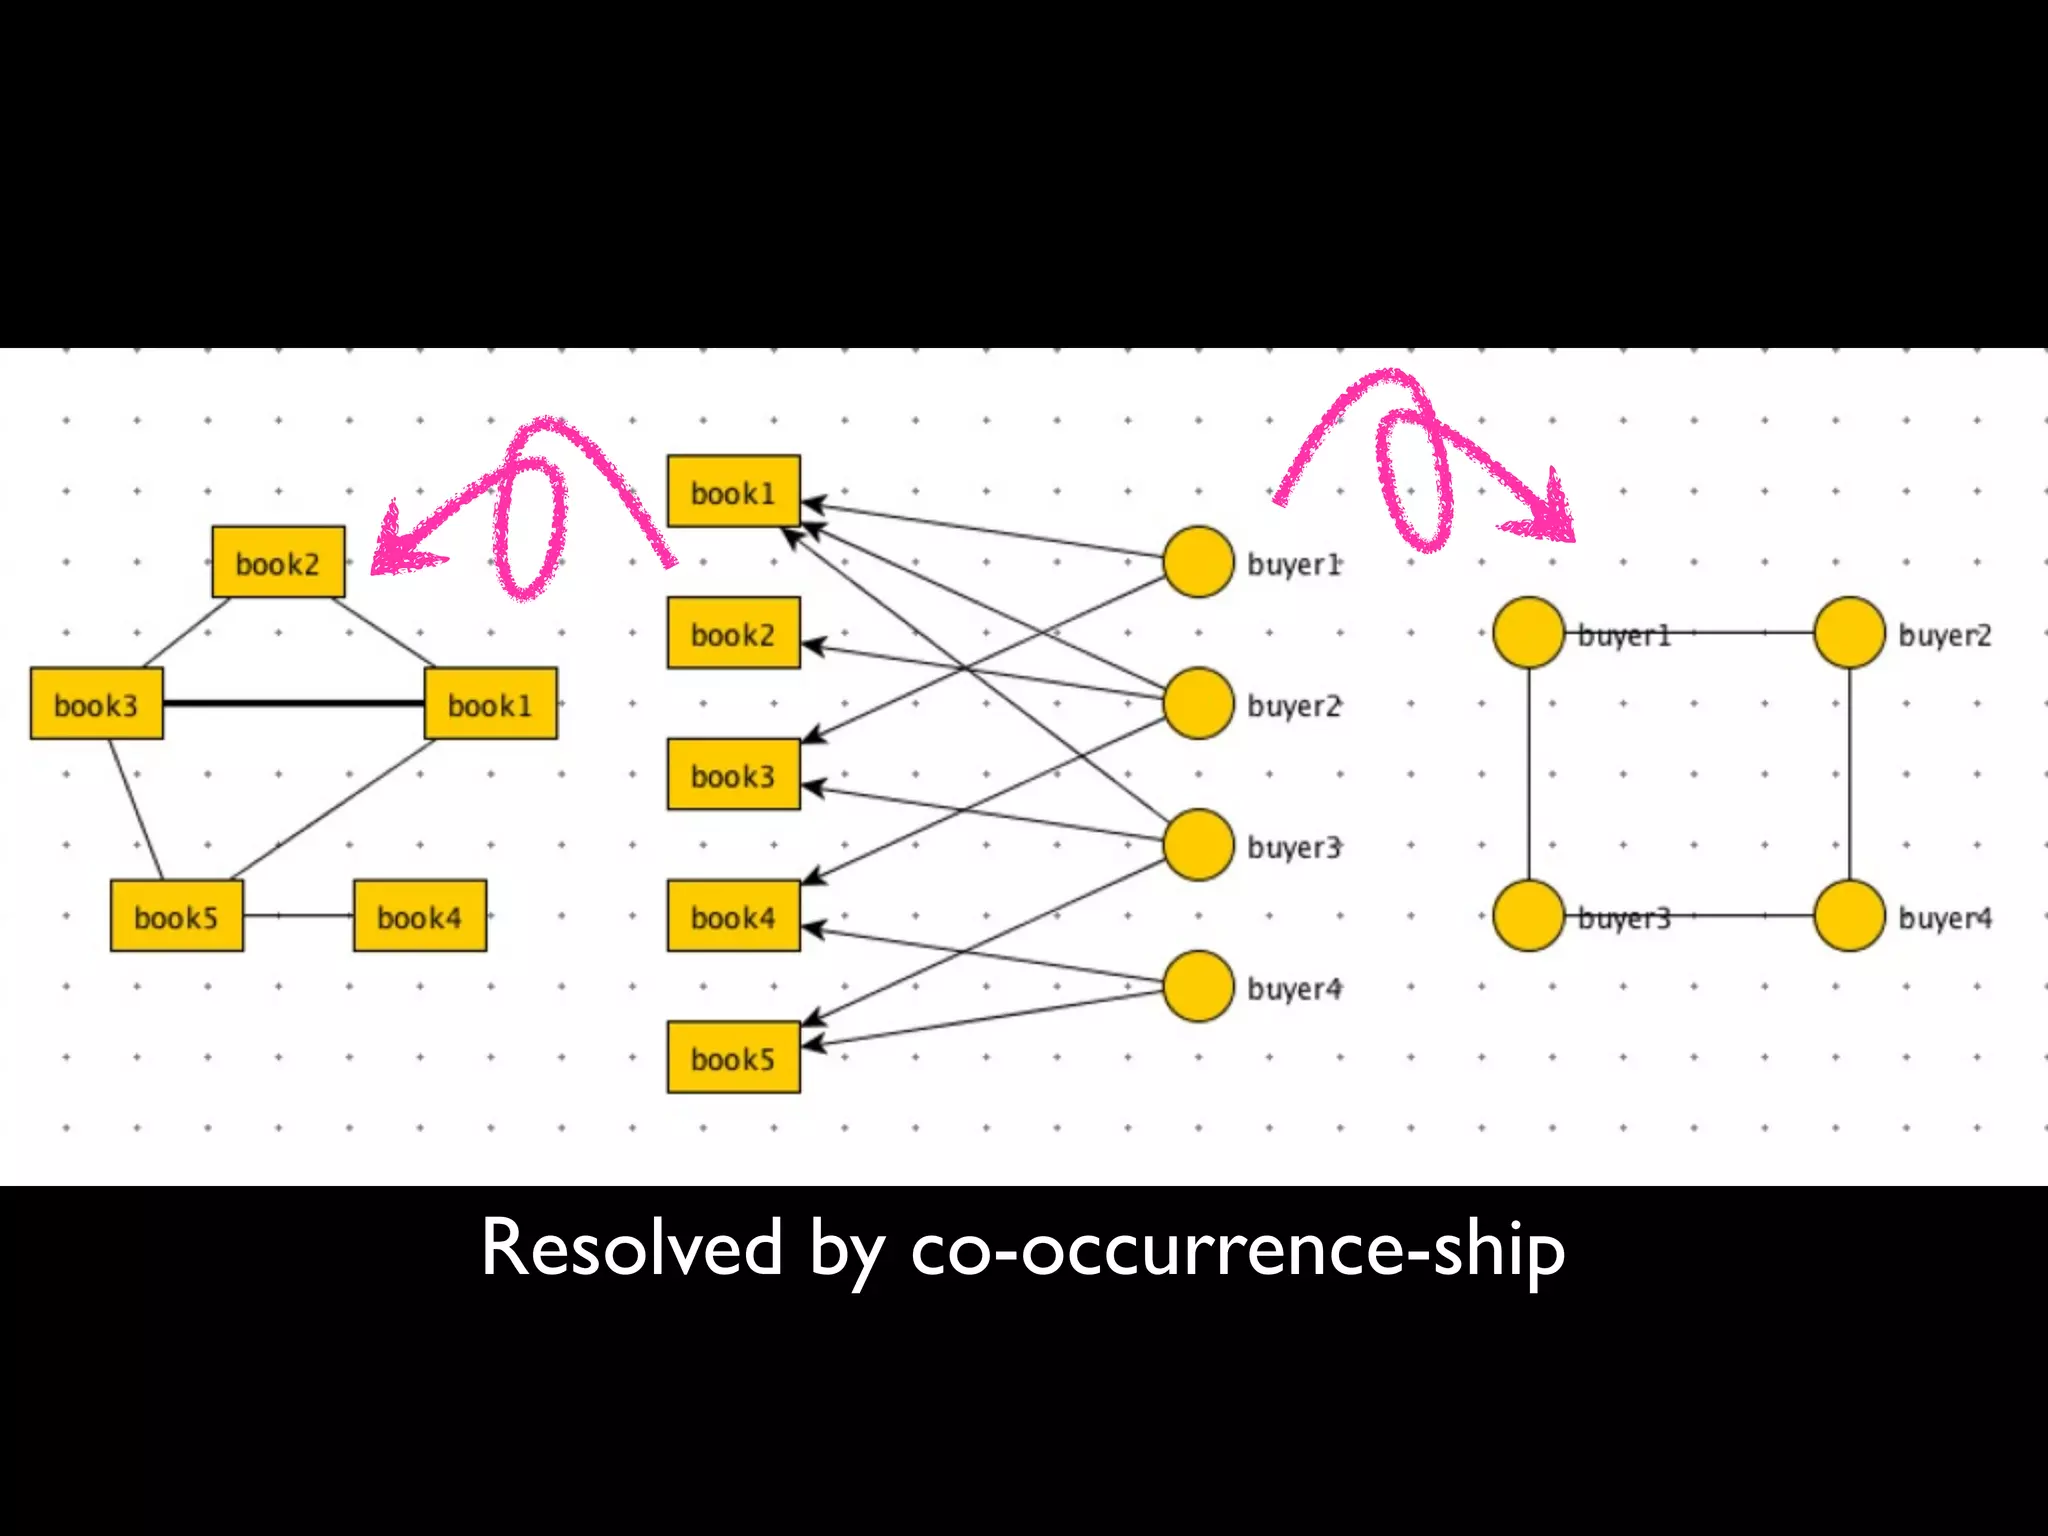

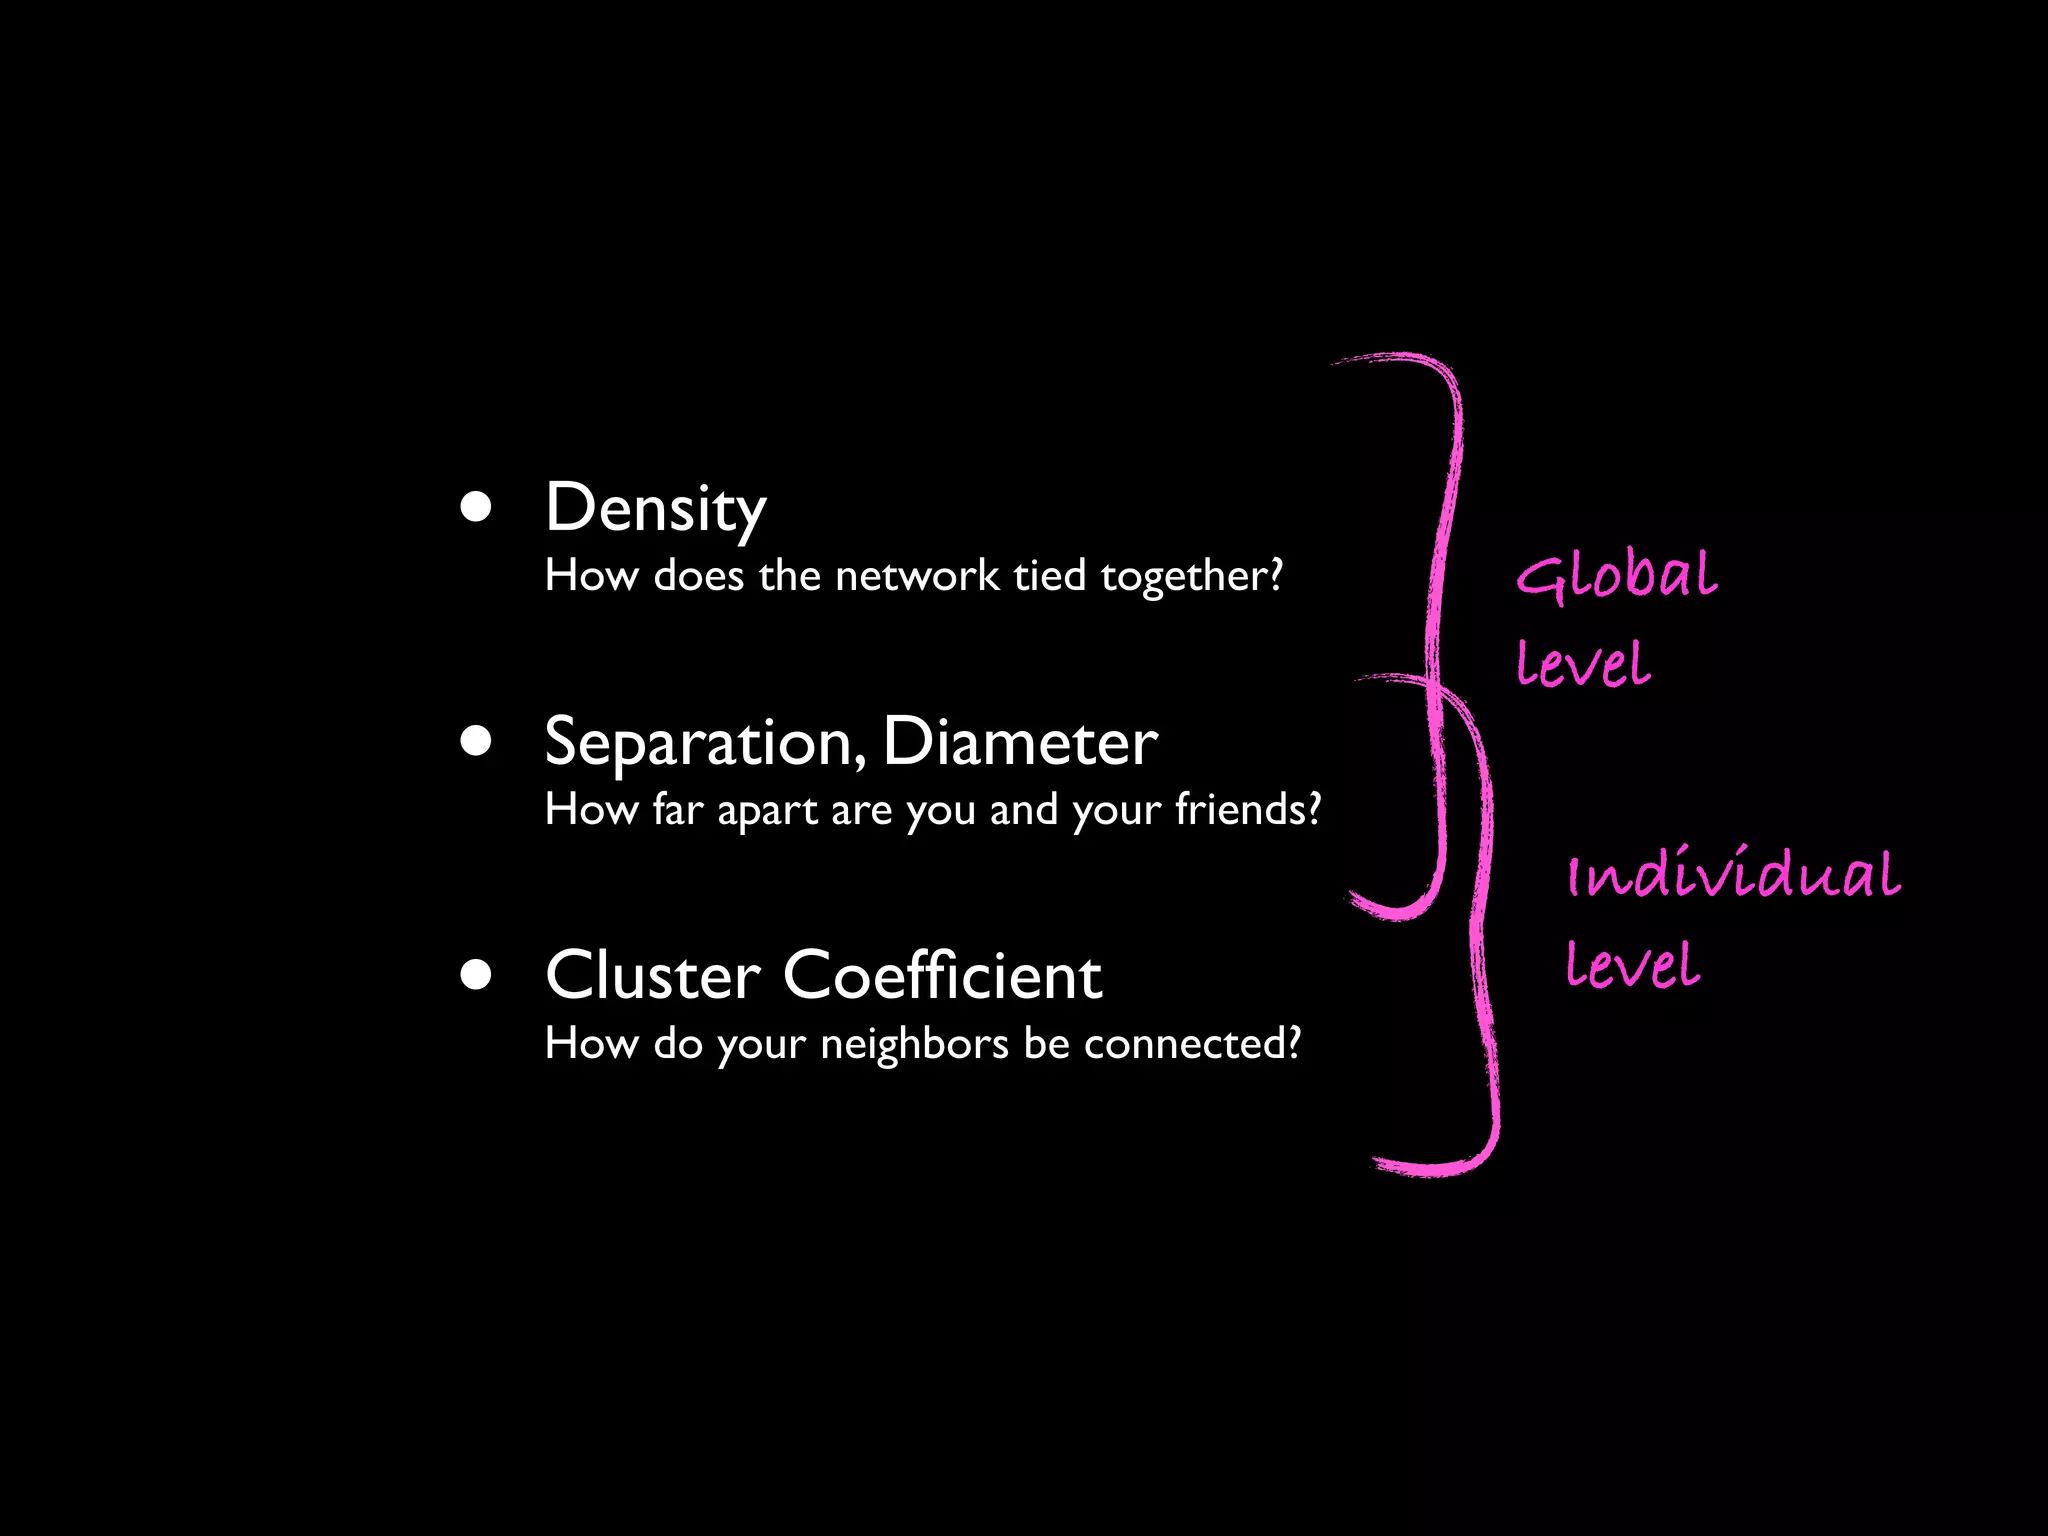
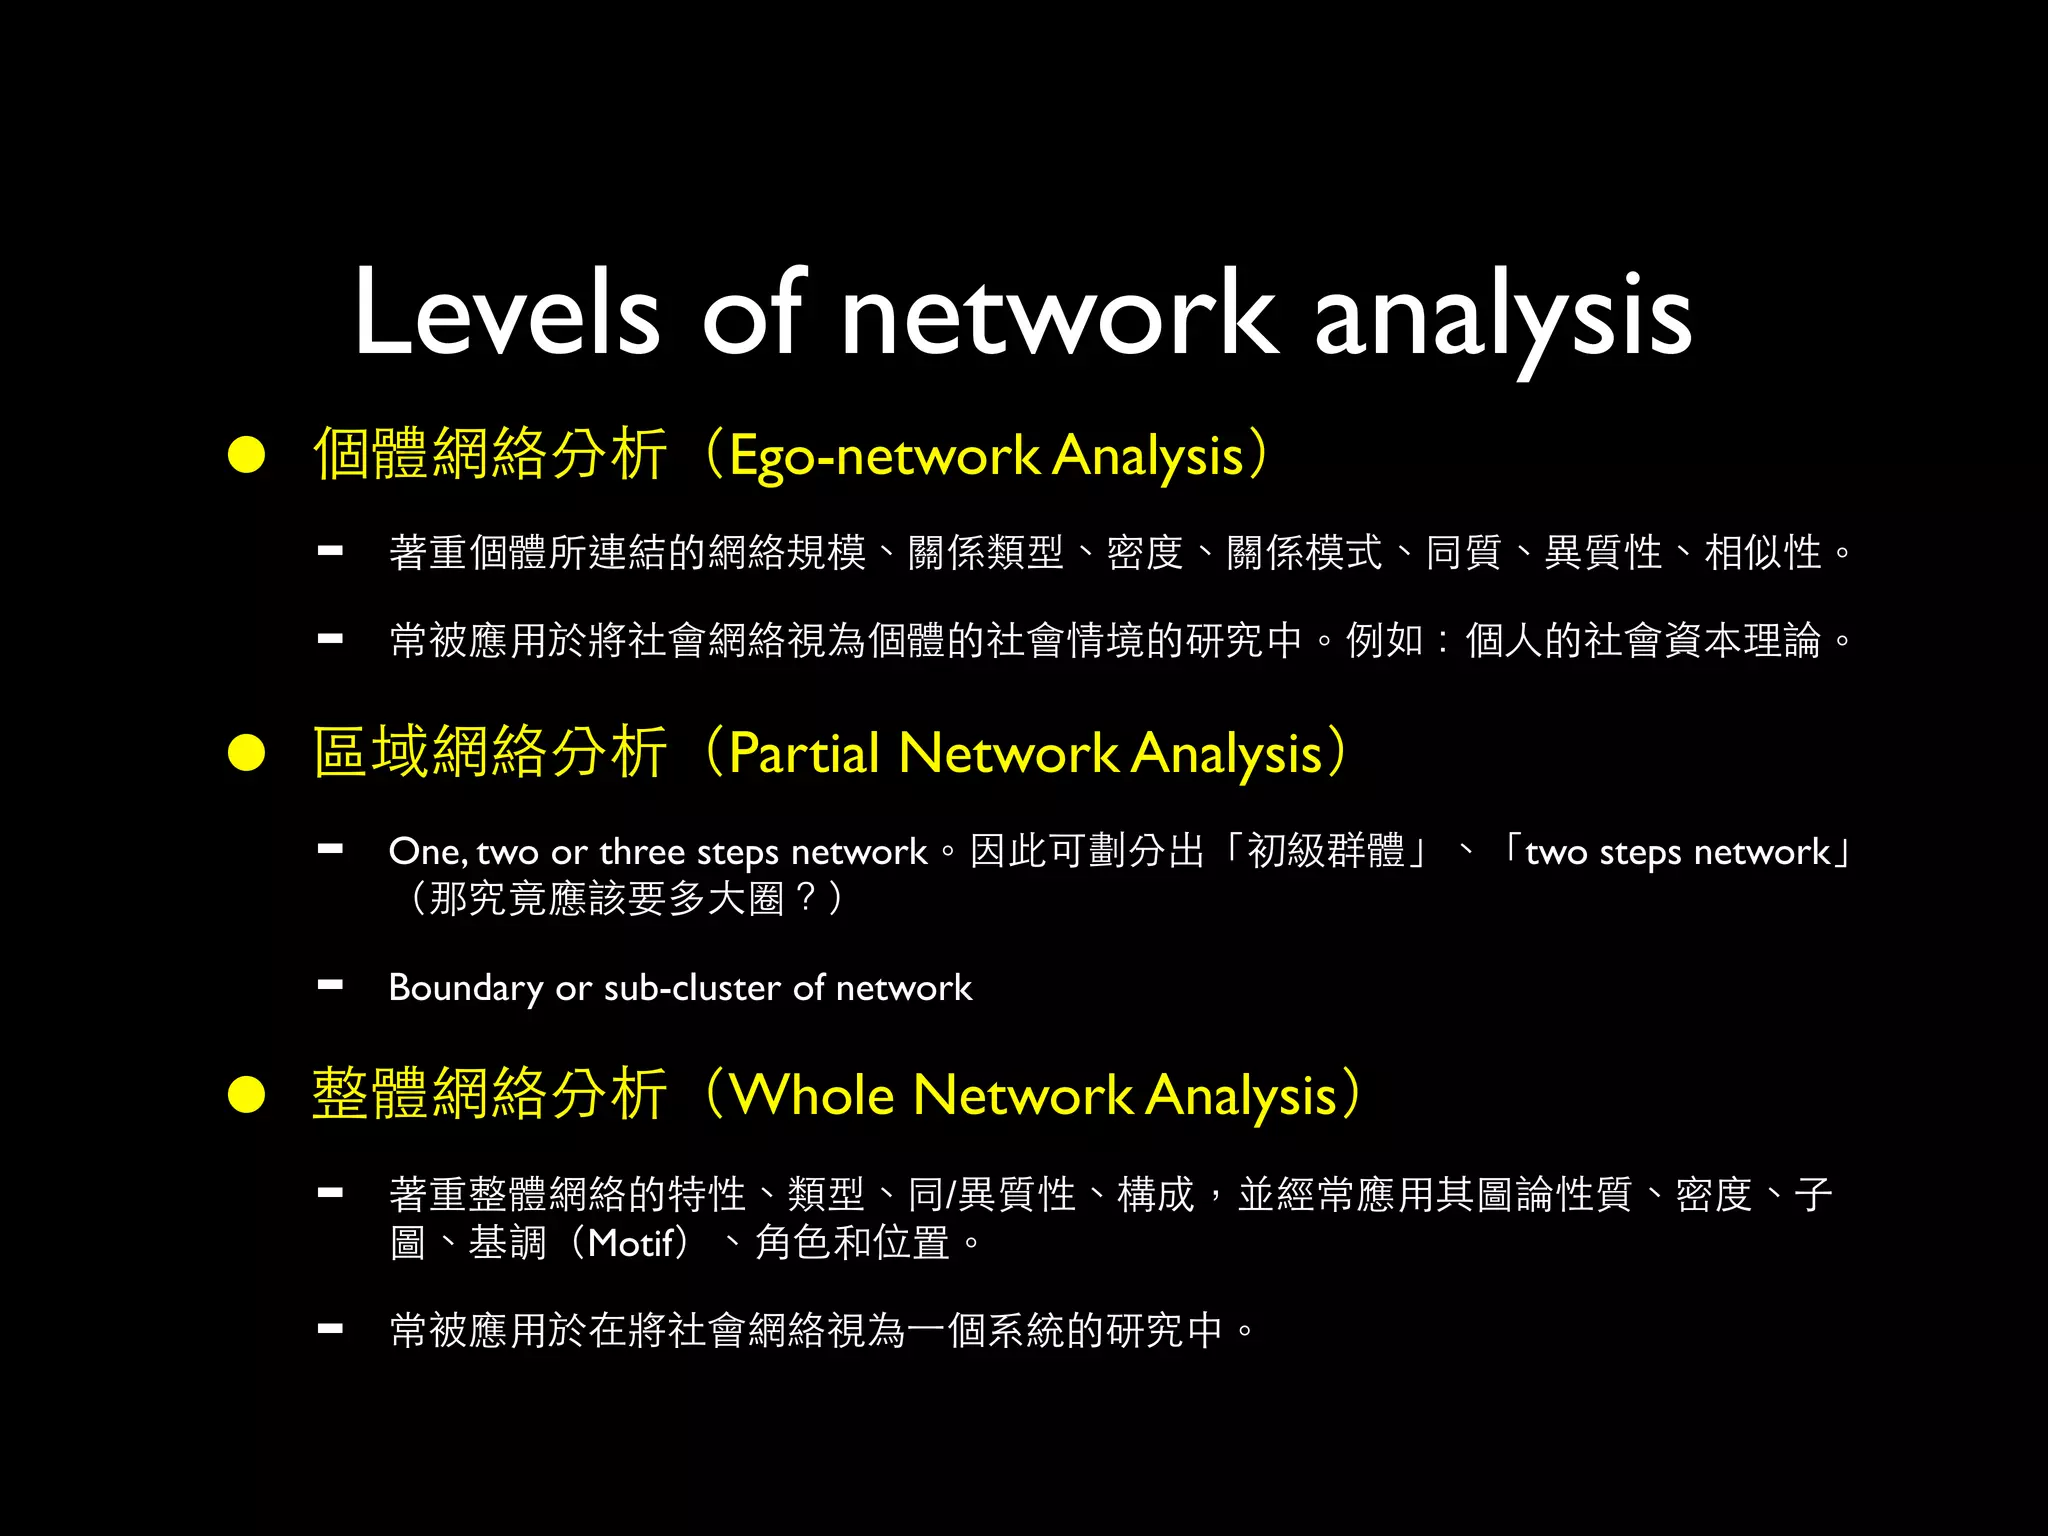


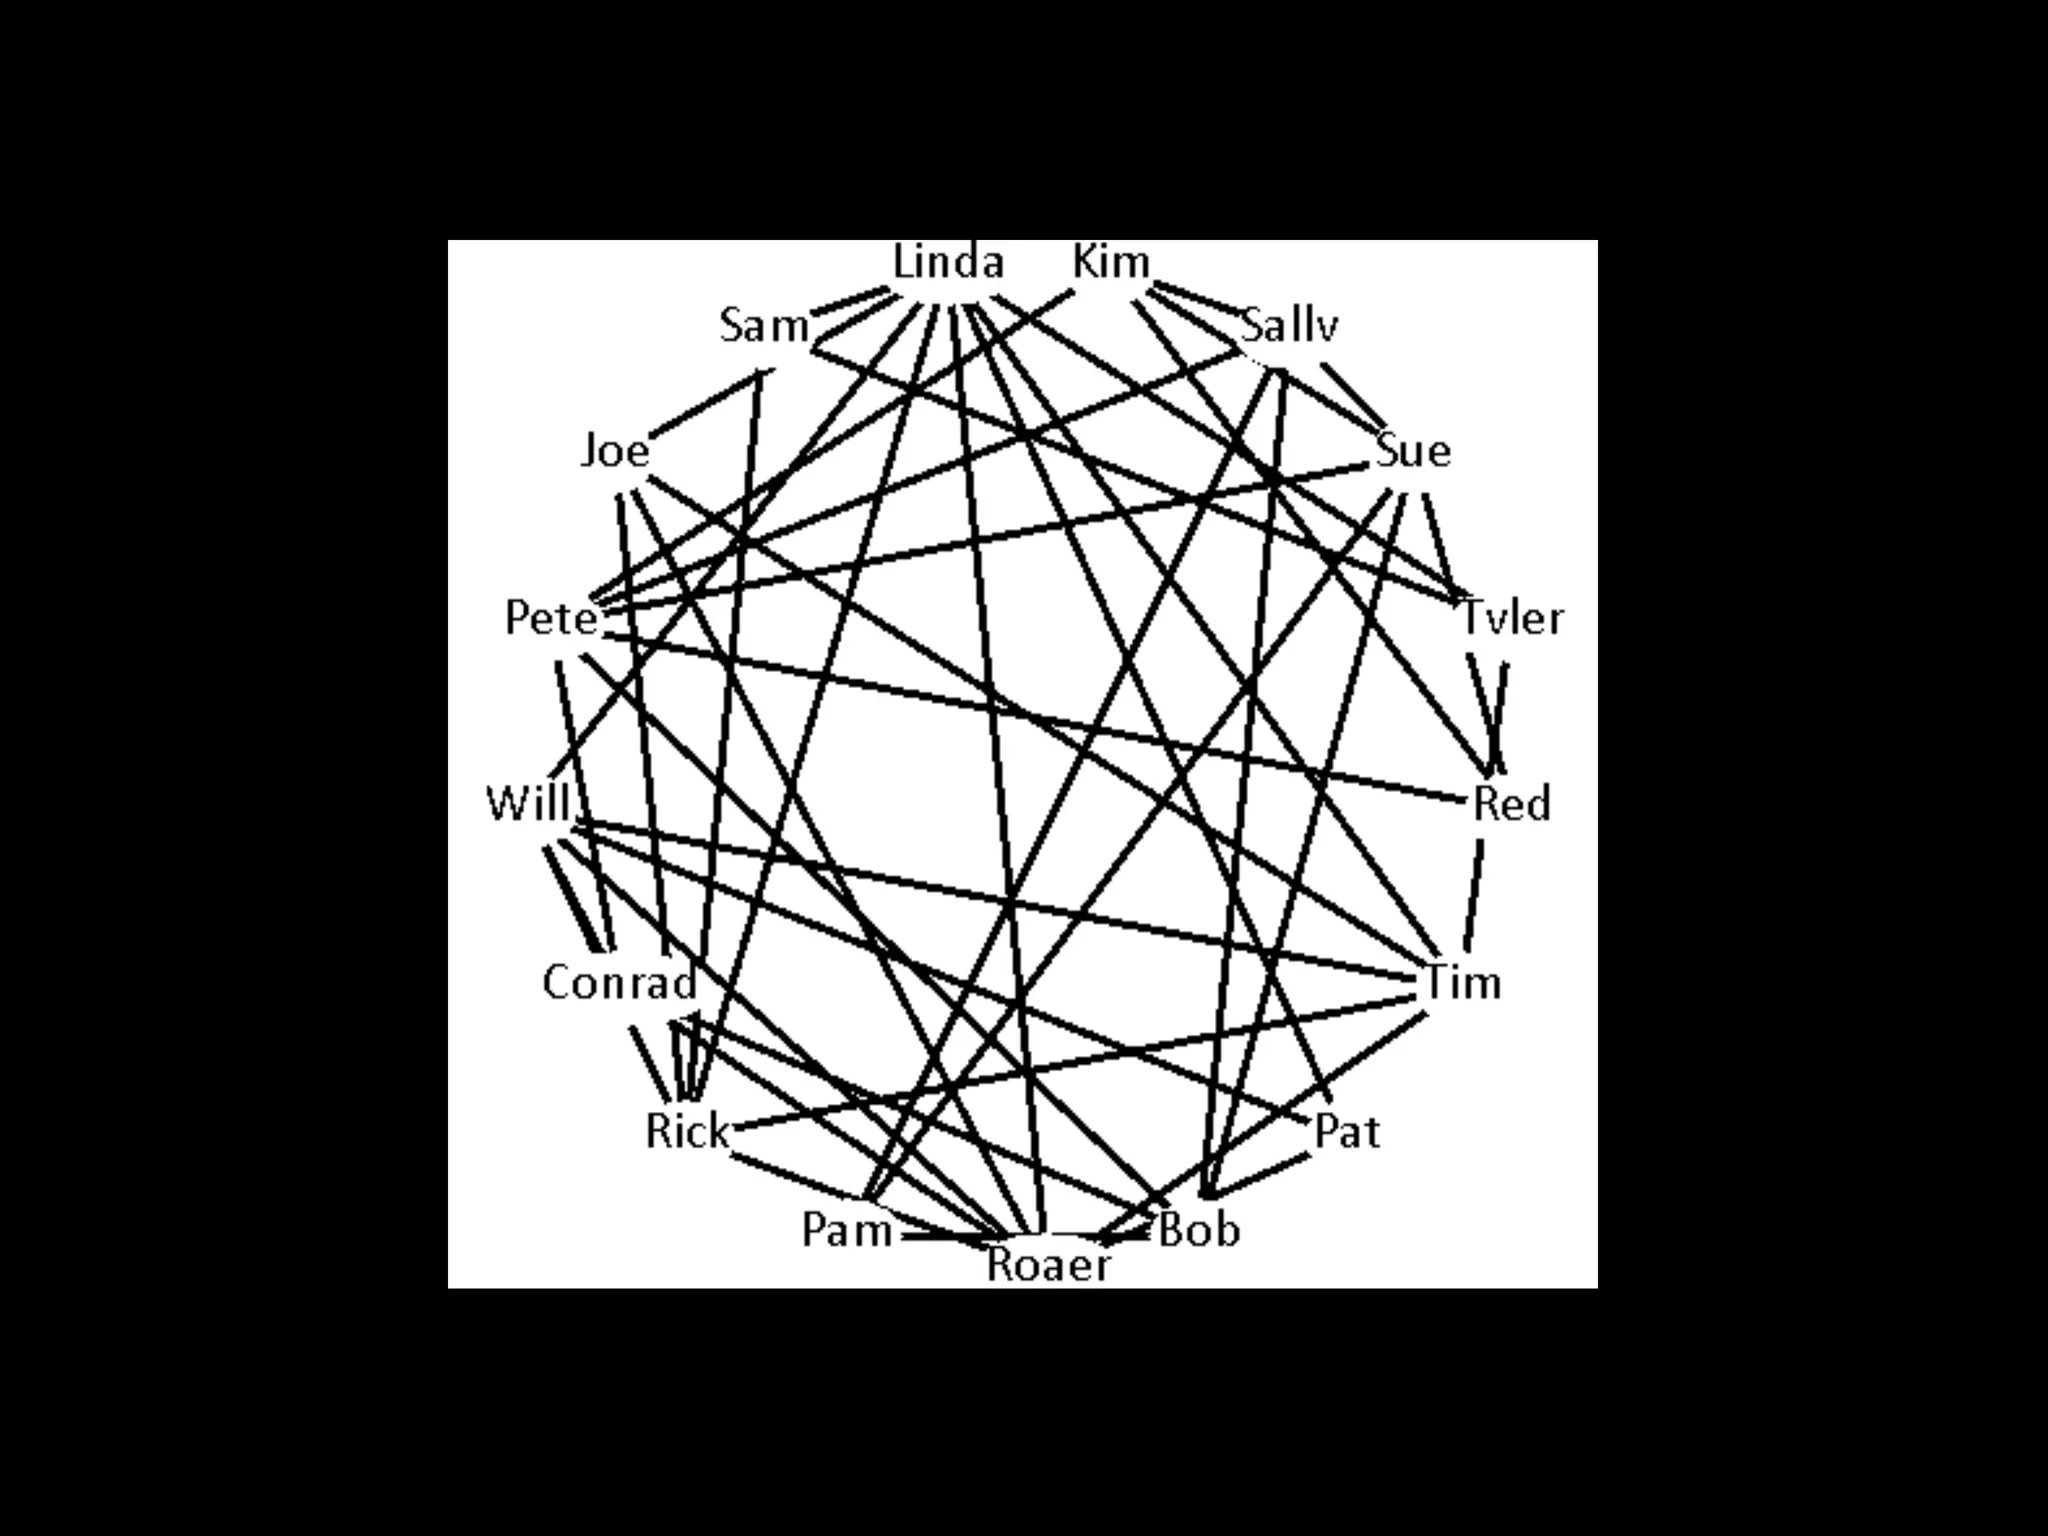

- Network analysis involves examining properties of nodes and edges in a network. Node properties include degree, clustering coefficient, and ego-density. Edge properties include weight and type. - Network properties examined at a global level include degree distribution, density, diameter, and average path length. Centrality measures like betweenness are also calculated. - There are different modes of networks including one-mode, two-mode, and affiliation networks. Levels of analysis include ego-network, partial network, and whole network analysis.