Markets Positioning Codex in MQL5 (Part 1): Bitwise Learning for Nvidia
Introduction
Today, this article serves as the pilot-edition in a new series that we’ll prefix with ‘Markets Positioning Codex in MQL5’. These articles will maintain a focused exploration into automated algorithmic trading for strategies that will mostly be tailored for Equities with predominantly a long only bias. Our adaptation of the ‘Codex’ concept stems from not just ‘bitwise-learning’, a structured approach at decomposing indicator signals into discrete patterns; but also incorporating the ever important ‘machine-learning’. The use of discrete patterns, as we have covered in the previous series, can later be combined for supervised training and testing. Recovering reliable market positioning signals, serves as the aim of this strategic approach, since we are isolating and rigorously evaluating uniquely set signal patterns.
For this article, we are focusing on Nvidia Corporation (NVDA), a well established, very liquid, highly dynamic company that to a large extent is driven by technological innovation-cycles, and corporate merger-acquisition activity. We want to leverage this market complexity and showcase, potentially, its robustness of merging the Relative Strength Index (RSI) and the DeMarker oscillator in a disciplined, tactical long only approach. The intended test window is from 2021 August to 2024 June, as a workaround MetaTrader 5’s Strategy-Tester constraints given that company stock splits cannot be imputed when testing. In live trading, this gets handled/addressed by most brokers, but Strategy Tester is yet to get a handle on this. For NVDA, the world’s most valuable company, its two most recent stock splits were very close to our start and stop test dates.
One of our key premises with this series is that in the last articles, the MQL5-Wizard-Articles, the bitwise patterns we had appeared to only work independently and failed to provide any traction when combined with each other when using the bitmap input integer parameter ‘patterns-used’. We therefore want to test, extensively, if this phenomenon of requiring strict/independent pattern use, subject to a trader’s own knowledge/experience, is something that continues to be a requirement even when we are maintaining a specific position, such as going long only when testing. When we didn’t have a specific position requirement, the argument against combining multiple patterns was that they would prematurely cancel each other out and thus provide ‘curve-fit’ results when training, that did not carry forward to live environments.
This premiere article in these series therefore sets the tone by looking at 10 signal patterns by coding only their long side. Our rationale as always is exploratory. We do tests for one signal pattern at a time, and as a late addendum, I added testing for not just all patterns but testing for signal patterns in pairs. This, which I did after the article draft was ready and was about to be published, showed different results from our option of combining any of the 10 signal patterns at a go.
With this piece, and hopefully many to follow within these series, the ‘Market Positioning Codex’, will not only provide some form of blueprint for discovering and building new signals for trading in MQL5, but also enrich the interpretation of trading algorithms by exposing complex, often oscillatory, inputs into usable code ideas.
Nvidia Corp. (NVDA)
This company, does stand out as a core, if not principal, asset in discretionary and trading strategies because of its pioneering role within the semiconductor field, especially as this relates to GPUs that are engaged in high performance computations, Artificial Intelligence, as well as gaming. Since one of their prime customers, OpenAI, as well as its competitors are currently in the spotlight, its stock has had a lot of major volatility and mostly upward price movement to now place it as the most valuable company in the World.
Important market events that have affected this company over the past five years have been its two major stock splits. The first of these happened in July 2021 where it made a 4 for 1 split of its stock, temporarily shrinking the price to 25% of its prior value. The second and most recent split was in June 2024 where a 10 for 1 split was made. Stock splits do change the way a stock’s price is perceived, by pretty much reducing the share price, while elevating the share count. The emphasis here is on the ‘perception’, because while most of the financial community and even brokers who support MetaTrader have adjustment systems in place to handle such splits, Strategy Tester in MetaTrader does not. This means open positions, which from our testing vantage would be long, can instantly margin call the account, depending on the margin level we are at.
For most brokers, including those that offer MetaTrader, these positions would be closed and reopened with increased volume to the split scale at the new low stock split prices, without affecting the previous profits of the opened position. So on the whole, it would be helpful if these split events could be preset in strategy tester prior to executing tests in order to cater for this anomaly. Using custom indicator prices, derived from such assets, that do not have these stock splits can also be another solution or substitute for the stock-split assets. Besides testing margin calls, an even more sinister problem, in the even the account shows some profitable test results, could be misinterpreting key support/resistance levels of a stock’s price.
Since we know in advance the split dates, and maintaining consistent prices is important throughout our test runs, the testing window that we use for this article is adjusted to run from August 1st 2021 to June 1st 2024. Within this test window, we train/optimize from August 1st 2021 to June 1st 2023. This period spans a major portion of NVDA’s historic rally, particularly the dynamic price-action that included the initial AI-driven trends, some corrections, as well as microstructure shifts. This gives us an almost even setting for checking out our indicator patterns are able to fare in the midst of ‘corporate-restructuring-events’.
So, whereas we could create a custom symbol instance of NVDA without these stock splits, using the raw broker data in the small window we have chosen should give similar results with no ‘interference’ or ‘biasing’ on our part over a period of the stock that was between two major corporate adjustments. In coming articles, we will explore performing some of this testing and adjustment to the stock splits from within python. The python IDE, provides a number of advantages, some of which, like execution efficiency that we have touched on in previous articles, but more broadly a wider library of indicators and tools which we will exploit not just in training but also for indicator selection. Even though, we have ‘pre-ordained’ the indicator pairing of RSI and DeMarker for use with NVDA, in the coming pieces, the indicator pair selection will be more rigorous.
The used indicators
We are arbitrarily selecting, for this article only and not the next, the indicator pairing of RSI oscillator and the DeMarker oscillator. Both are generally used for technical analysis to get a sense of market conditions and spot trading signals. They are also complimentary. Let's start with a basic recap of the RSI.
This oscillator, the RSI, was designed to size up recent price movements in order to evaluate overbought as well as oversold states. Its output metrics are always between 0 and 100. It is meant to be a reflection of pace and magnitude of price movements, and this helps traders identify changes in momentum. The classic formula is:
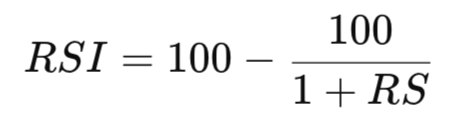
Where:
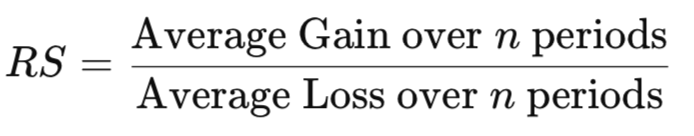
RS, the relative strength, is the ratio of mean upward movements in price to mean downward movements. The averaging period, n, is typically 14.
The steps in calculating this, begin by getting the upward and downward changes, which we represent as Ui and Di below.
![]()
Computing of the smoothed averages of the two values above can also be done using Wilder’s method, or the Exponential Moving Average. The RS and RSI values are then simply got from these two values by applying the above formulae. RSI values that are close to the 70 threshold usually are taken to indicate an overbought situation, or increased odds for a downward reversal in price. On the other end, indicator readings at the 30 threshold mark oversold circumstances and increased likelihood for a reversal upwards. It is worth noting, as a caveat, that in very strong trends the RSI can remain in the extreme zones for extended durations which is why when using it, pairing with another, preferably complimentary indicator can be a good idea. This is why for this article we are also using the DeMarker oscillator.
This oscillator, the DeMarker, was designed to get a reading on underlying demand by comparing the extremes in price of the current period to those in the prior. This can be useful in spotting market tops as well as bottoms, again in overbought and oversold situations. The basic formula is:
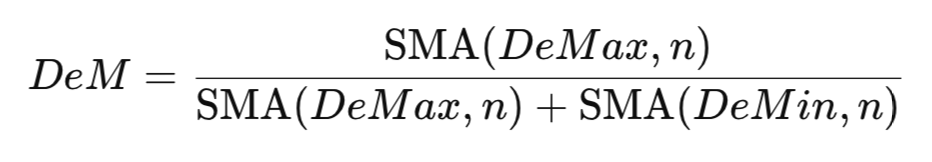
Where:
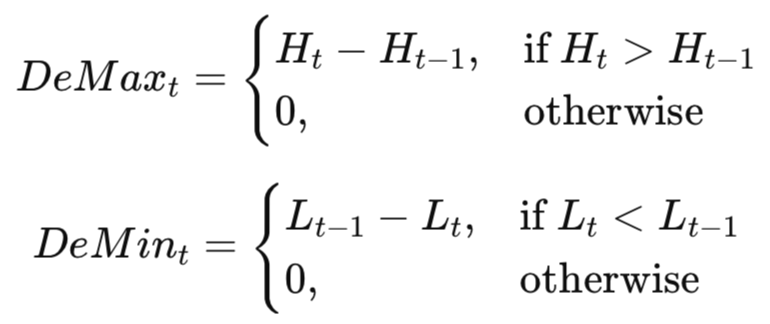
- SMA is a simple moving average
- H and L are the high and low prices in a time series t.
This oscillator prints outputs in the 0 to 1 range, and like the RSI, values at or north of 0.7 mark overbought conditions while those at or less than 0.3 indicate oversold states. Nonetheless, both the RSI and DeMarker are complimentary.
While the RSI does study price changes in general, the DeMarker does put the spotlight on price-extreme zones. This can allow traders to capture both momentum plays and imminent reversals. So, this article presents a study, on whether both these oscillators can help traders develop richer, multidimensional signals that spot market nuances especially given our long-only setting as we look at the price action of NVDA.
Pattern-0: Indicator Hidden Divergence
Our first signal, focuses on spotting divergences that are hidden when looking at price action and momentum oscillators. Readings from the RSI and DeMarker are merged with slope conditions to confirm or refute any directional bias in the markets. When in use, the hidden bullish divergence is marked if price registers a lower low while the RSI and the DeMarker log higher lows. This is interpreted as suggesting the underlying strength is present in spite of some apparent weakness. On a price chart, this may present as follows.
Price makes a lower low while both RSI and DeMarker make higher lows (hidden bullish divergence) and RSI slope(3) > 0.

The hidden bearish divergence, for its part, is registered when price makes a higher high with both oscillators declining to lower highs, a sign of waning momentum even though price is showing some strength. Our MQL source for both these conditions is listed as follows:
//+------------------------------------------------------------------+ //| Check for Pattern 0. | //1) Price-Indicator Hidden Divergence (slope + deviation) | //+------------------------------------------------------------------+ bool CSignalRSI_DeMarker::IsPattern_0(ENUM_POSITION_TYPE T) { if(T == POSITION_TYPE_BUY) { return(Low(X() + 1) > Low(X()) && DeMarker(X() + 1) < DeMarker(X()) && DeMarker(X()) < 0.4 && RSI(X() + 1) < RSI(X()) && RSI(X()) < 30.0 && RSI(X()) - RSI(X() + 3) > 0.0); } else if(T == POSITION_TYPE_SELL) { return(High(X() + 1) < High(X()) && DeMarker(X() + 1) > DeMarker(X()) && DeMarker(X()) > 0.6 && RSI(X() + 1) > RSI(X()) && RSI(X()) > 70.0 && RSI(X()) - RSI(X() + 3) < 0.0); } return(false); }
Above, we are trying to implement the mentioned logic by comparing price buffer lows and highs against respective indicator lows plus their highs, across a moving window. We work out the slope of the RSI, across a 3 bar interval, as being the difference or change in the RSI across that span. This serves as an extra filter that ensures that by being greater than zero for buys, the momentum is improving. When checking sells, this slope would be negative, however we are not exploring any sell positions for this article. A forward test when using just this signal, pattern-0 gives us the following report:

Our Nvidia forward run at the 4-hour timeframe from 2023.06.01 up to 2024.06.01 was able to transform the initial deposit of 10k to 11,904.57. Or about a 19 percent yield. This is from 39 trades. Trades were long only as already mentioned in the introduction and of the 39 entries 38 were in the green with just the one loser. This brought us to a profit factor of 15.24 with an expected payoff of 50 dollars per trade. Our Sharpe ratio was over 8 while the maximum drawdown remained in the 4.5 percent range which was about 500 dollars off the 10k. The LR correlation was too perfect at 1.00 given our price history quality of about 99 percent. This does indicate, potentially, that the entries were well aligned, with Nvidia’s trend. The Z-score of over 2 at 95.6 percent could imply that our winning streaks were not random noise, either. To sum up, we are capturing continuation trades post pullback in a very clean fashion. As a check on this performance, even if it is out of sample, one needs to run this pattern in more bearish streaks of the market and look for how well it is able to preserve capital.
Pattern-1: Slope Break with Price Confirmation
Our second signal, pattern-2, is constructed from early momentum changes. When these are spotted or registered within the slopes of the RSI and the DeMarker, and we combine this with price action confirmation via an Exponential Moving Average, we potentially have a solid bullish formation. This pattern may appear as follows on a chart, when the bullish conditions are met.
RSI slope(5) crosses from negative → positive and DeMarker slope(5) > 0 for 2 consecutive bars and price closes above the 8-period EMA.

The buy condition is marked when the RSI slope, when measured over 5 bars, changes from negative to positive, potentially signalling a switch from bearish momentum to bullish. The DeMarker’s also over 5 bars, maintains positivity on at least 2 consecutive bars, reinforcing that this momentum has traction. Finally, the price closes above the EMA affirming price follow through past any short term resistance. We implement this in MQL5 as follows:
//+------------------------------------------------------------------+ //| Check for Pattern 1. | //2) Leading-Indicator Slope Break with Price Confirmation | //+------------------------------------------------------------------+ bool CSignalRSI_DeMarker::IsPattern_1(ENUM_POSITION_TYPE T) { if(T == POSITION_TYPE_BUY) { return(DeMarker(X()) - DeMarker(X() + 5) > 0.0 && RSI(X() + 1) - RSI(X() + 5 + 1) < 0.0 && RSI(X()) - RSI(X() + 5) > 0.0 && Close(X()) > Cl(X()) && Close(X() + 1) > Cl(X() + 1)); } else if(T == POSITION_TYPE_SELL) { return(DeMarker(X()) - DeMarker(X() + 5) < 0.0 && RSI(X() + 1) - RSI(X() + 5 + 1) > 0.0 && RSI(X()) - RSI(X() + 5) < 0.0 && Close(X()) < Cl(X()) && Close(X() + 1) < Cl(X() + 1)); } return(false); }
The sell requirements are when the RSI slope switches to negative from positive, meaning we now have bearish momentum, and the DeMarker also indicates a negative slope for 2 consecutive bars. The slope spans, like with the bullish, are taken over 5 bars. Price would then also have to close below the EMA as a validation or final confirmation of the bearish thesis. Forward testing this pattern gave us the following test report:

Forward runs on this basic slope based pattern at the 4-hour chart turns 10k into 12,454 for a 24.5 percent performance. 46 trades are placed, of which again, 45 are winners, and we just have the one loser for a win rate north of 97 percent. With a profit factor of almost 18 and a Sharpe of 8.78 the LR correlation comes in almost perfect at 0.99 which again screams tight trend alignment as opposed to flukes. Equity drawdown stayed decent at 6.2 percent, while that for the balance was even more negligible at 1.19 percent. So, in general, pattern-1 is grabbing short-term inflections using EMA confirmations but given that these stats are too glossy with only 46 trades and that the safety measures such as stop-loss placement or filtering for volatility are not taken care of, this forward walk could still be deemed a curve-fit subject to having these measures in place and also testing in different market regimes.
Pattern-2: M/W Formations with Price Pullback
Our third signal, pattern-3, seeks out the classic M for double top and W for double bottom; formations on both the RSI and DeMarker oscillators. It then merges them with important price pullbacks or swings from prior crucial levels. In essence, it leverages oscillators’ ability to identify momentum flips from repeated peaks or troughs with price retesting of important support or resistance levels in order to validate pending reversals. The buy signal, given that we are only testing for NVDA buys, may appear as follows on a chart:
RSI forms a W (two troughs, second trough ≥ first) inside last 12 bars AND DeMarker also shows a W pattern AND price retraces to a prior resistance turned support (previous swing high) and holds.

Formally, the buy conditions would be met when both the RSI and DeMarker generate W-shaped patterns over any of their most recent 12 price bars. Price would then pull back to a prior resistance level that has now flipped to serve as a support - a case of holding above a prior high swing. We implement the M and W formation checks, together with pattern-2, in MQL5 as follows:
//+------------------------------------------------------------------+ //| Detect "M" (double-top) pattern | //+------------------------------------------------------------------+ bool CSignalRSI_DeMarker::IsM(const vector &v) { int n = (int)v.Size(); if(n < 5) return false; // Search sequentially for an M: high1 -> valley -> high2 for(int i = 1; i < n - 3; i++) { if(!LocalMax(v, i)) continue; // first peak (high1) for(int j = i + 1; j < n - 2; j++) { if(!LocalMin(v, j)) continue; // middle trough for(int k = j + 1; k < n - 1; k++) { if(!LocalMax(v, k)) continue; // second peak (high2) double high1 = v[i]; double valley = v[j]; double high2 = v[k]; // Geometric validation: // - both peaks should be above the valley // - second peak should not be significantly higher than the first (allow tiny tolerance) if(high1 > valley && high2 > valley && high2 <= high1 * 1.001) return true; } } } return false; }
//+------------------------------------------------------------------+ //| Detect "W" (double-bottom) pattern | //+------------------------------------------------------------------+ bool CSignalRSI_DeMarker::IsW(const vector &v) { int n = (int)v.Size(); if(n < 5) return false; // Search sequentially for a W: low1 → peak → low2 for(int i = 1; i < n - 3; i++) { if(!LocalMin(v, i)) continue; // first trough (low1) for(int j = i + 1; j < n - 2; j++) { if(!LocalMax(v, j)) continue; // middle peak for(int k = j + 1; k < n - 1; k++) { if(!LocalMin(v, k)) continue; // second trough (low2) double low1 = v[i]; double peak = v[j]; double low2 = v[k]; // Simple geometric validation: // peak must be above both lows, // and second low not much lower than the first. if(peak > low1 && peak > low2 && low2 >= low1 * 0.999) return true; } } } return false; }
//+------------------------------------------------------------------+ //| Check for Pattern 2. | //3) M/W Formation on Indicator + Price Pullback | //+------------------------------------------------------------------+ bool CSignalRSI_DeMarker::IsPattern_2(ENUM_POSITION_TYPE T) { vector _rsi, _demarker; _rsi.Init(fmax(5, m_past)); _demarker.Init(fmax(5, m_past)); for(int i = 0; i < fmax(5, m_past); i++) { _rsi[i] = RSI(i); _demarker[i] = DeMarker(i); } //Print(__FUNCTION__ + ": rsi, ", _rsi); //Print(__FUNCTION__ + ": demarker, ", _demarker); //_demarker.CopyIndicatorBuffer(m_demarker.Handle(), X(), 0, fmax(5, m_past)) && if(T == POSITION_TYPE_BUY) { return(IsW(_rsi) && IsW(_demarker) && Close(X()) > Close(X() + 1) && Close(X() + 1) < Close(X() + 2)); } else if(T == POSITION_TYPE_SELL) { return(IsM(_rsi) && IsM(_demarker) && Close(X()) < Close(X() + 1) && Close(X() + 1) > Close(X() + 2)); } return(false); }
The sell signal is conversely defined when both the RSI and DeMarker register M-shaped formations, a sign of double peaks. As with the bullish signal, the second peak of this formation needs to match or be lesser than the first. Price would rally to a recent support level, fail, and turn this level into a resistance, given the failure to push higher. Forward testing this signal, post optimization, gives us the following report:

Again, our forward test from 2023.06.01 to 2024.06.01 with our third signal pattern, pattern-2, grows the 10k initial deposit to just over 14k to log a 4,325 net gain. This signal pattern launched 54 trades, again all long following our theme for this article, gave us an ‘undefined’ profit factor since they all closed in the money. This performance was netting roughly 80 dollars a trade, and our Sharpe ratio was also sky-high at 9.23. The LR correlation interestingly falls shy of the perfect 1.0, probably die to some adverse forward excursions, unlike with pattern-0. However, for the most part the M/W structures not only identified early on end of move exhaustions, but they were spot on when it came to follow-through zones in instances where price retested a given level before a continuation.
With this preamble, it still worth stressing that these results are arguably too perfect for one to trust blindly. No positions were closed in the red, despite interim equity drawdowns that maxed at 8 percent. With 54 consecutive winner, the prognosis here isn’t bad strategy but, as with the already covered patterns above, a ‘beautifully overfitted curve’. One should look to implement risk controls, volatility filters and stricter exit logic if pattern-2 is to withstand choppy markets or a shift to a bearish market regime. One could argue that if we use pattern-2 as a timing tool for exhaustion entries that is paired with stronger higher level trend filters it could be promising however if it is left to operate on its own, it would be asking for a punch in the face!
Pattern-3: Compression Breakout with Indicator Divergence
Our next signal, that we index 3, is focused on spotting phases of NVDA with compressed price action. This is marked by narrow trading ranges. The central tenet behind this pattern is that market phases of low to sparse volatility, where the ATR or a suitable volatility metric provides modest readings, tend to be followed by breakout signals or very strong directional moves. Pattern-3 therefore uses indicator divergence to confirm these breakouts, when they occur. On a chart, the buy signal could appear as follows:
Price has been in a narrow range (ATR small / narrow high-low band for 8 bars) and then breaks above range high with RSI > RSI.mean(20) and DeMarker rising; if RSI and DeMarker formed higher lows during compression, bias stronger.

The buy signal for this pattern is when price has been kept in a tight range for a given number of bars, which number is an optimized or tuned parameter in our case. We mark the sticking to a range as a declining highs minus lows over this adjustable or optimizable period. In this compression, the RSI as well as the DeMarker show higher lows or lower lows respectively a sign of divergence and therefore increased likelihood of accumulating momentum. The breakout is affirmed when price rises past the prior high and the RSI is also north of its 20 period mean or is up-trending across an optimizable period. The DeMarker should also be trending higher. Furthermore, once divergence between the oscillators is marked with higher lows simultaneously, then the bullish case, for this pattern-3, gets strengthened. We implement as follows in MQL5:
//+------------------------------------------------------------------+ //| Check for Pattern 3. | //4) Compression Breakout with Indicator Divergence | //+------------------------------------------------------------------+ bool CSignalRSI_DeMarker::IsPattern_3(ENUM_POSITION_TYPE T) { if(T == POSITION_TYPE_BUY) { return(Hi(X() + m_past + 1) - Lo(X() + m_past + 1) > Hi(X() + 1) - Lo(X() + 1) && Close(X()) > Hi(X()) && RSI(X()) > RSI(X() + m_past) && DeMarker(X()) > DeMarker(X() + 1)); } else if(T == POSITION_TYPE_SELL) { return(Hi(X() + m_past + 1) - Lo(X() + m_past + 1) > Hi(X() + 1) - Lo(X() + 1) && Close(X()) < Lo(X()) && RSI(X()) < RSI(X() + m_past) && DeMarker(X()) < DeMarker(X() + 1)); } return(false); }
The sell signal logic is a mirror of the bullish above, with price also being in a narrow range under an RSI and DeMarker decline. This would then be followed by a price break below the previous range low. As with the bullish pattern, the RSI being below its mean and DeMarker trending downward do support the case for a break of price lower. Pattern-3 is important because it identifies the calm before the storm, and aims to capitalize on this by heightening the lookout for any key price breaks. One of the major tools at play here, as mentioned above, is the spotting of divergences. From a forward test run of this pattern on Nvidia Corp stock price from 2023.06.01 to 2024.06.01, while placing trades exclusively base on pattern 3, and its optimized settings, we got the following results:

The strategy tester report above for our fourth signal pattern, pattern-3, much like what we have already covered, exhibited a solid breakout approach to trading Nvidia. We were still executing only buy logic, which happens to align with the prevalent bullishness in US-tech over this time horizon, by requiring our pattern to confirm breakouts with the RSI going past its mean, while the DeMarker is on the up. In this forward walk, the Expert Advisor fired off 78 trades with all finishing in the black, bringing in a net profit of over 3k off an initial deposit of 10k. This 30 percent return with a trade payoff of almost 39 dollars had a profit factor of 9.63 with an LR correlation of 0.99. The maximum equity drawdown was also only 5.7 percent. This wow streak of 78 consecutive wins does demonstrate the manner in which this pattern cleanly takes part in the NVDA trend despite the fixed profit targets, which in essence implies that the entries are decently precise to accommodate intra bar noise and still close with sizable profits.
Even though pattern-3 shows strengths in identifying entry and exit points along NVDA’s bullish run, there are areas that could use improvement. The deepest drawdown was almost 40 percent and the largest single loss was more than 3,700, two statistics that underscore pattern-3’s risks to failing breakouts or sharp reversals. The system’s ability to recover, as indicated by the recovery factor and regular win count, do try to compensate for this there lurks a need for more effective stop management.
Pattern-4: Swing Fails on Oscillator Confirmation
Our concluding pattern, for this article, features the classic swing concept as brought-into-vogue by Larry Williams. We adopt it here for the RSI and DeMarker as confirmations to momentum shifts, without depending on the typical threshold levels. A chart representation of pattern-4, for a buy, could be indicated as follows:
RSI makes bullish failure swing (RSI falls below 30, rallies above its previous high without returning below the trough) AND DeMarker > 0.45 and price closes above the swing high.

The buy condition is triggered when the RSI, drops below the oversold level, a baseline that is typically 30, and then rallies above it, surpassing prior highs without retreating. A bullish failure swing. The DeMarker for its part confirms momentum as well by shifting above the 0.45 level. On top of these two oscillator readings, price would close above the previous swing high, thus consolidating the bullish signal. We implement this in MQL5 as follows:
//+------------------------------------------------------------------+ //| Check for Pattern 4. | //5) Failure Swing (Williams-style) on RSI + Dem confirmation | //+------------------------------------------------------------------+ bool CSignalRSI_DeMarker::IsPattern_4(ENUM_POSITION_TYPE T) { if(T == POSITION_TYPE_BUY) { return((Close(X()) >= Hi(X()) || Close(X()) >= High(X() + 1)) && RSI(X() + 2) < RSI(X() + 1) && RSI(X() + 1) > RSI(X()) && RSI(X()) <= 30.0 && DeMarker(X()) > 0.45); } else if(T == POSITION_TYPE_SELL) { return((Close(X()) <= Lo(X()) || Close(X()) <= Low(X() + 1)) && RSI(X() + 2) > RSI(X() + 1) && RSI(X() + 1) < RSI(X()) && RSI(X()) >= 70.0 && DeMarker(X()) < 0.55); } return(false); }
The sell condition is defined when the overbought threshold, usually 70, is breached by the RSI, only for it to subsequently decline, below its previous lows without retesting prior peaks, again a bearish failure swing. The DeMarker would remain below 0.55 and price would close below the previous swing low as a validation to the sell signal. Forward testing in similar conditions to the four patterns we have already looked at above, after an optimization run, gives us the following report:

Our fifth signal, pattern-4, has its entries locked onto Nvidia;s upswings with some precision such that we are able to yield the 30 percent return. The forward run made 57 trades, again with all winners, producing a Sharpe of 9.20 and an LR correlation of 0.99. This performance, as noted with earlier patterns above, may be too much in love with the Nvidia bullish regime given the undefined profit factor and close to zero equity drawdown. Extra stress testing in bearish regimes, with probably the introduction of volatility filters and some risk management could be a key prerequisite before this pattern gets additional consideration, as with the prior four. The full source, usable by the MQL5 Wizard, is attached below.
Conclusion
In closing, this first installment of the Markets Positioning Codex in MQL5 has laid some groundwork for a structured exploration into one-position-type signal patterns by testing with Nvidia. We intend to test a lot of equities in these series, and therefore our one-position-type testing will feature a lot of long positions. For our tested equity for this article, Nvidia, its period was dominated by sustained bullish momentum which means testing long only systems is pointless? Well, no. Our use of one-position-type Expert Advisors is meant to better exploit the trading with more than one signal pattern.
Recall in the prior series, a major drawback with bitwise learning was that the individual performance of each signal pattern could not be maintained when the signal patterns were combined because they tended to cancel each other out such that the rosy training results were simply curve fits, that could not be replicated in out of sample prices. This one-position-type approach therefore seeks to explore/exploit this and in addition we will consider 2-pattern-only, or 3-pattern-only combinations as well in future pieces.
| name | description |
|---|---|
| EMC-1.mq5 | Assembled Expert Advisor whose header lists references |
| SignalEMC-1.mqh | Custom Signal Class File |