Deep Learning Containers (DLC) provides comprehensive and detailed metrics and allows you to monitor and view the status of resources and obtain resource loads. You can use the monitoring and alerting feature provided by DLC to monitor the resource usage of DLC jobs in real time and flexibly configure alert rules and notifications. For example, if GPU utilization is greater than the specified threshold, an alert notification is sent. This topic describes how to use CloudMonitor or Application Real-Time Monitoring Service (ARMS) to view monitoring data, configure alert notifications, and subscribe to monitoring metrics.
Prerequisites
One or more DLC jobs are created. For more information, see Submit training jobs.
Limits
The monitoring feature is not supported for training jobs that is created by using general computing resources and uses the pay-as-you-go billing method.
Operation account and permission requirements
Alibaba Cloud account: You can use an Alibaba Cloud account to complete all operations without additional authorization.
RAM user:
If you want to view the monitoring data of a DLC job in a workspace as a RAM user, make sure that the RAM user meets the following requirements:
The RAM user is a member of the workspace and assigned one of the following roles: administrator, algorithm developer, and algorithm O&M engineer. For more information, see Manage members of a workspace.
The AliyunCloudMonitorReadOnlyAccess policy is attached to the RAM user. For more information, see Grant permissions to a RAM user.
If you want to view the monitoring data of a DLC job in a workspace and configure alert notifications as a RAM user, make sure that the RAM user meets the following requirements:
The RAM user is a member of the workspace and assigned one of the following roles: administrator, algorithm developer, and algorithm O&M engineer. For more information, see Manage members of a workspace.
The AliyunCloudMonitorFullAccess policy is attached to the RAM user. For more information, see Grant permissions to a RAM user.
Monitoring metrics and description
Metrics cover the following aspects: CPU, memory, disk, network, Remote Direct Memory Access (RDMA), Cloud Parallel File Storage (CPFS), and GPU metrics such as GPU utilization, computing power utilization, streaming multiprocessor (SM) utilization, and the amount of data that is received or sent when Peripheral Component Interconnect Express (PCIE) or NVLink is used. The job, pod, and GPU dimensions are supported. This section lists some typical health-related metrics. You can view all metrics and their details on the PAI-DLC Container Training page.
Job dimension
Metric | Description |
JOB_CPU_UTIL | The CPU utilization of a job. |
JOB_MEMORY_UTIL | The memory usage of a job. |
JOB_DISK_READ_BYTES_TOTAL | The disk read rate for a job. Unit: MiB/s. |
JOB_DISK_WRITE_BYTES_TOTAL | The disk write rate for a job. Unit: MiB/s. |
JOB_NETWORK_RECEVICE_BYTES_TOTAL | The network receive rate for a job. Unit: MiB/s. |
JOB_NETWORK_TRANSMIT_BYTES_TOTAL | The network send rate for a job. Unit: MiB/s. |
JOB_GPU_ACCELERATOR_DUTTY_UTIL | The GPU computing power utilization of a job. |
JOB_GPU_ACCELERATOR_MEMORY_UTIL | The GPU memory usage of a job. |
JOB_GPU_SM_UTIL | The GPU SM utilization of a job. |
JOB_GPU_POWER_USAGE | The GPU power consumption of a job. |
JOB_GPU_TEMPERATURE | The GPU temperature of a job. |
JOB_GPU_HEALTH | The overall health status of the GPUs for a job. 100% indicates that the GPUs are healthy. If the value of this metric is less than 100%, some GPUs may be abnormal. |
JOB_RDMA_RECEIVE_BYTES_TOTAL | The data receive rate for a job when RDMA is used. |
JOB_RDMA_TRANSMIT_BYTES_TOTAL | The data send rate for a job when RDMA is used. |
JOB_CPFS_WRITE_BYTES_TOTAL | The data write rate to CPFS for a job. Unit: MiB/s. |
JOB_CPFS_READ_BYTES_TOTAL | The data read rate from CPFS for a job. Unit: MiB/s. |
JOB_GPU_NVLINK_RECEIVE | The amount of data that is received by the GPU device for a job when NVLink is used. |
JOB_GPU_NVLINK_TRANSMIT | The amount of data that is sent to the GPU device for a job when NVLink is used. |
JOB_GPU_PCIE_RECEIVE | The amount of data that is received by the GPU device for a job when PCIe is used. |
JOB_GPU_PCIE_TRANSMIT | The amount of data that is sent by the GPU device for a job when PCIe is used. |
You can view the details of the metrics on the PAI-DLC Container Training page. | |
Pod dimension
Metric | Description |
POD_CPU_UTIL | The CPU utilization of a pod. |
POD_MEMORY_UTIL | The memory usage of a pod. |
POD_DISK_READ_BYTES_TOTAL | The disk read rate for a pod. Unit: MiB/s. |
POD_DISK_WRITE_BYTES_TOTAL | The disk write rate for a pod. Unit: MiB/s. |
POD_NETWORK_RECEVICE_BYTES_TOTAL | The network receive rate for a pod. Unit: MiB/s. |
POD_NETWORK_TRANSMIT_BYTES_TOTAL | The network send rate for a pod. Unit: MiB/s. |
POD_GPU_ACCELERATOR_DUTTY_UTIL | The GPU computing power utilization of a pod. |
POD_GPU_ACCELERATOR_MEMORY_UTIL | The GPU memory usage of a pod. |
POD_GPU_SM_UTIL | The GPU SM utilization of a pod. |
POD_GPU_POWER_USAGE | The GPU power consumption of a pod. |
POD_GPU_TEMPERATURE | The GPU temperature of a pod. |
POD_GPU_HEALTH | The overall health status of the GPUs for a pod. 100% indicates that the GPUs are healthy. If the value of this metric is less than 100%, some GPUs may be abnormal. |
POD_RDMA_RECEIVE_BYTES_TOTAL | The data receive rate for a pod when RDMA is used. Unit: MiB/s. |
POD_RDMA_TRANSMIT_BYTES_TOTAL | The data send rate for a pod when RDMA is used. Unit: MiB/s. |
POD_CPFS_READ_BYTES_TOTAL | The data read rate from CPFS for a pod. Unit: MiB/s. |
POD_CPFS_WRITE_BYTES_TOTAL | The data write rate to CPFS for a pod. Unit: MiB/s. |
POD_GPU_NVLINK_RECEIVE | The amount of data that is received by the GPU device for a pod when NVLink is used. |
POD_GPU_NVLINK_TRANSMIT | The amount of data that is sent to the GPU device for a pod when NVLink is used. |
POD_GPU_PCIE_RECEIVE | The amount of data that is received by the GPU device for a pod when PCIe is used. |
POD_GPU_PCIE_TRANSMIT | The amount of data that is sent to the GPU device for a pod when PCIe is used. |
You can view the details of the metrics on the PAI-DLC Container Training page. | |
GPU dimension
Metric | Description |
CARD_GPU_DRAM_ACTIVE_UTIL | The interface utilization of one or more GPUs for a pod. |
CARD_GPU_SM_UTIL | The SM utilization of one or more GPUs for a pod. |
CARD_GPU_POWER_USAGE | The power consumption of one or more GPUs for a pod. |
CARD_GPU_TEMPERATURE | The temperature of one or more GPUs for a pod. |
CARD_GPU_HEALTH | The overall health status of one or more GPUs for a pod. 100% indicates that the GPUs are healthy. If the value of this metric is less than 100%, some GPUs may be abnormal. |
You can view the details of the metrics on the PAI-DLC Container Training page. | |
Use CloudMonitor
Billing
CloudMonitor provides a specific amount of free quotas. For more information, see Pay-as-you-go.
View monitoring data
Monitoring dashboard
Log on to the CloudMonitor console.
In the left-side navigation pane, choose .
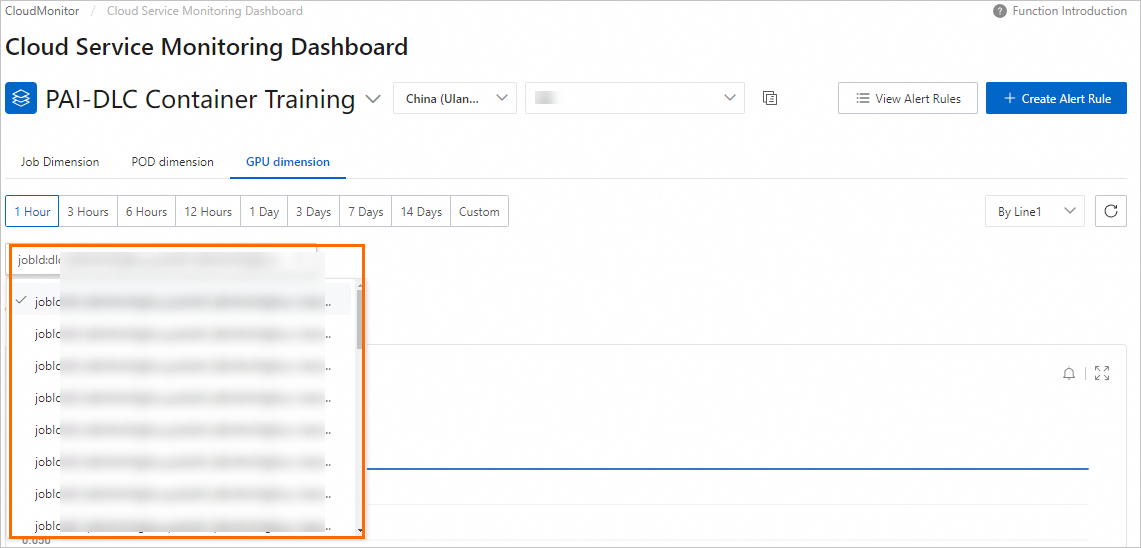
On the Cloud Service Monitoring Dashboard page, select PAI-DLC Container Training from the drop-down list. In the WorkspaceId search box, select the desired workspace ID from the drop-down list or search for the desired Workspace ID to view the monitoring charts. For information about how to query the ID of a workspace, see Manage workspaces.
 You can perform the following operations on the page:
Switch the monitoring dimension: The job dimension, pod dimension, and GPU dimension are supported.
Click the Job Dimension tab. On this tab, you can select the ID of a DLC job from the drop-down list or enter the ID of a DLC job to view the monitoring data of the job.

Click the POD dimension tab. On this tab, you can select the ID of a pod from the drop-down list or enter the ID of a pod to view the monitoring data of the pod.

Click the GPU dimension tab. On this tab, you can select the ID of a pod from the drop-down list or enter the ID of a pod to view the GPU-related monitoring data of the pod for the specified DLC job.
Switch the time range of monitoring data:

Zoom in a chart: In the upper-right corner of a chart, you can click the
 icon to view the details of the chart.
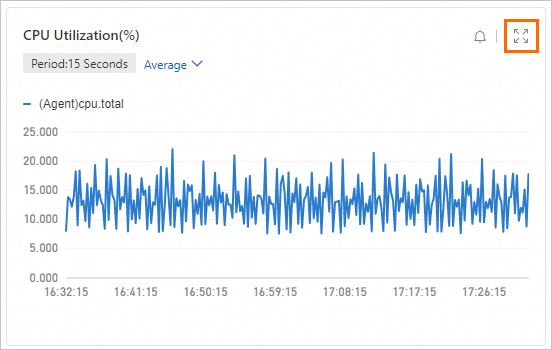
Configure alerts
The monitoring and alerting feature allows you to monitor the resource usage of DLC jobs and flexibly configure alert rules. For example, you can configure an alert rule to enable the system to send a notification when the resource usage is lower than a specific value. This topic describes how to configure the monitoring and alerting feature in the CloudMonitor console and by calling API operations.
Configure an alert contact
Log on to the CloudMonitor console.
In the left-side navigation pane, choose .
On the Alert Contacts tab, click Create Alert Contact.
In the Set Alert Contact panel, enter the name, email address, and webhook URL of the alert contact.
Click OK.
On the Alert Contact Group tab, click Create Alert Contact Group.
In the Create Alert Contact Group panel, enter a name for the alert contact group and add alert contacts to the alert contact group.
Click Confirm.
Configure alert rules
In the left-side navigation pane of the CloudMonitor console, choose .
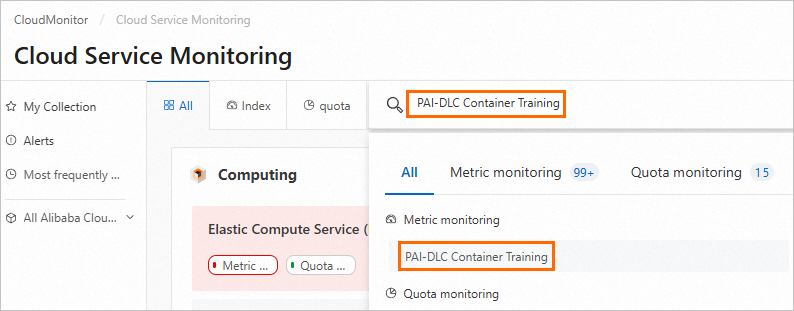
On the Cloud Service Monitoring page, search for PAI-DLC Container Training to go to the PAI-DLC Container Training page.
On the PAI-DLC Container Training page, select the region where the service is deployed from the drop-down list and click Create Alert Rule.
In the Create Alert Rule panel, configure the parameters and click Confirm. The following table describes the parameters.
Parameter
Description
Product
The name of the service monitored by CloudMonitor. Select PAI-DLC Container Training.
Resource Range
The range of the resources to which the alert rule applies. Valid values: All Resources and Instances.
All Resources: The alert rule applies to all resources of DLC.
Instances: You need to add workspaces to the Associated Resources section based on the product that you select. An alert notification is sent only when a DLC job in an added workspace meets the alert rule.
Rule Description
The conditions that trigger an alert. If monitoring data meets specified conditions, an alert is triggered. For information about how to configure this parameter, see Create an alert rule.
Mute For
The interval at which CloudMonitor resends alert notifications before an alert is cleared.
Effective Period
The period of time during which the alert rule is effective. CloudMonitor sends alert notifications based on the alert rule only within the specified period.
Tag
The tags that you want to add to the alert rule. A tag consists of a key and a value.
Alert Contact Group
The alert contact groups to which alert notifications are sent. Select alert contact groups that contain alert contacts.
On the PAI-DLC Container Training page, click View Alert Rules to view the details and alert history of the alert rule or modify the alert rule.
You can call API operations to configure the monitoring and alerting feature, such as viewing the alert history, managing alert templates, creating alert rules, and configuring alert contacts. For more information about the calling methods and details, see Alert service.
Subscribe to metrics
CloudMonitor provides comprehensive API services. You can subscribe to DLC monitoring metrics and data by calling API operations to build your monitoring system and dashboard. For more information about the API operations, see List of operations by function.
API operation | Description |
Queries the latest monitoring data of a metric. | |
Queries the monitoring data of a metric for a cloud service. | |
Queries the monitoring data of a metric for a cloud service. | |
Queries the details of metrics that are supported in CloudMonitor. | |
Queries the information about monitored services in CloudMonitor. | |
Queries the latest monitoring data of a metric for a cloud service. The data can be sorted in a specified order. |
The following descriptions provide an example on how to call the DescribeMetricList operation to query the monitoring data of a metric in DLC.
Go to the PAI-DLC Container Training page.
On the PAI-DLC Container Training page, find the desired metric and click Obtain Metric Data in the Actions column.

On the OpenAPI Portal page, configure parameters listed in the following table and retain the default settings for other parameters. For more information, see DescribeMetricList.
Parameter
Description
Namespace
The namespace of the cloud service. Set this parameter to acs_pai_dlc.
MetricName
The name of the metric that you want to query. Example: CARD_GPU_DRAM_ACTIVE_UTIL.
StartTime
The beginning of the time range to query. Example: 2024-05-15 00:00:00.
EndTime
The end of the time range to query. Example: 2024-05-28 00:00:00.
NoteThe interval between the values of the StartTime and EndTime parameters must be less than or equal to 31 days.
After you configure the parameters, click Initiate Call to view the monitoring data within the specified time range.
Use ARMS
Application Real-Time Monitoring Service (ARMS) is a cloud-native observability platform. Based on the capabilities of ARMS, you can build custom Grafana dashboards for PAI-DLC or configure flexible Prometheus alerts. For more information, see What is ARMS?.
Billing
You are billed for using ARMS. For more information, see Managed Service for Prometheus instance billing.
Integrate monitoring data
Perform the following steps:
Log on to the Application Real-Time Monitoring Service (ARMS) console. In the left-side navigation pane, click Integration Center.
In the left-side navigation tree of the Integration Center page, click AI. In the AI section, click Aliyun PAI-DLC.

On the Start Integration tab of the Aliyun PAI-DLC panel, select the region in which the data is stored, specify an integration name, and then click OK.
The integration requires approximately 1 to 2 minutes. You can switch to the Preview tab to view the monitoring dashboard, the Collect Metrics tab to view the collected metrics, and the Alert Rule Template tab to view the name and template details of an alert rule.
After the integration is complete, click Integration Management to view information about the integration environment.
View the Grafana dashboards
Log on to the ARMS console.
In the left-side navigation pane, click Integration Management.
On the Integrated Environments tab of the Integration Management page, click Cloud Service Region.
On the Cloud Service Region tab, click the name of the environment instance that you want to manage.
In the Addon Type section of the Component Management tab, click Dashboards to view the built-in Grafana dashboards.
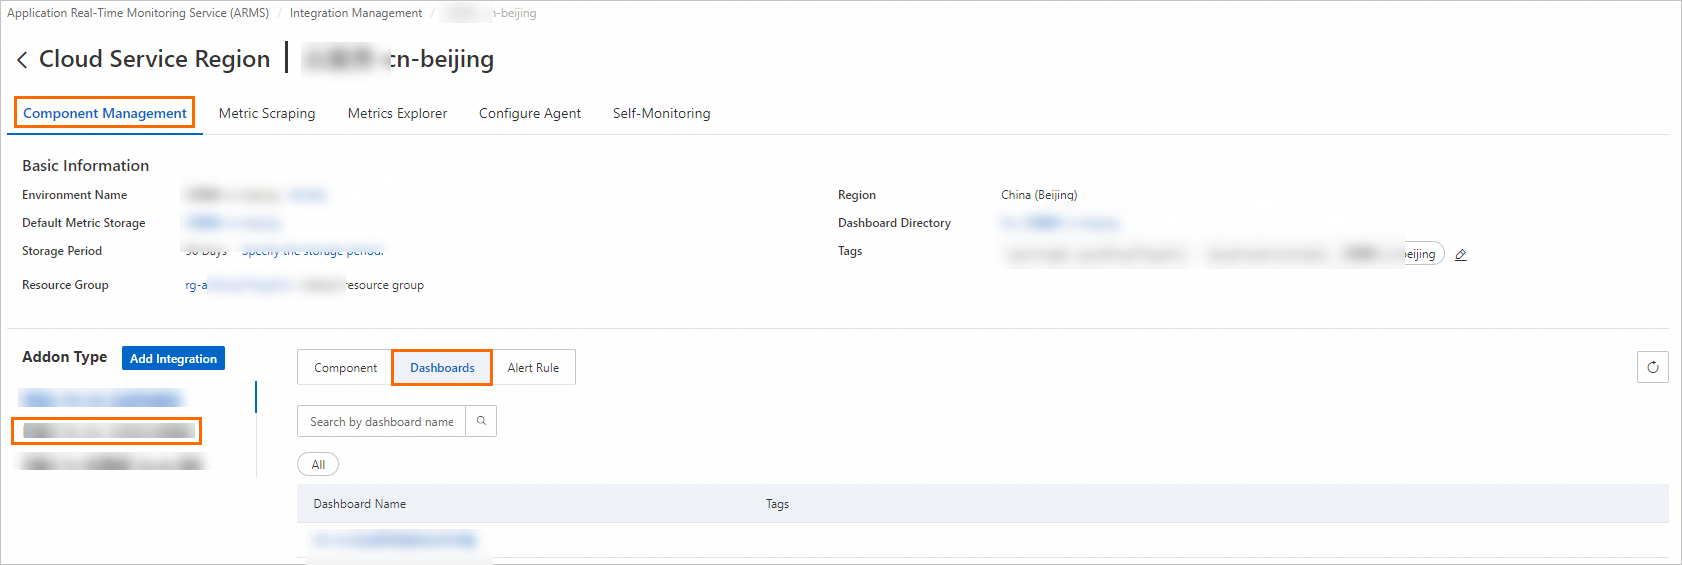
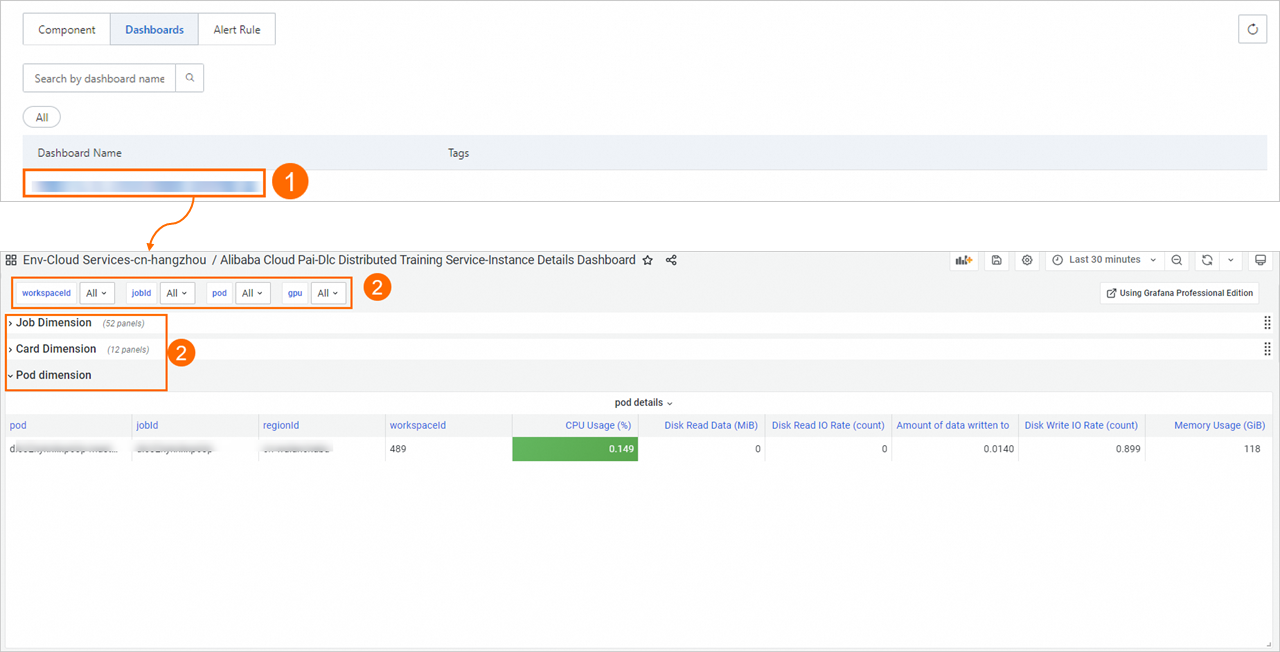
Click the dashboard name to view the monitoring dashboard.
Configure Prometheus alerts
Perform the following steps to configure Prometheus alerts:
Log on to the ARMS console.
In the left-side navigation pane, click Integration Management.
On the Integrated Environments tab of the Integration Management page, click Cloud Service Region.
On the Cloud Service Region tab, click the name of the environment instance that you want to manage.
In the Addon Type section of the Component Management tab, click Alert Rule to view the built-in alert rules.
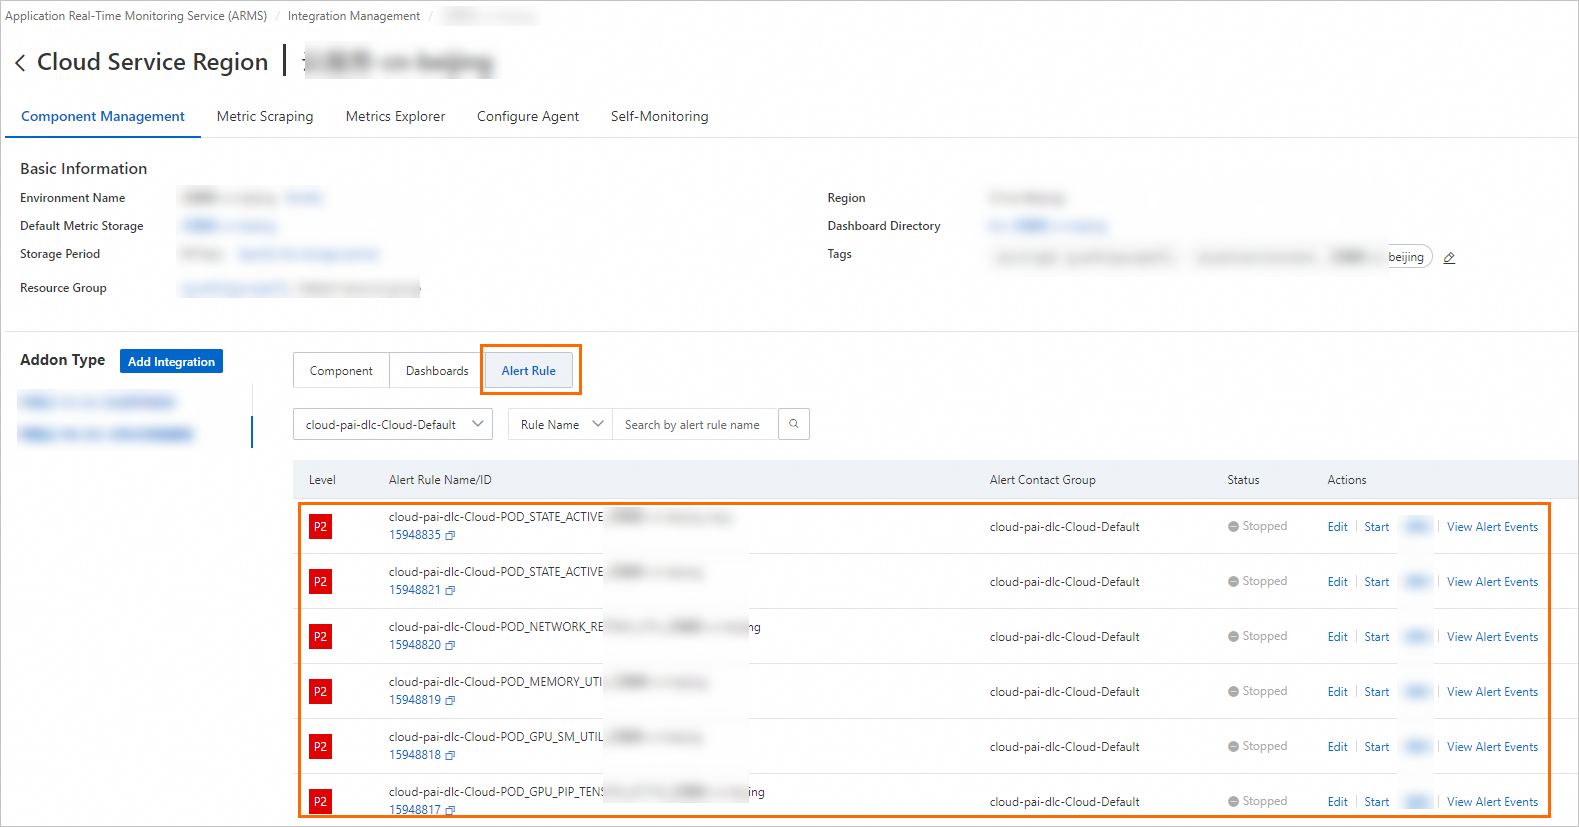
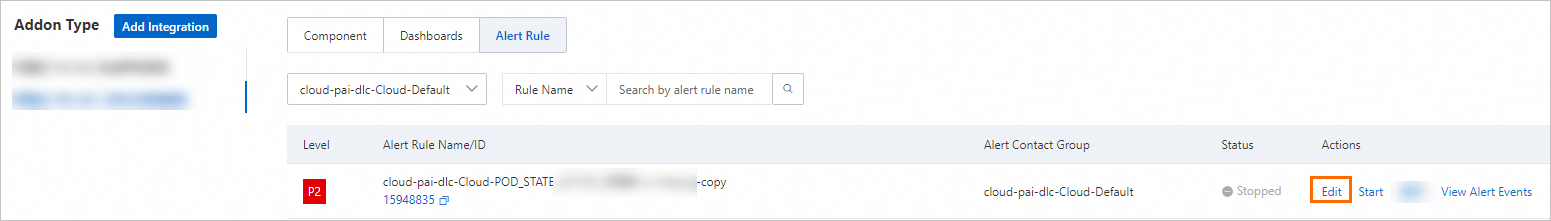
The built-in alert rules generate alert events without sending alert notifications. If you want to send alert notifications by email or other channels, find the desired alert rule and click Edit in the Actions column to modify the notification methods.
You can configure notification policies and specify matching rules for alert events. If a matching rule is triggered, the system sends alert notifications to contacts by using the specified notification methods. For more information, see Create and manage a notification policy.
You can modify the notification method of an alert rule.
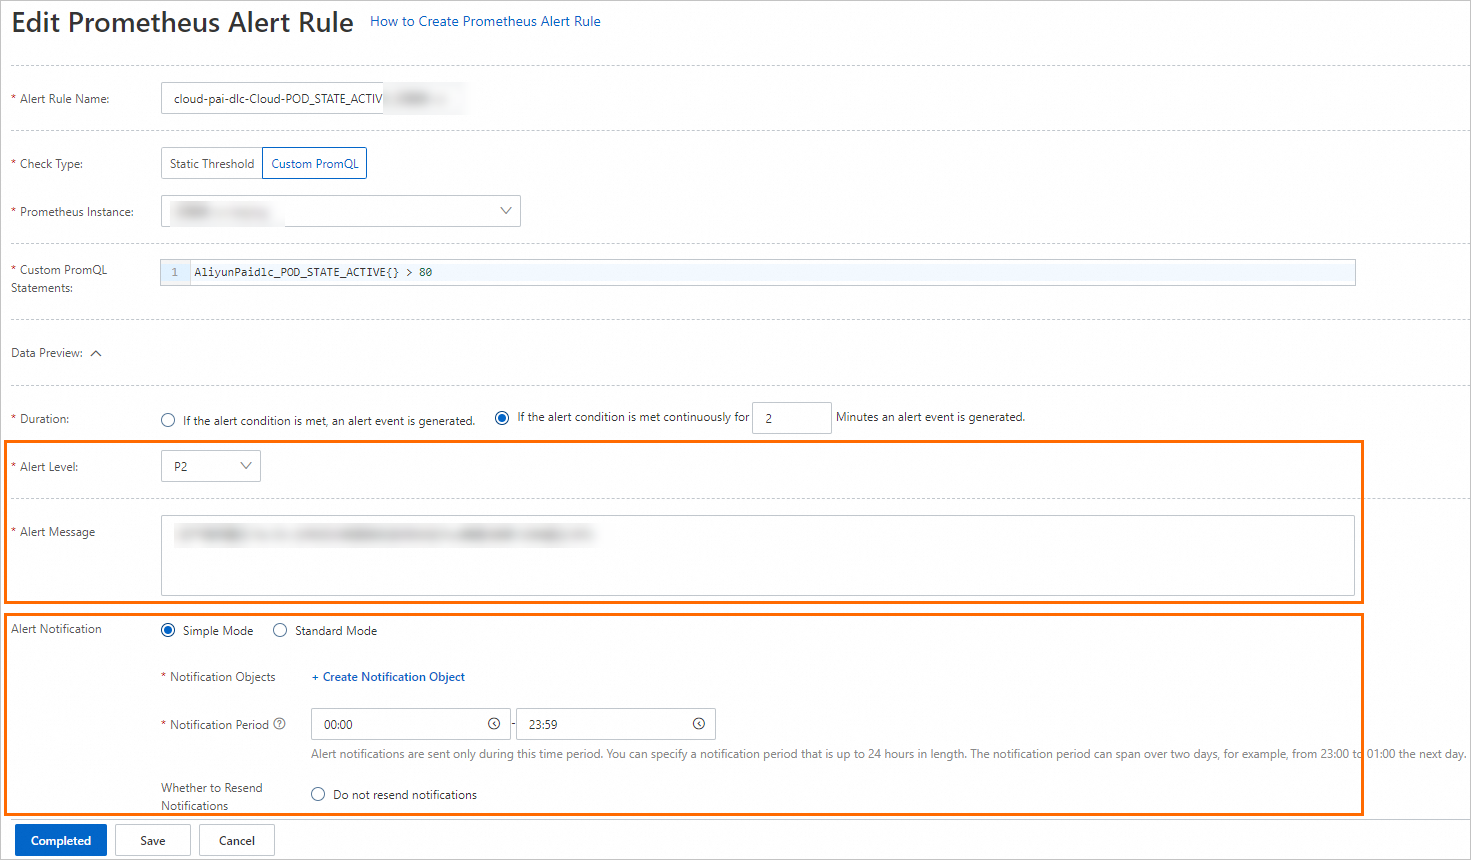
 On the Edit Prometheus Alert Rule page, you can configure the alert condition, duration, alert message, and alert notification. For more information, see Create an alert rule for a Prometheus instance.