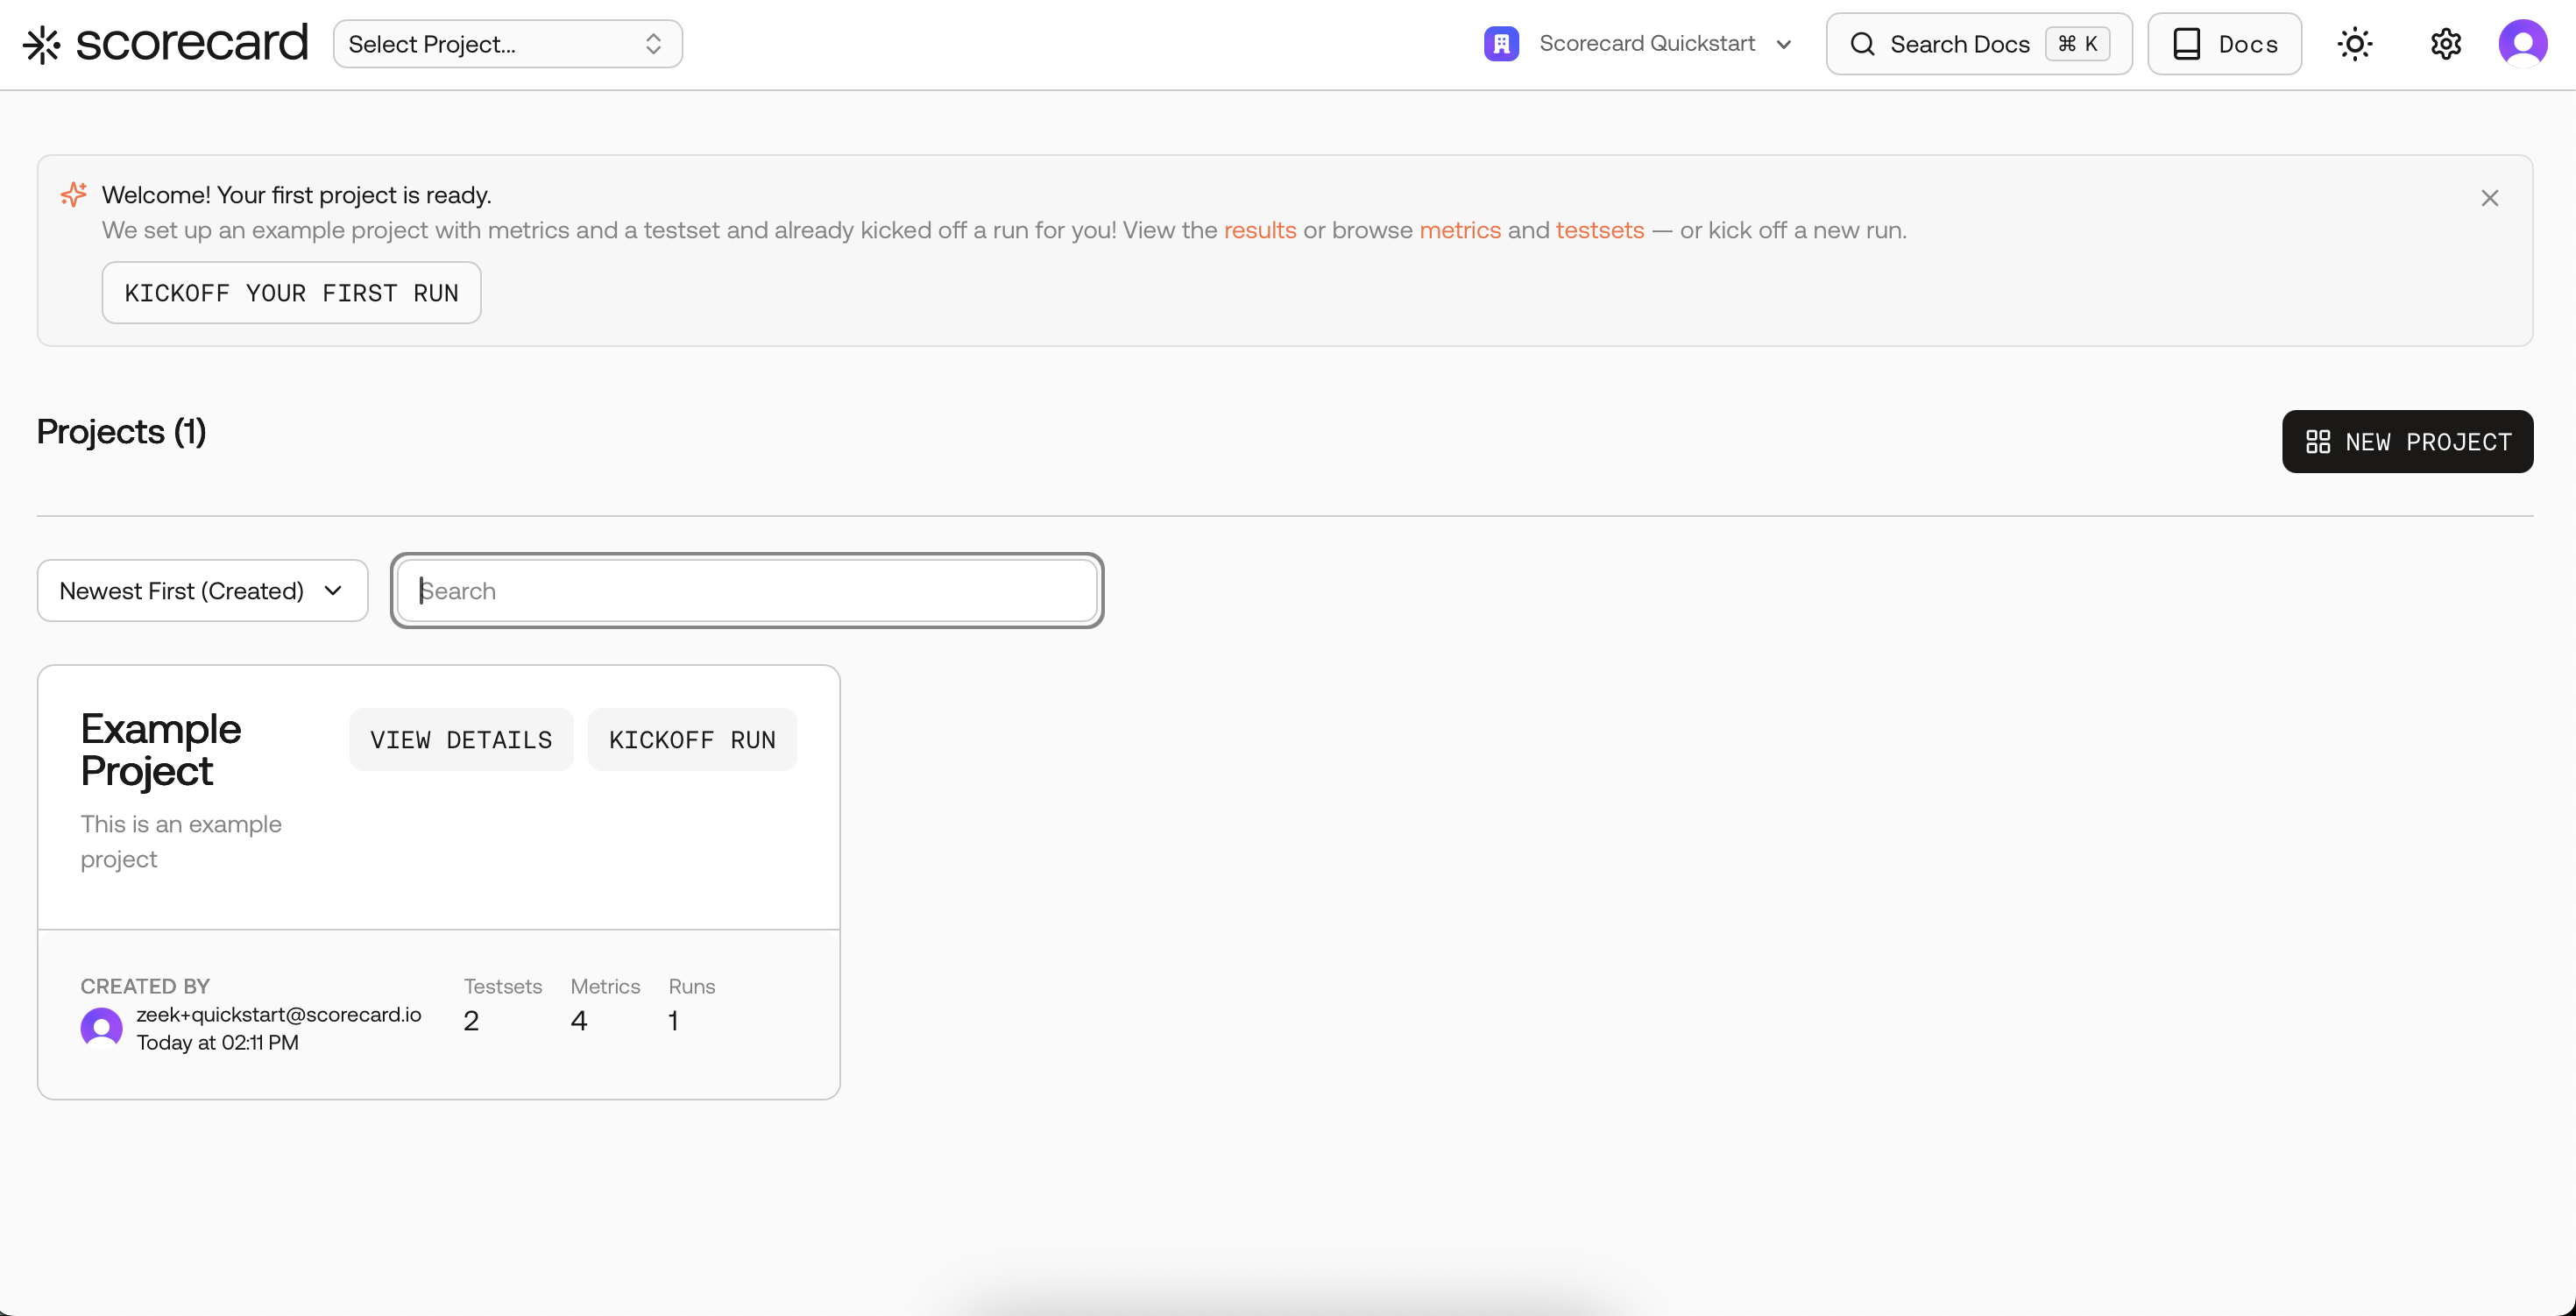
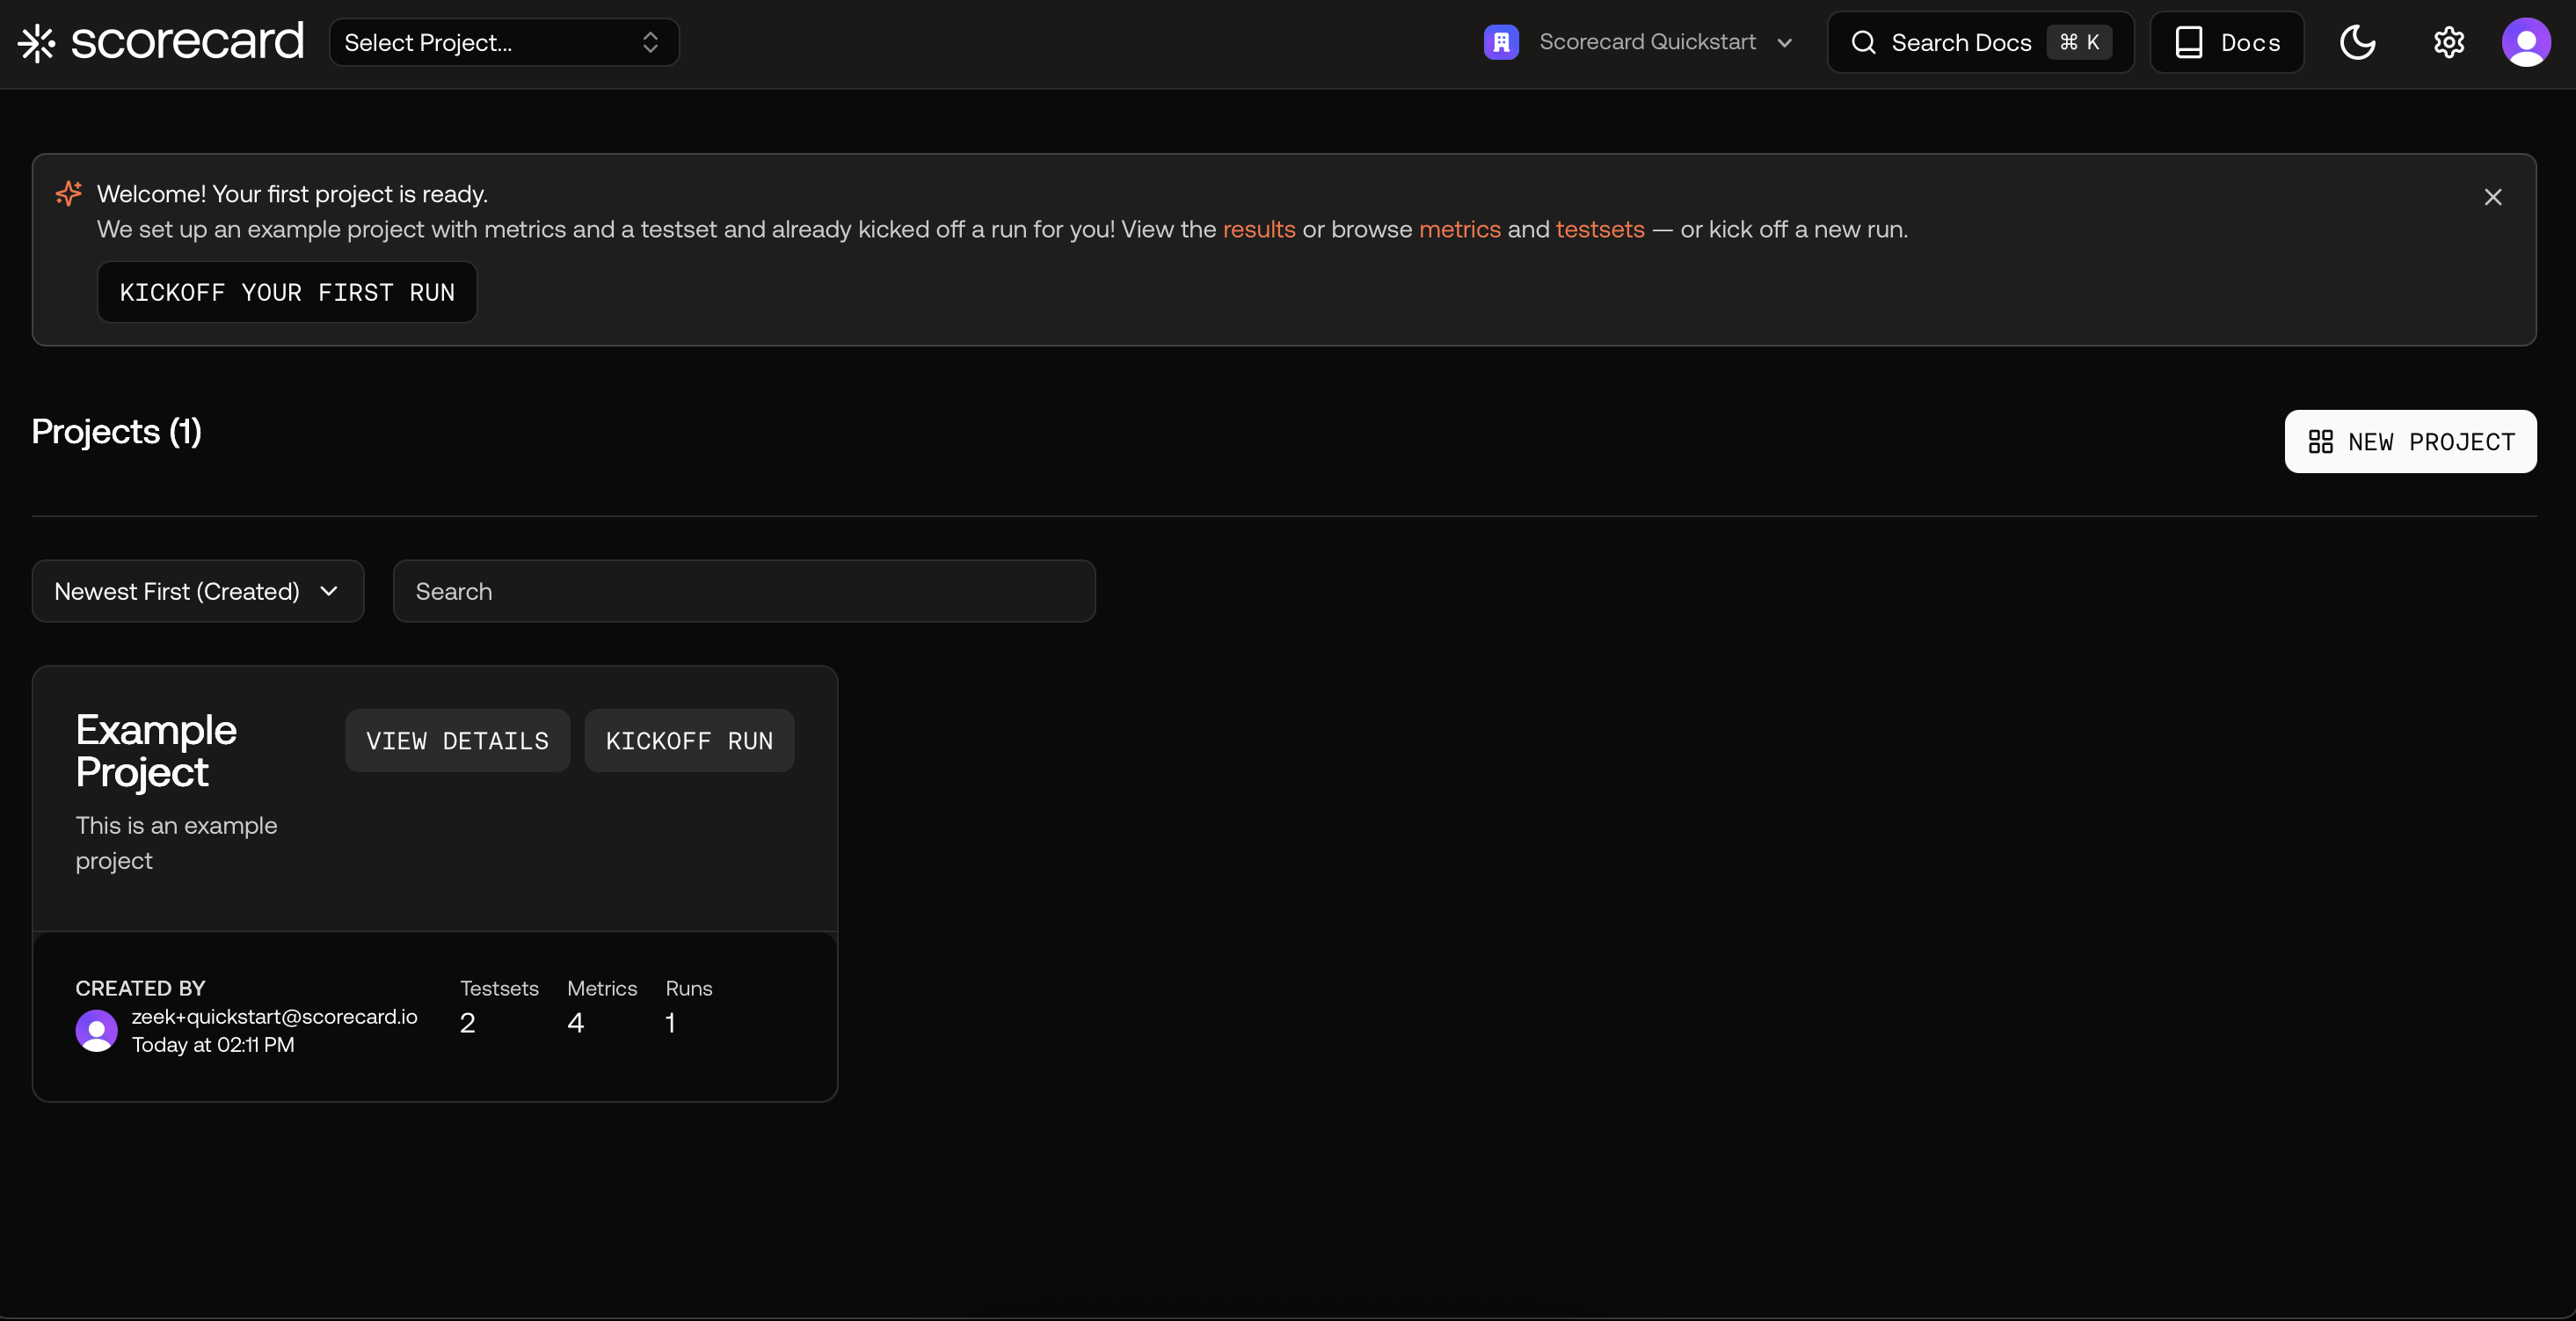
Projects overview with the Example Project and kickoff banner.
1
Find the Example Project and open Kickoff Run
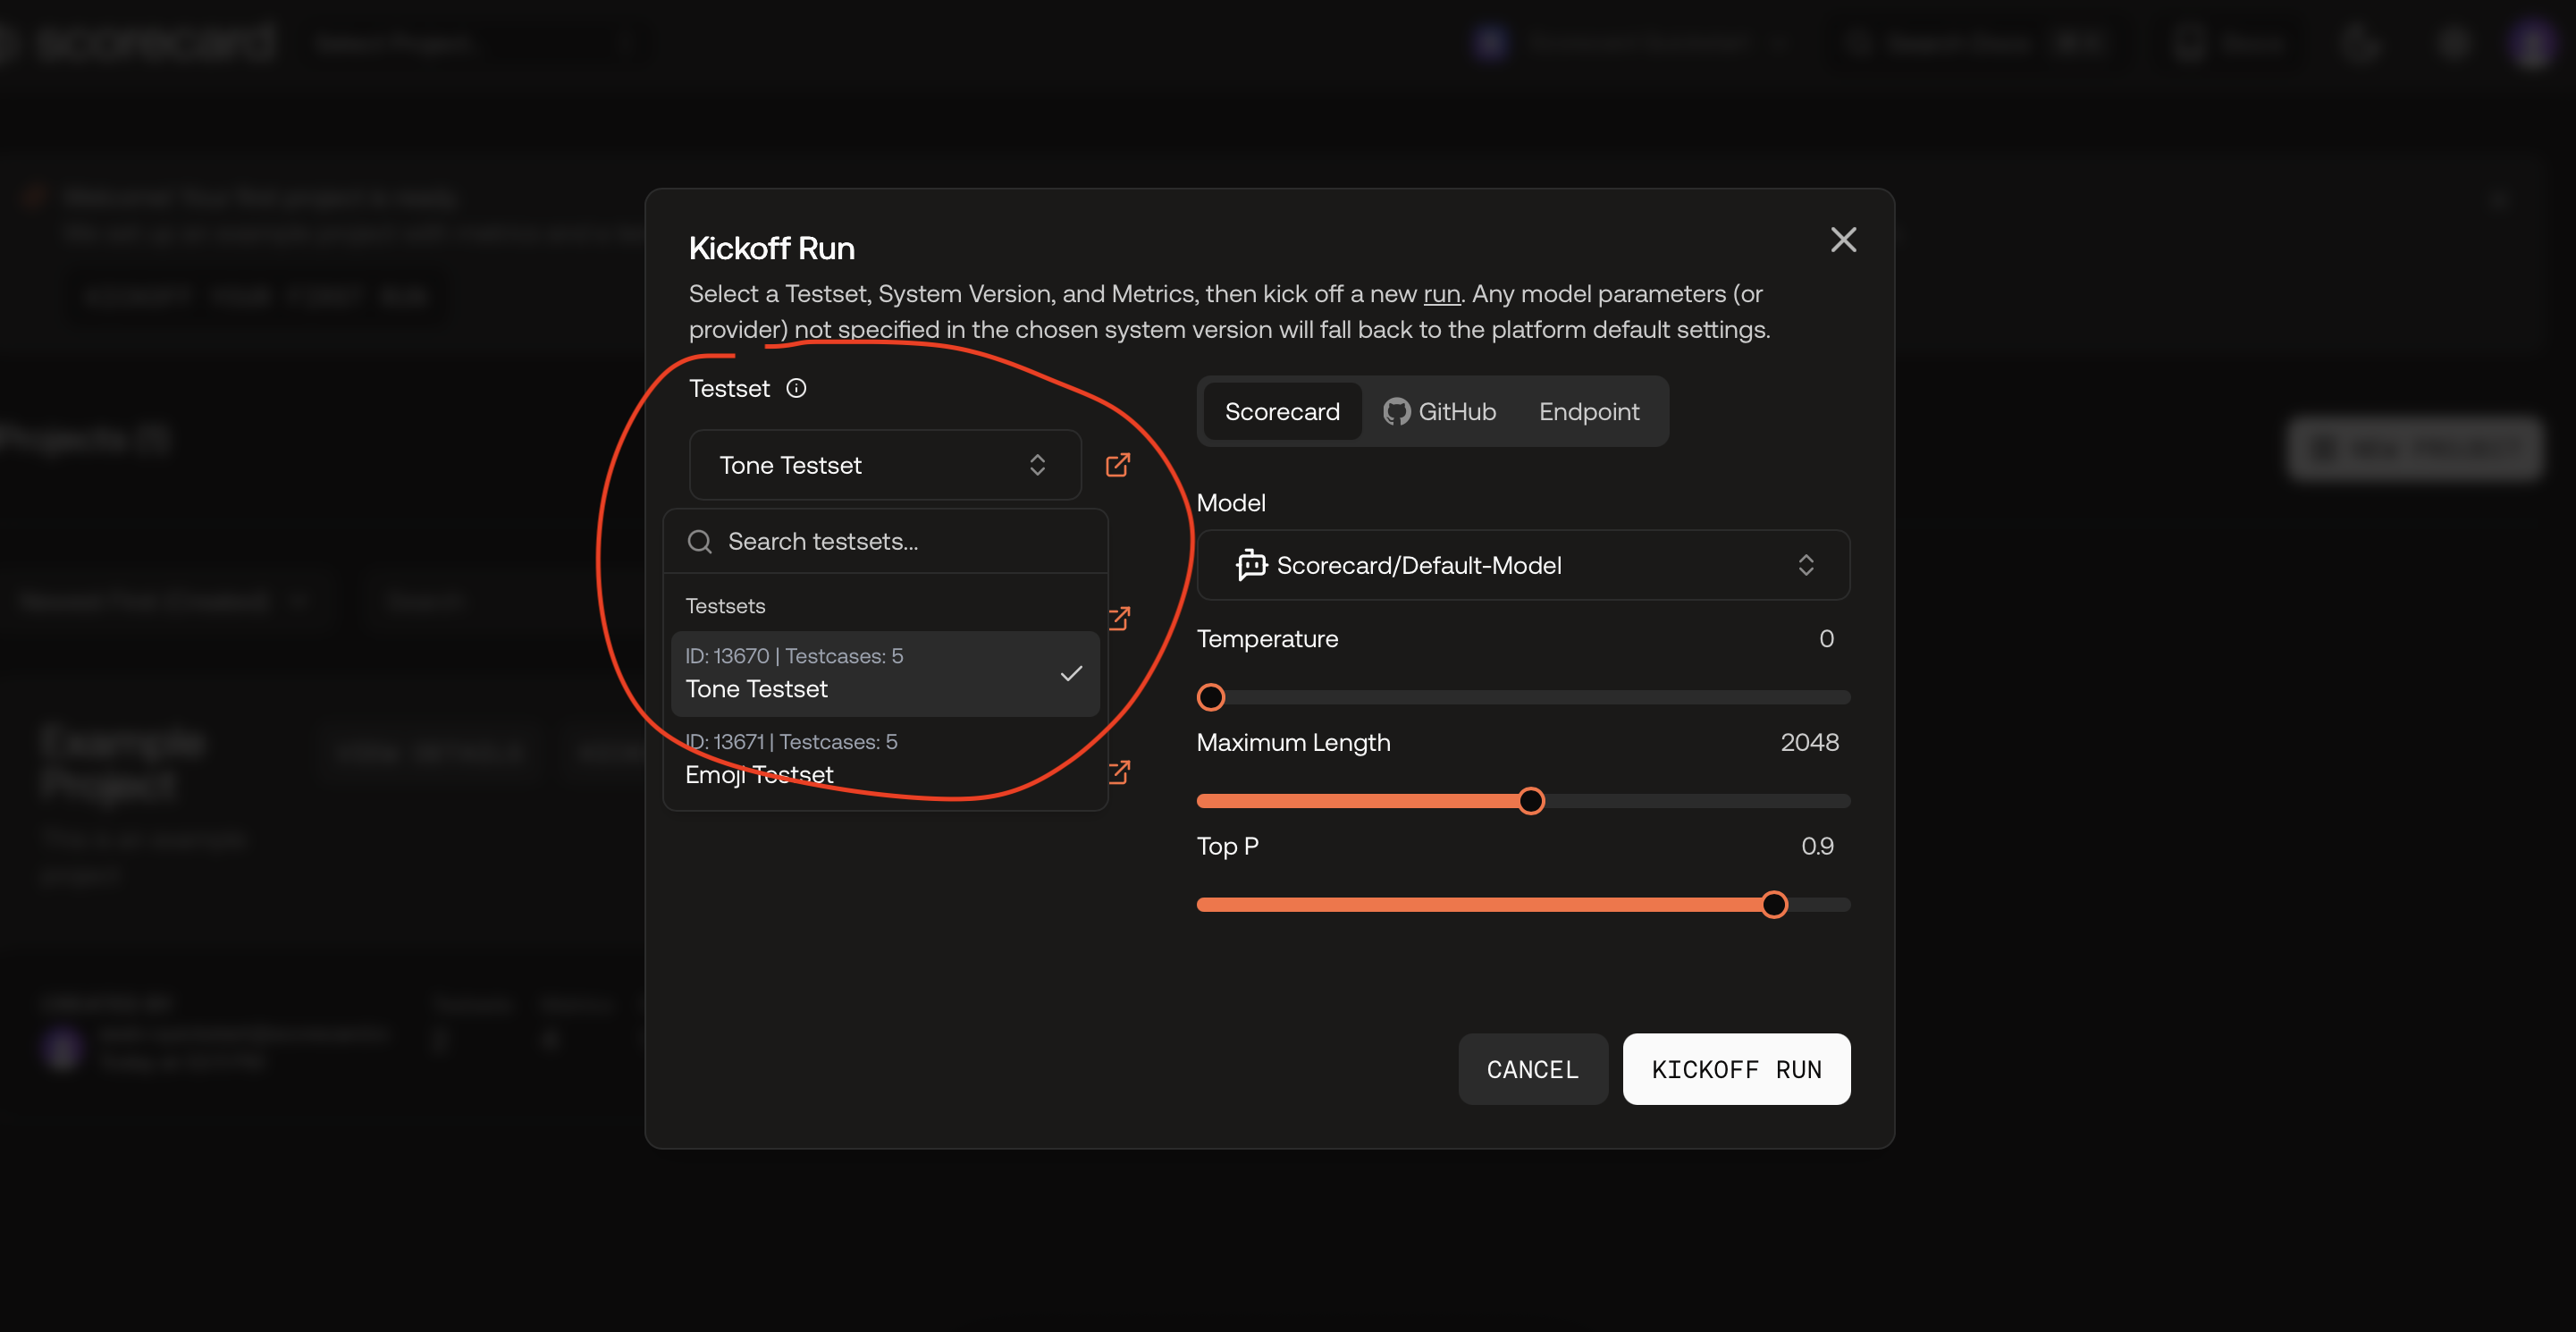
On the Projects overview page, you’ll see a banner welcoming you and a card for the Example Project. Click the banner’s button or the project card’s “Kickoff run” — this opens a pre‑filled Kickoff Run modal like the one below.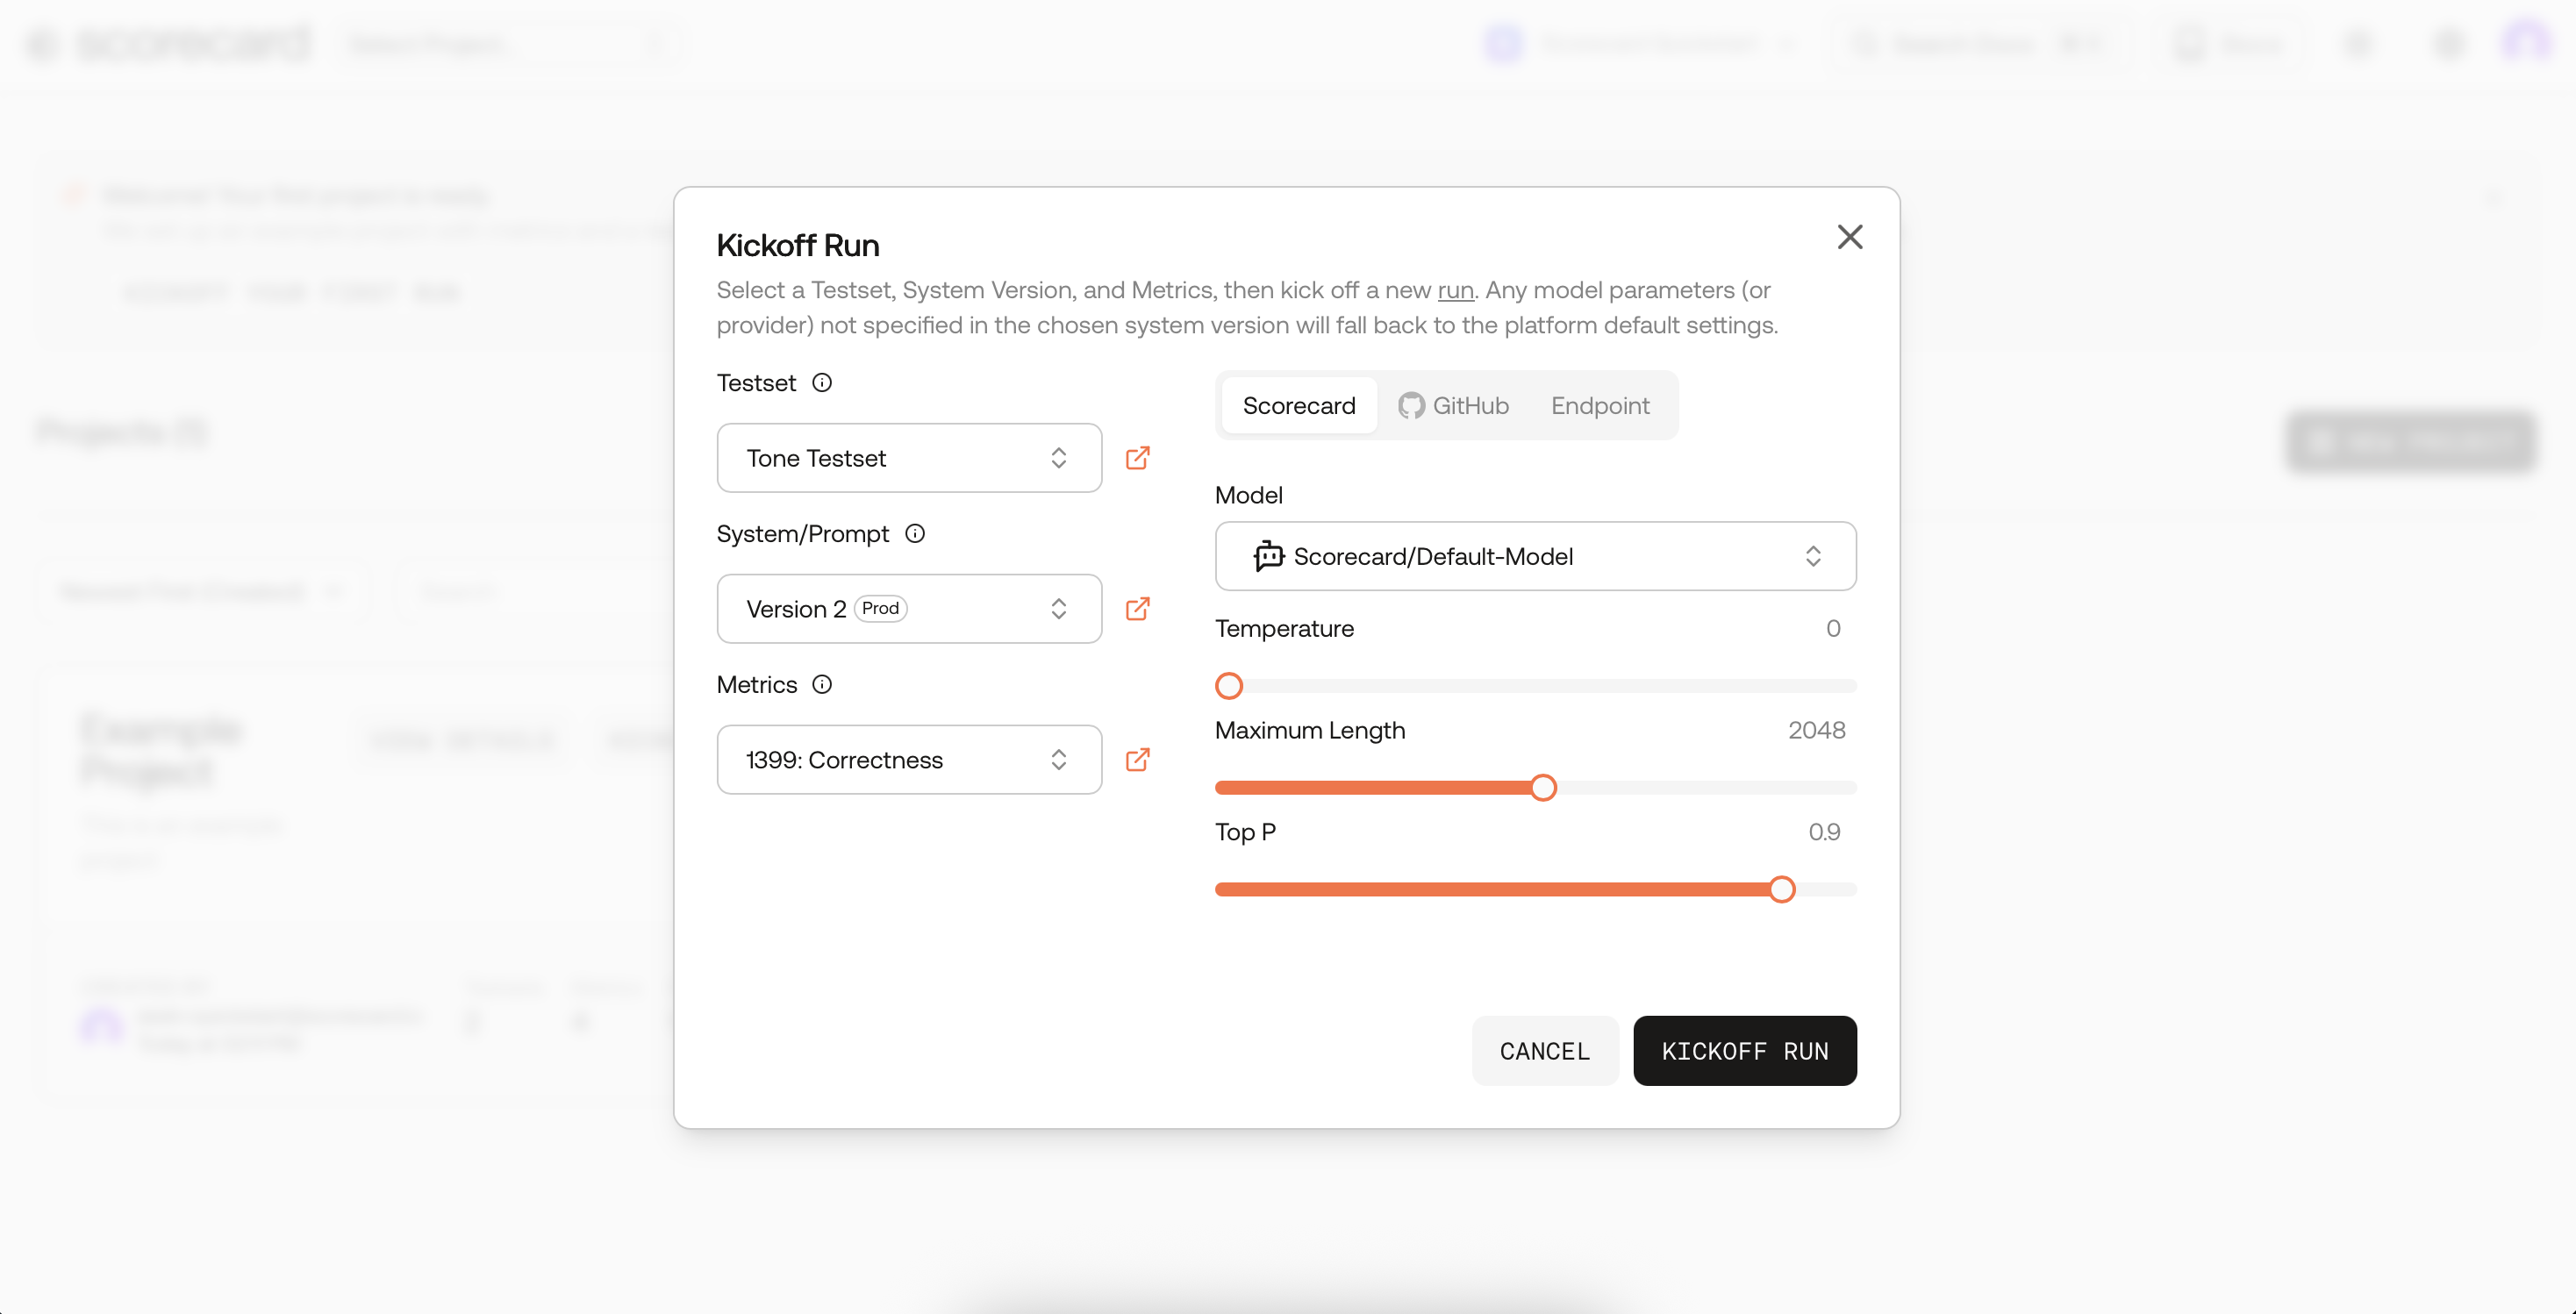
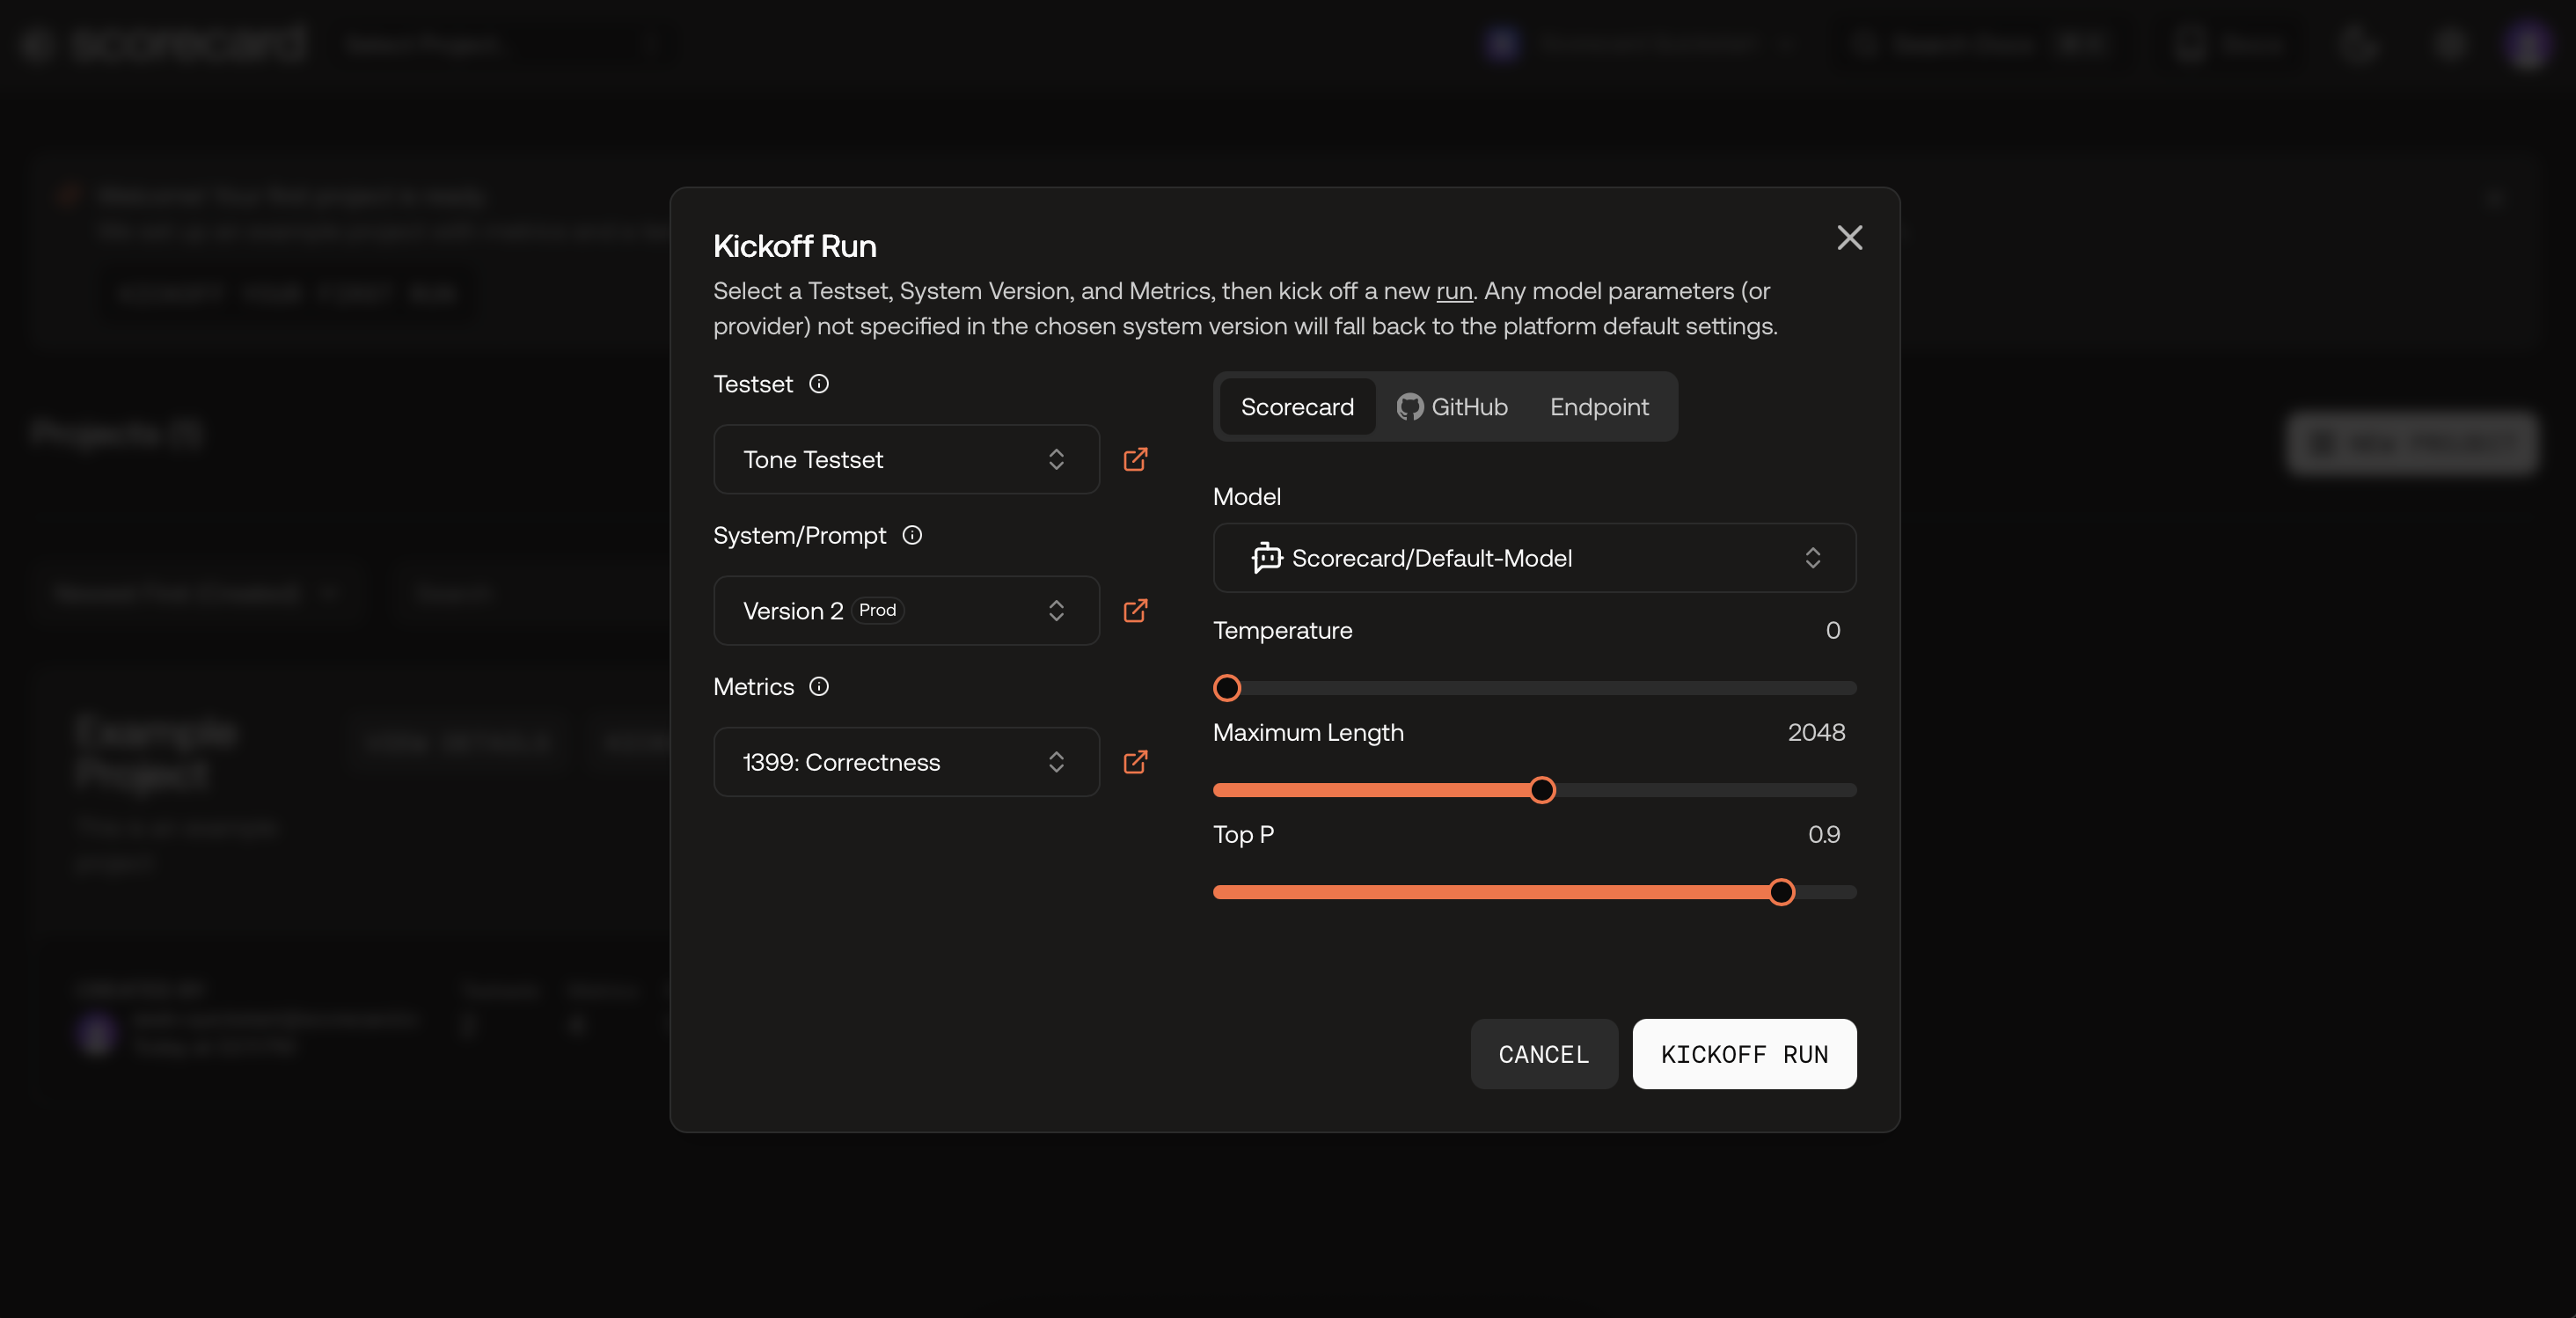
Kickoff Run modal pre‑filled with a Testset, Prompt, and Metrics.
2
Kick off your first run
The modal is pre‑filled with a Testset, Prompt, and Metrics using Scorecard Cloud. You can change selections or keep defaults.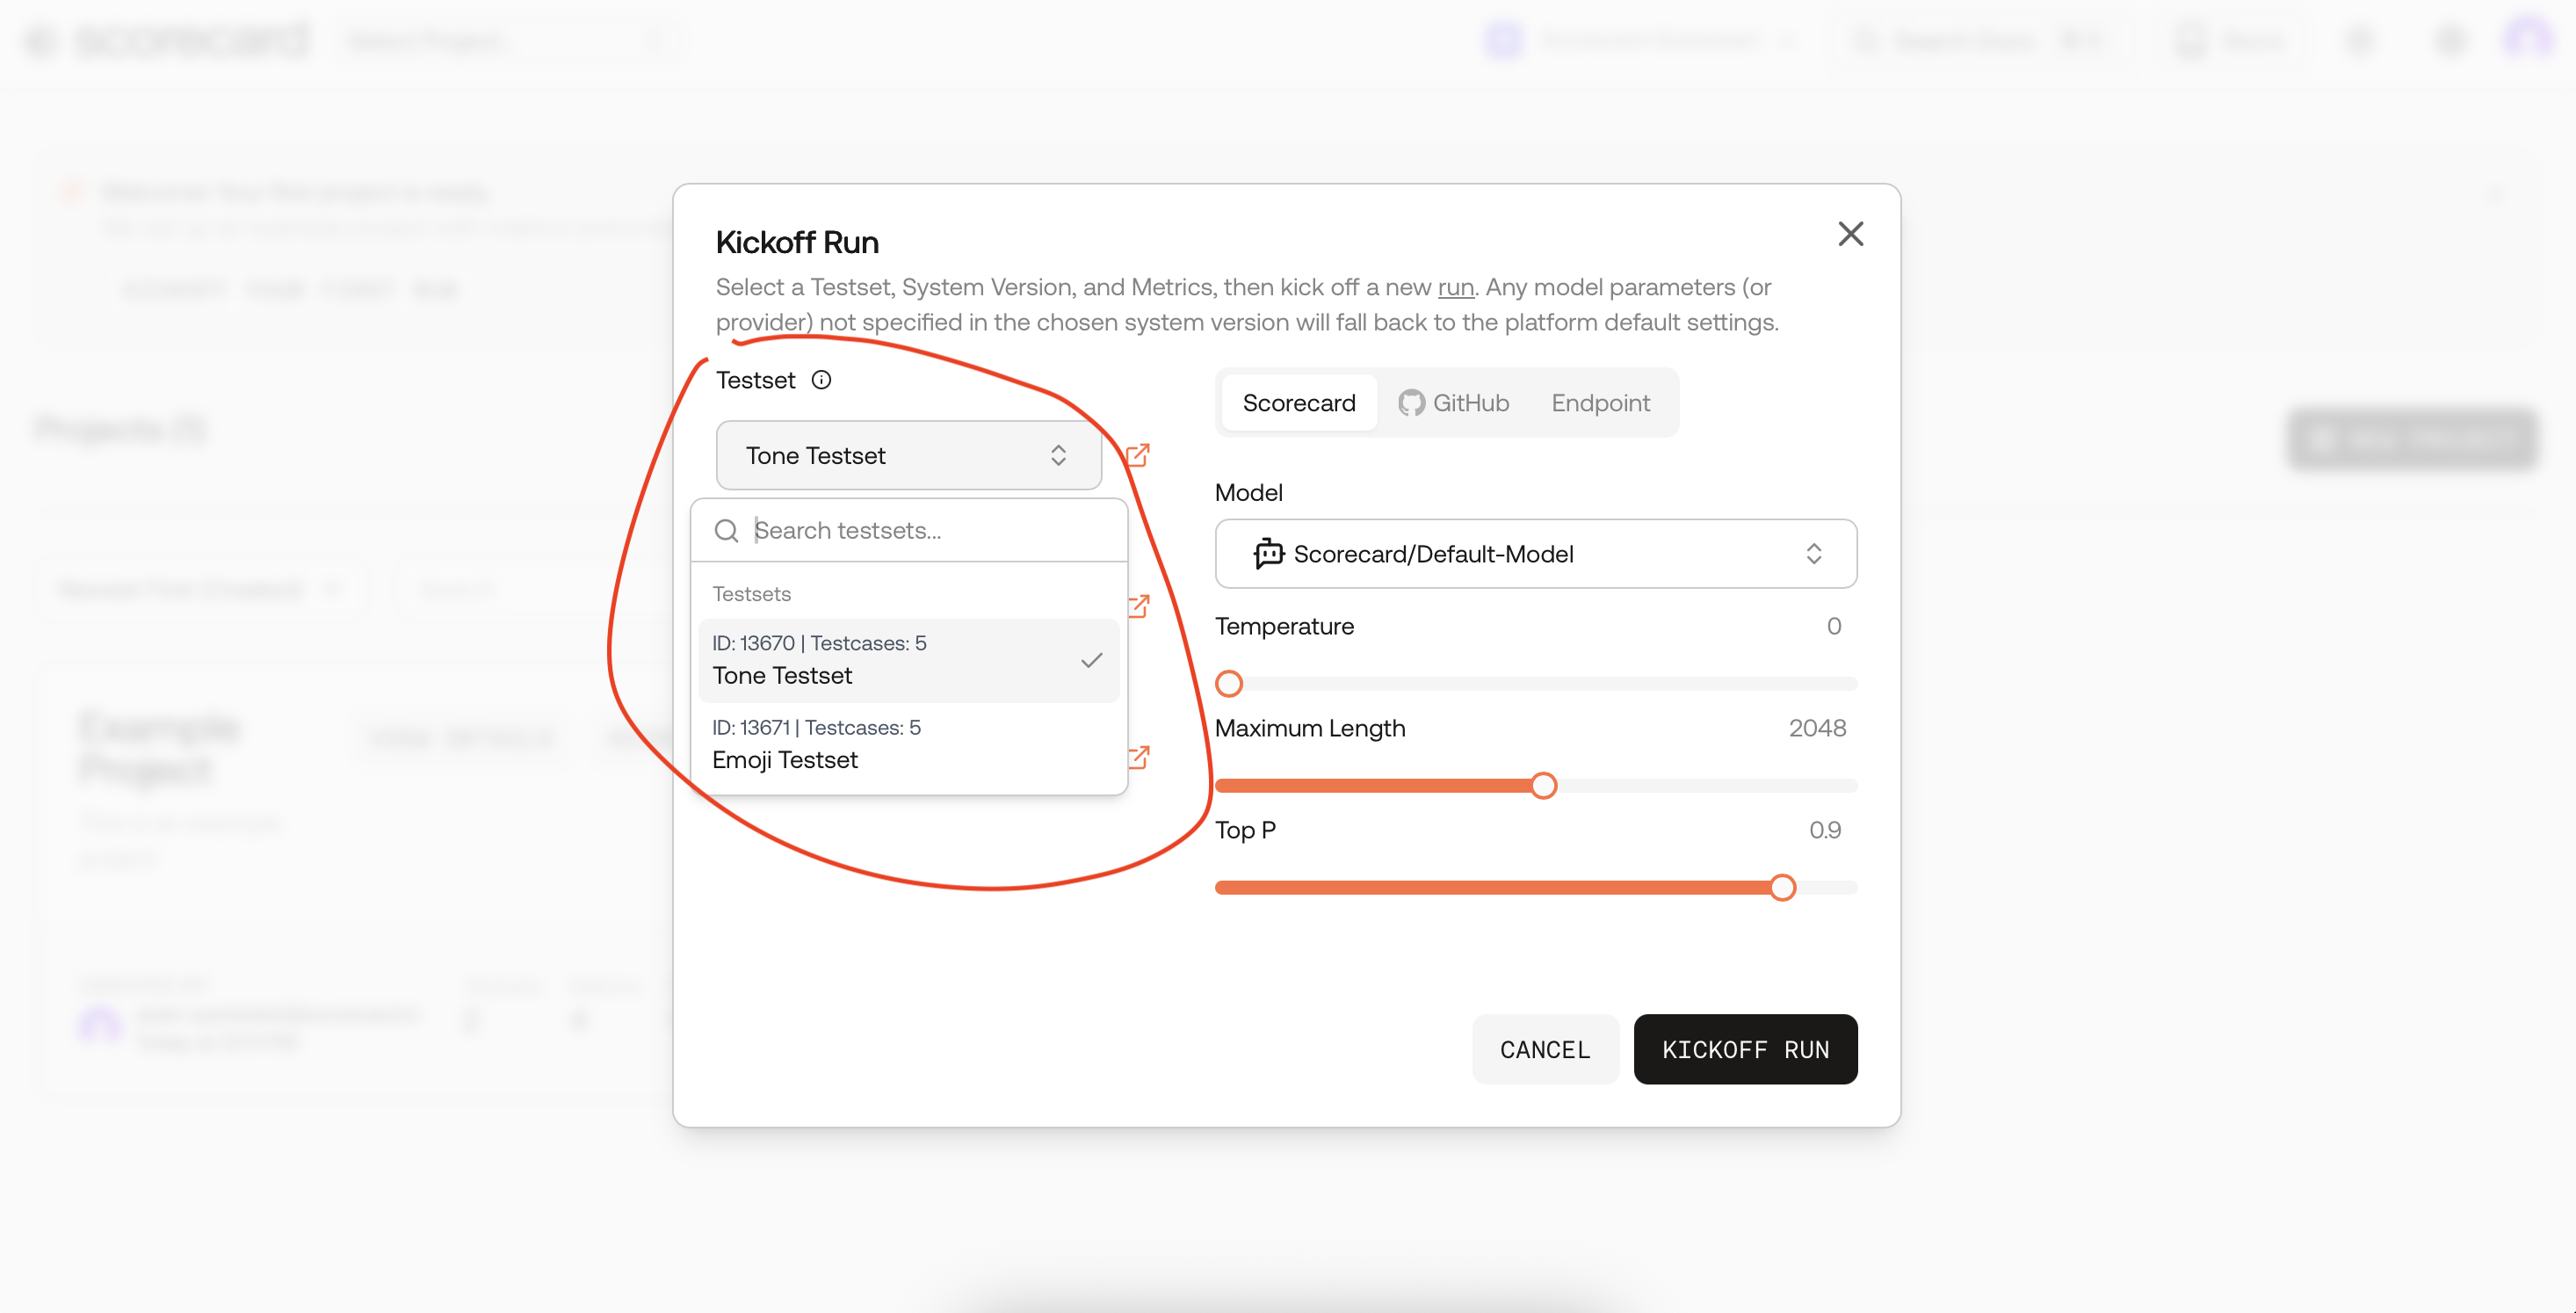
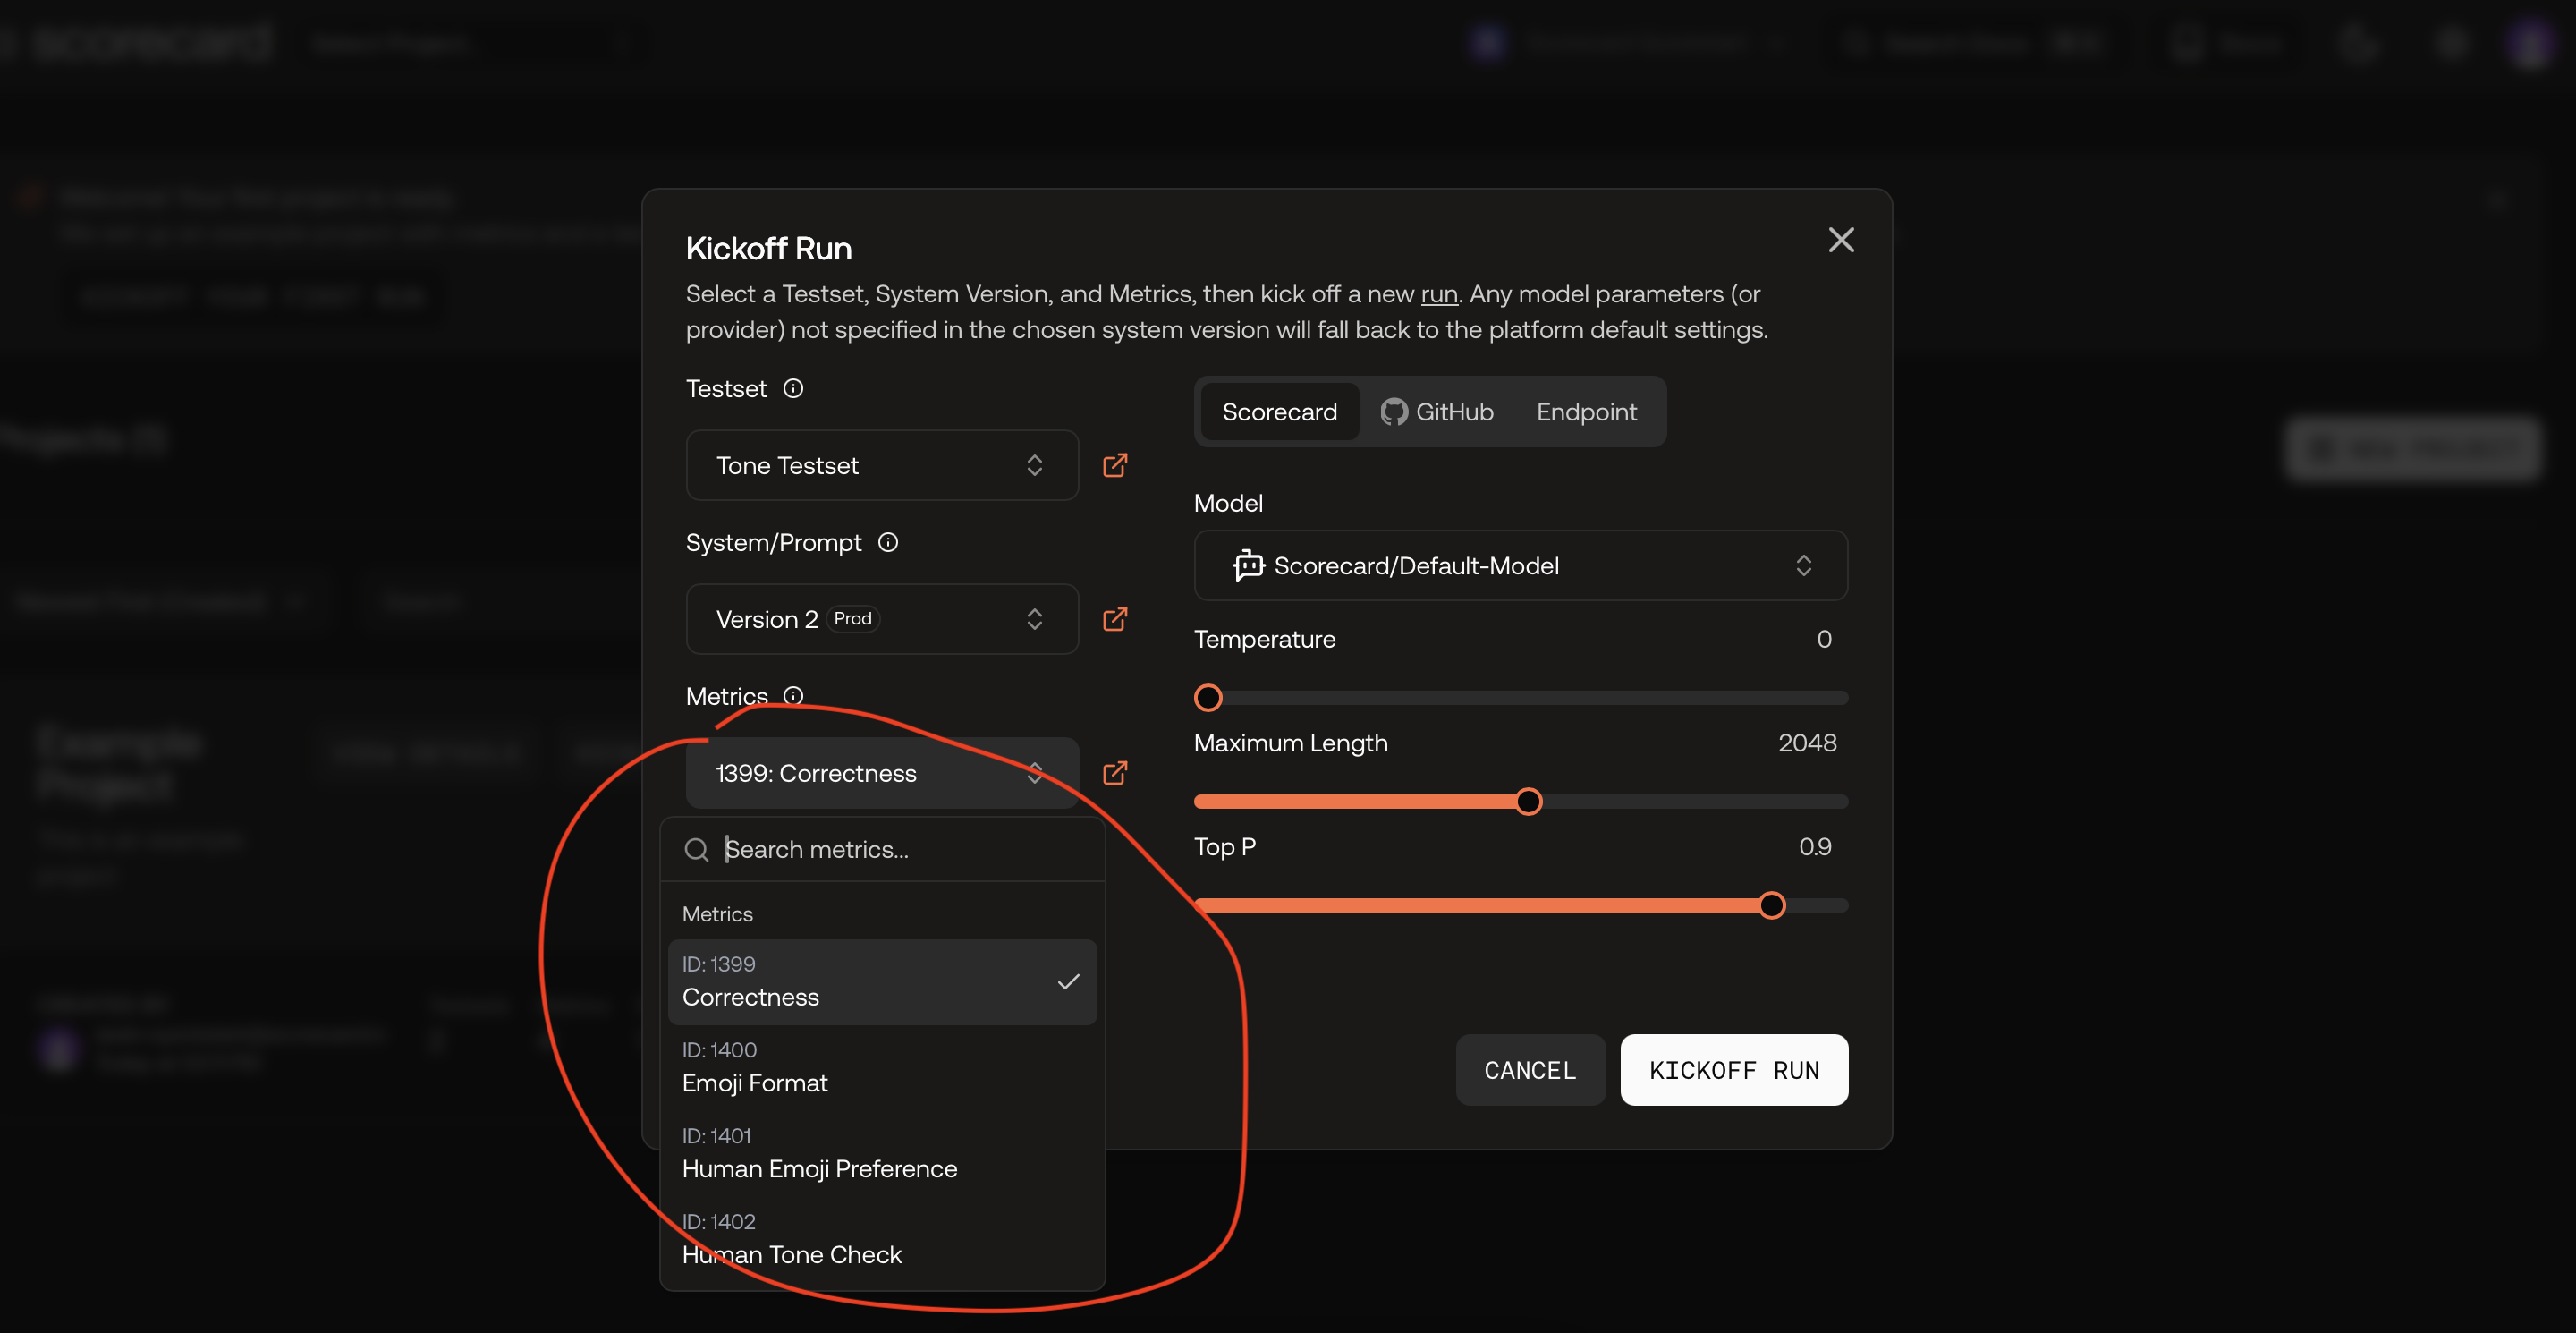
 Next, choose one or more Metrics, or pick a Metric Group for consistency.
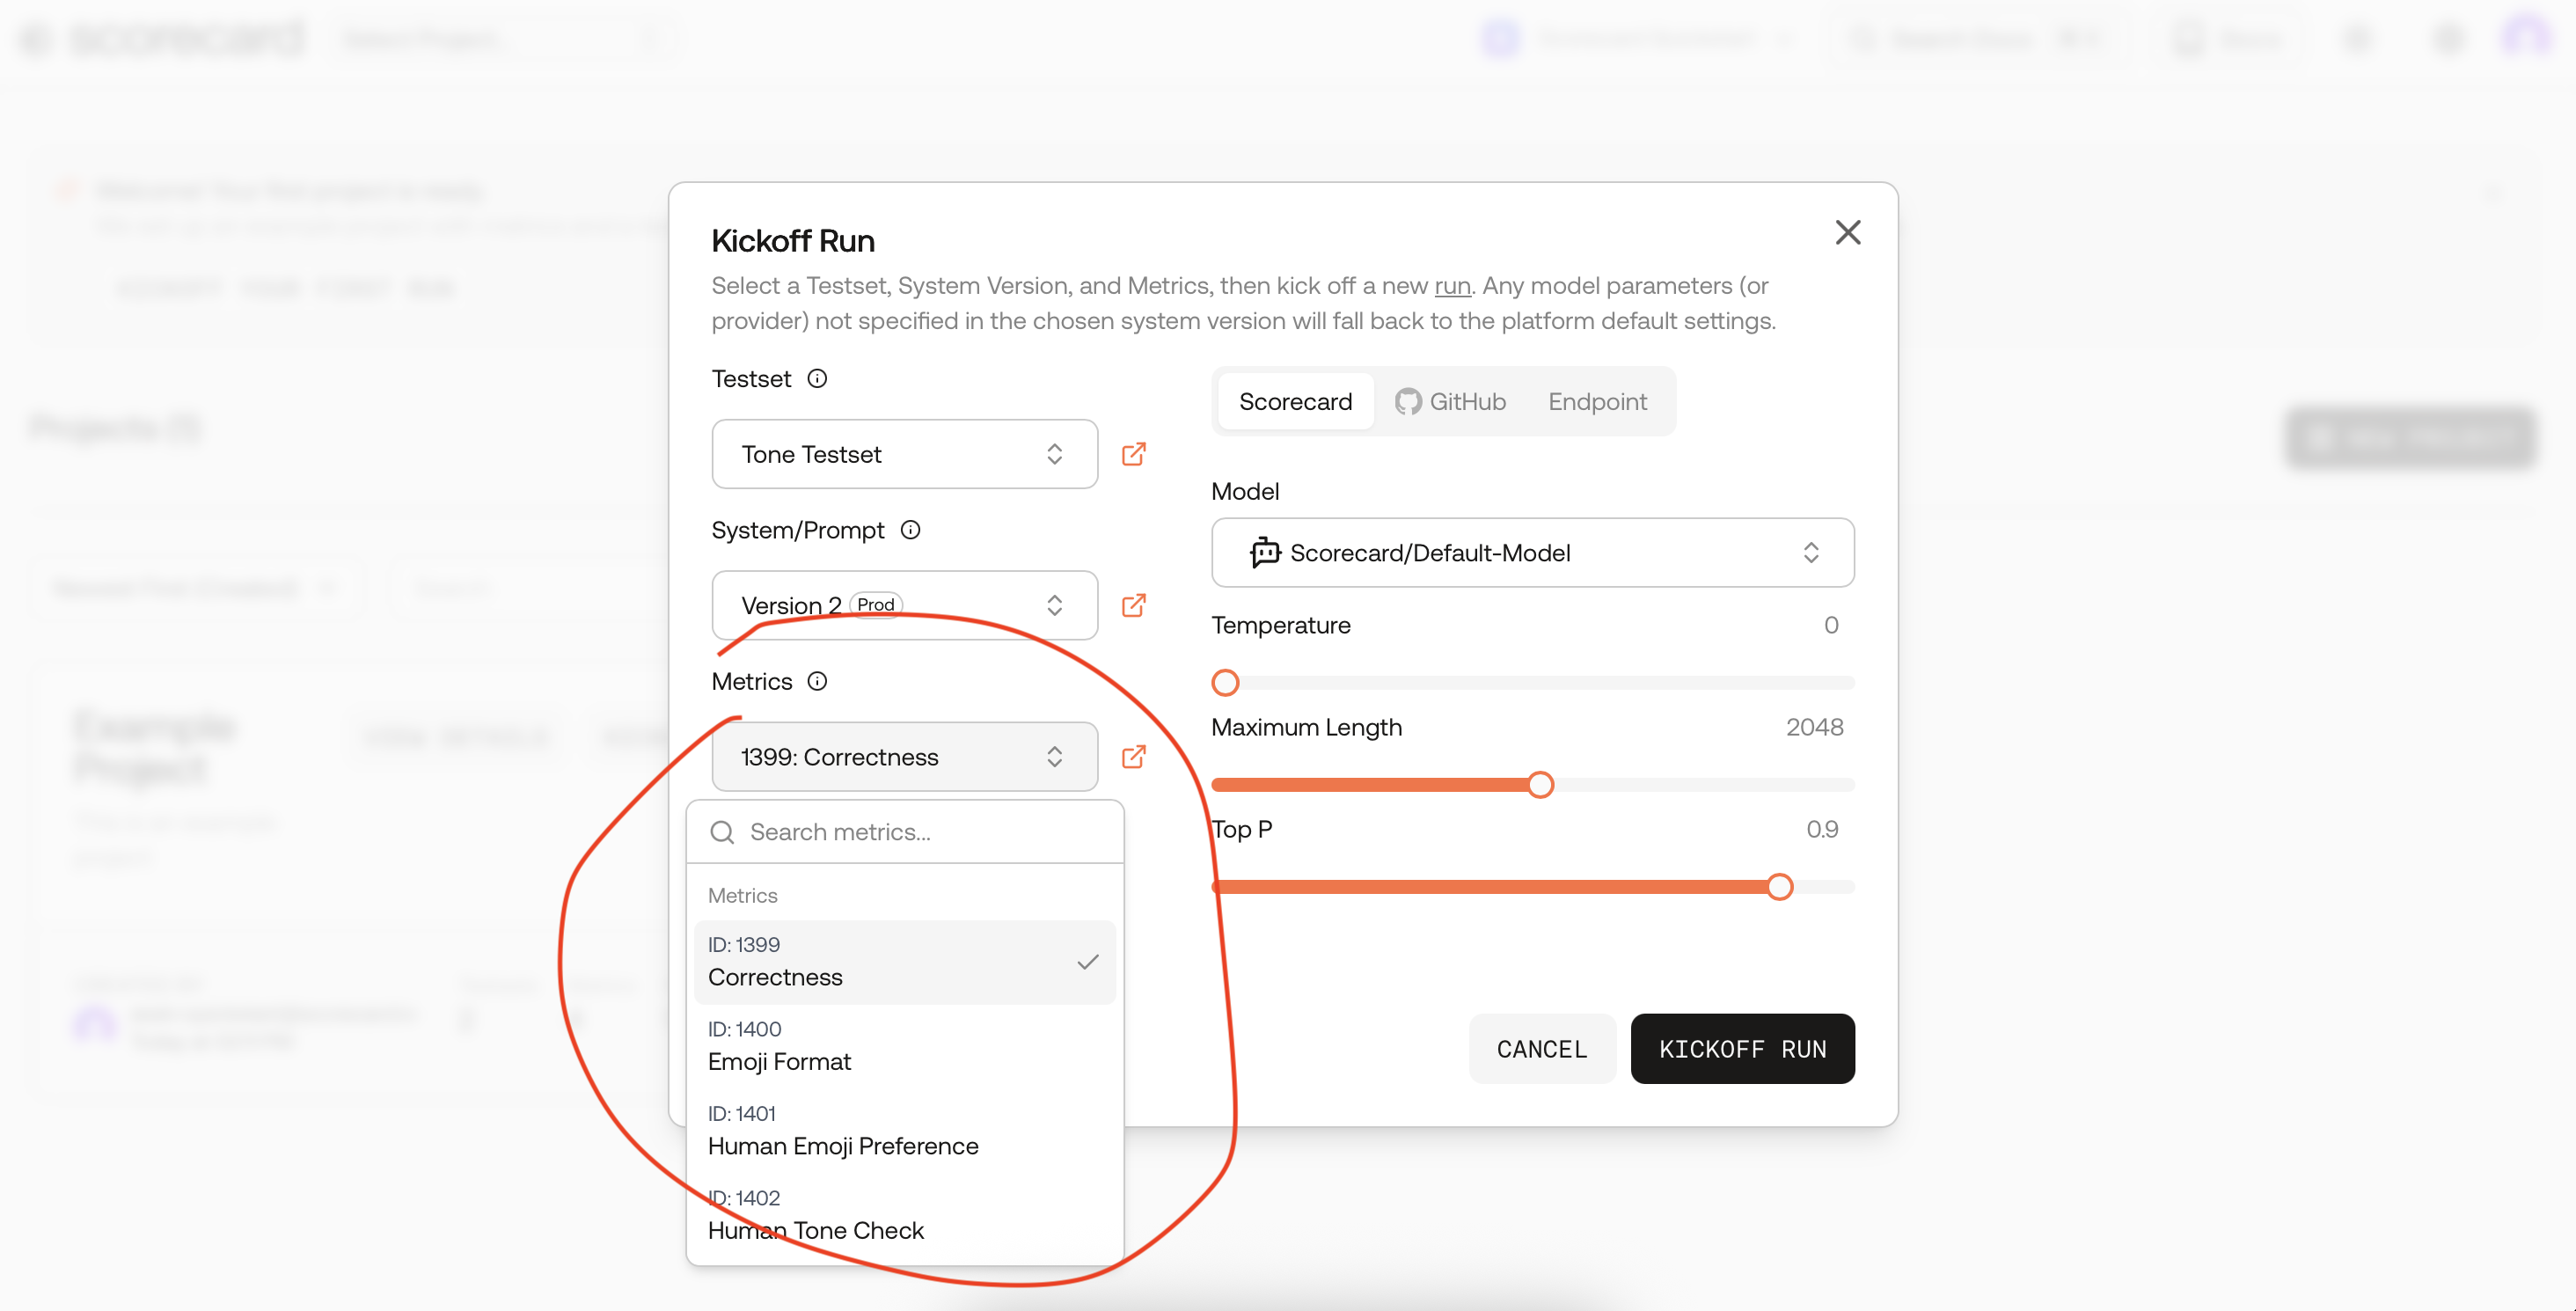
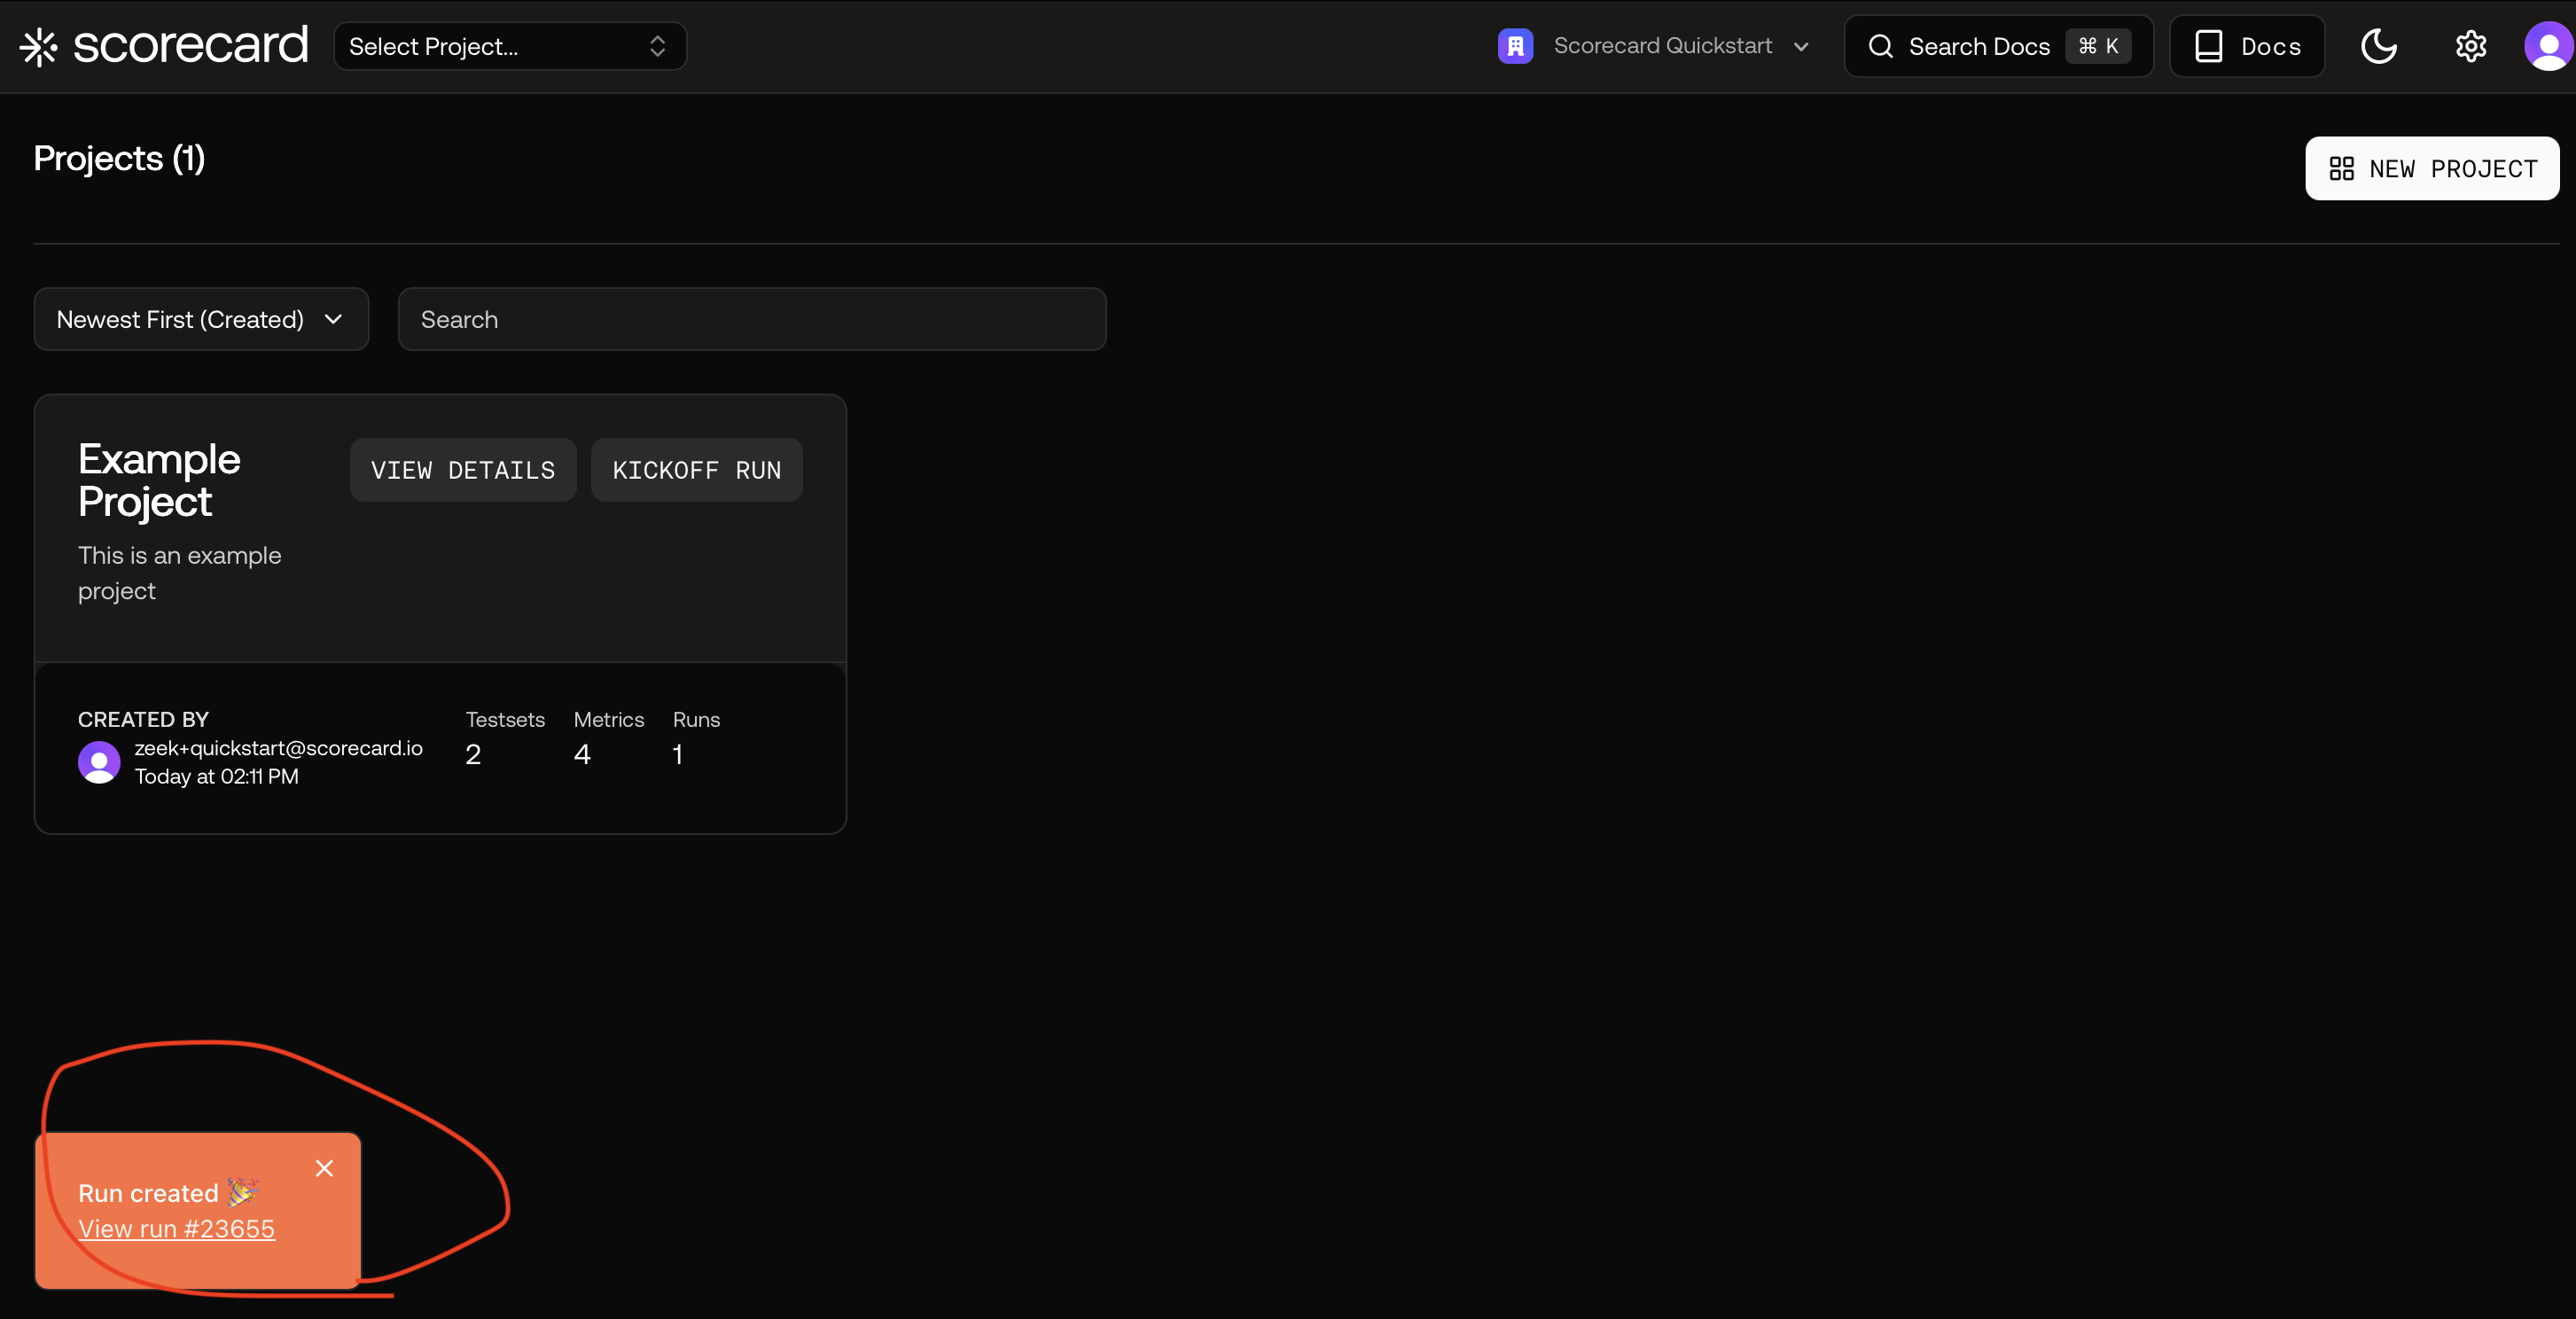
 Click “Kickoff run”. A toast confirms creation and links directly to results.
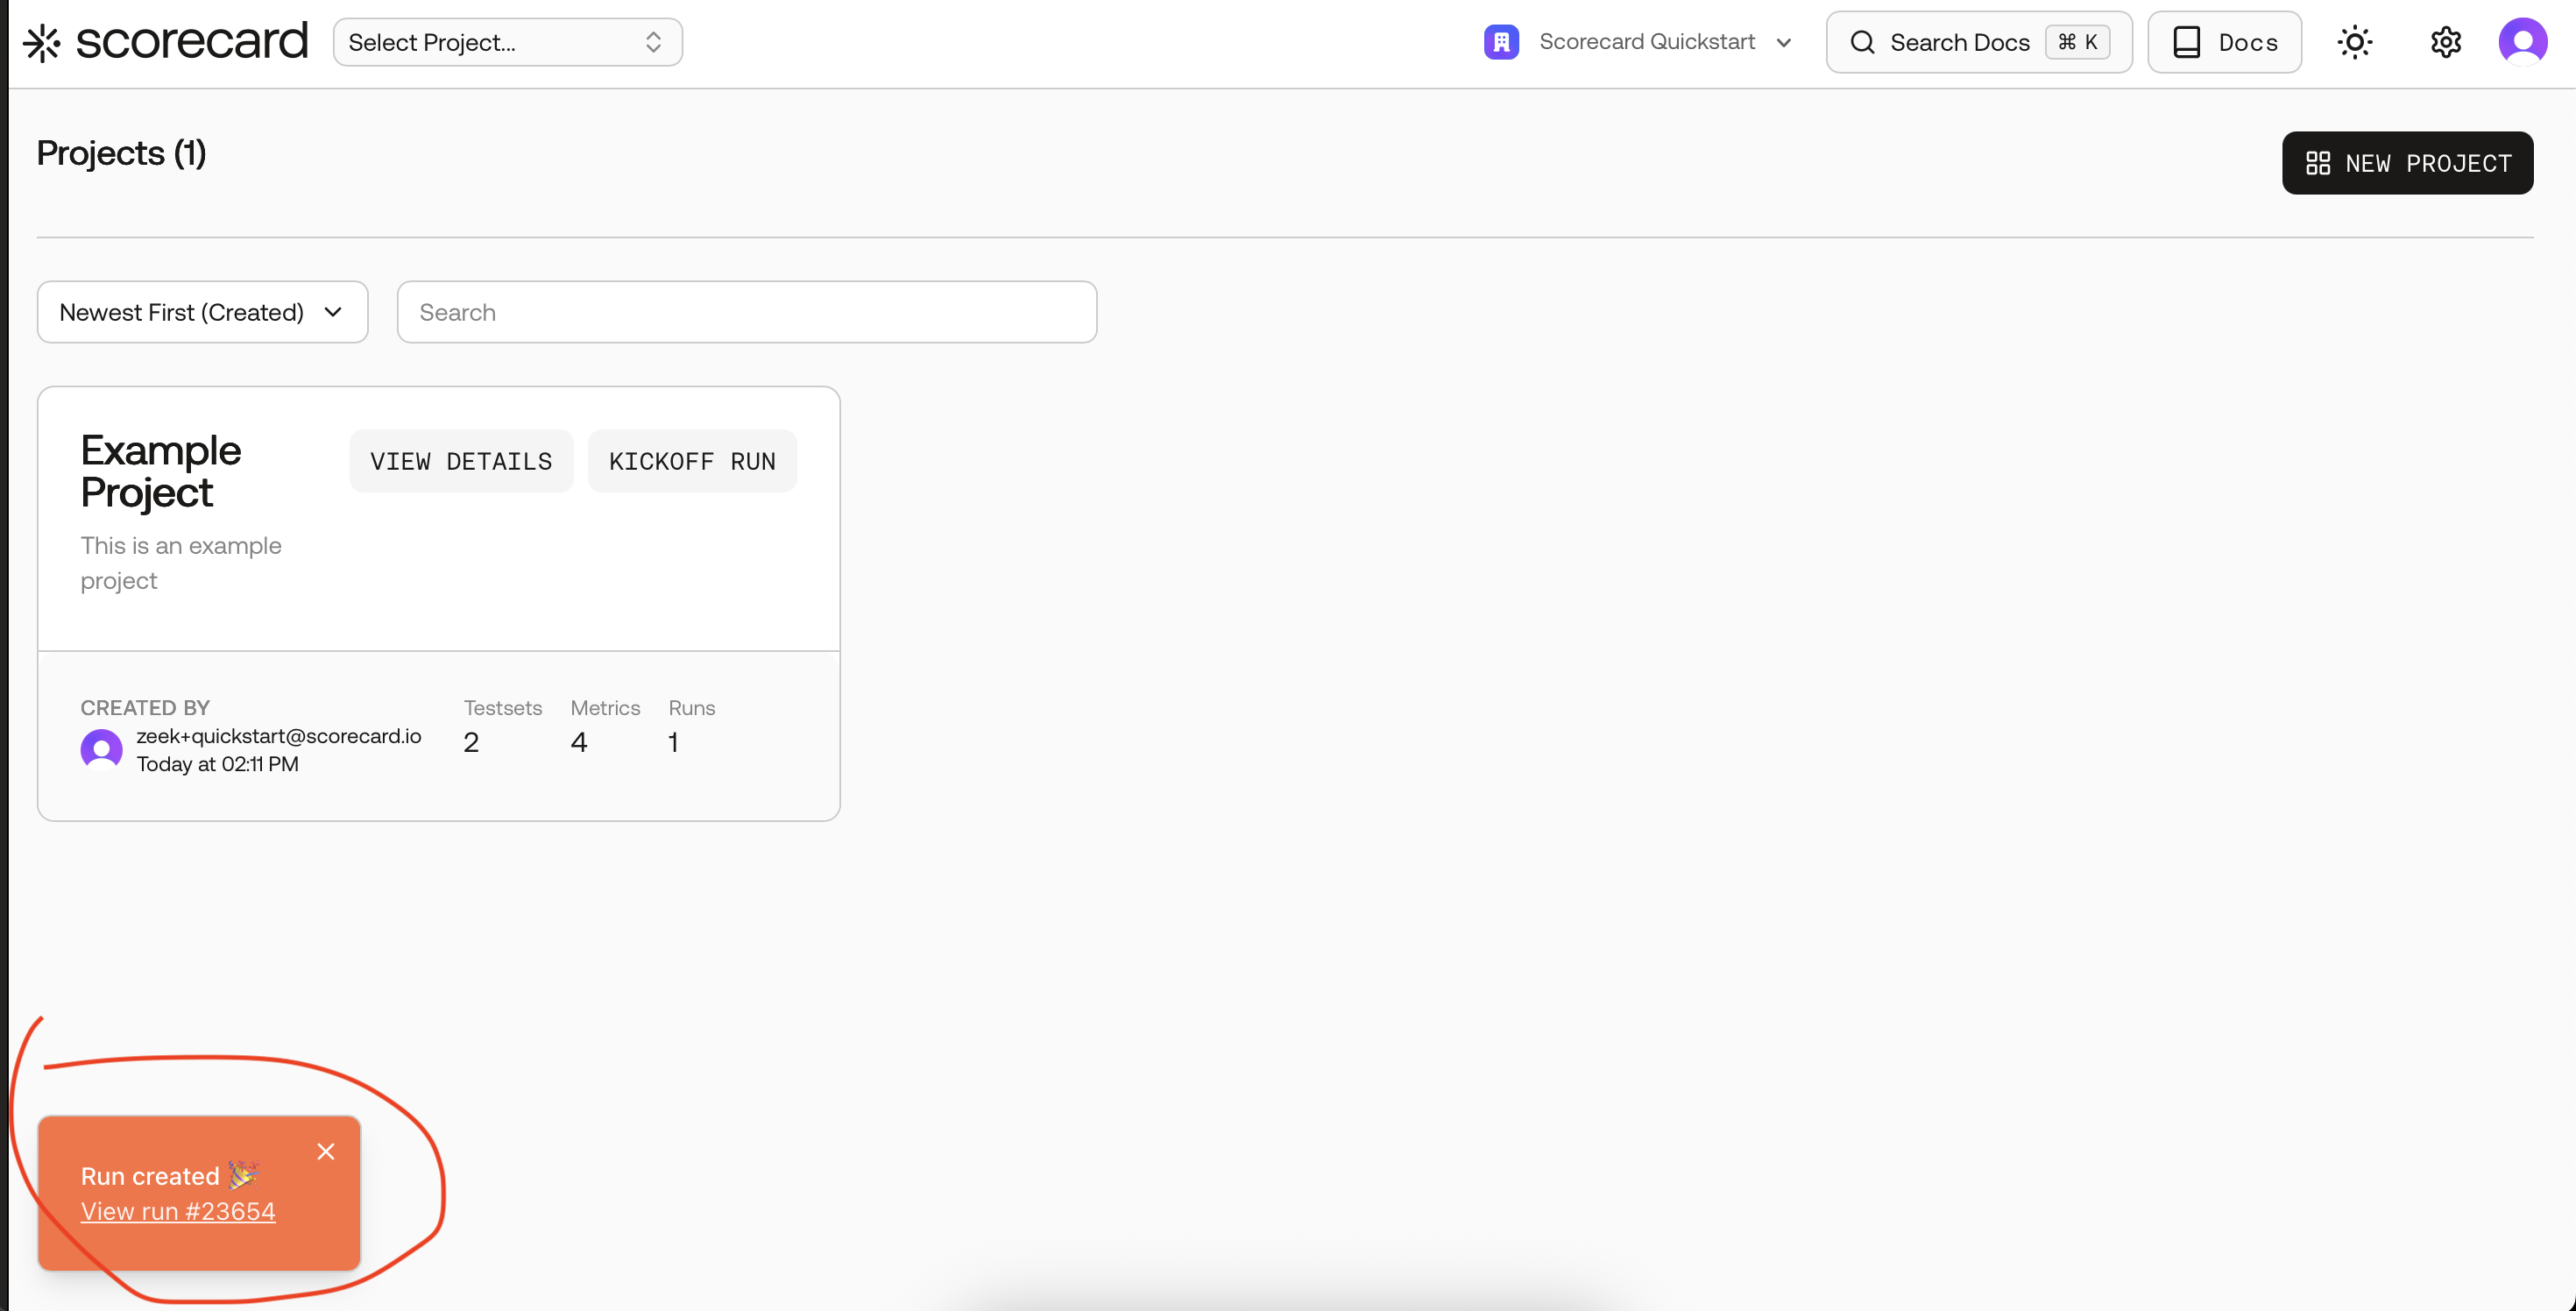
Pick a Testset (pre‑selected).
Optionally select multiple metrics or a metric group.
Run created — follow the link to results.
3
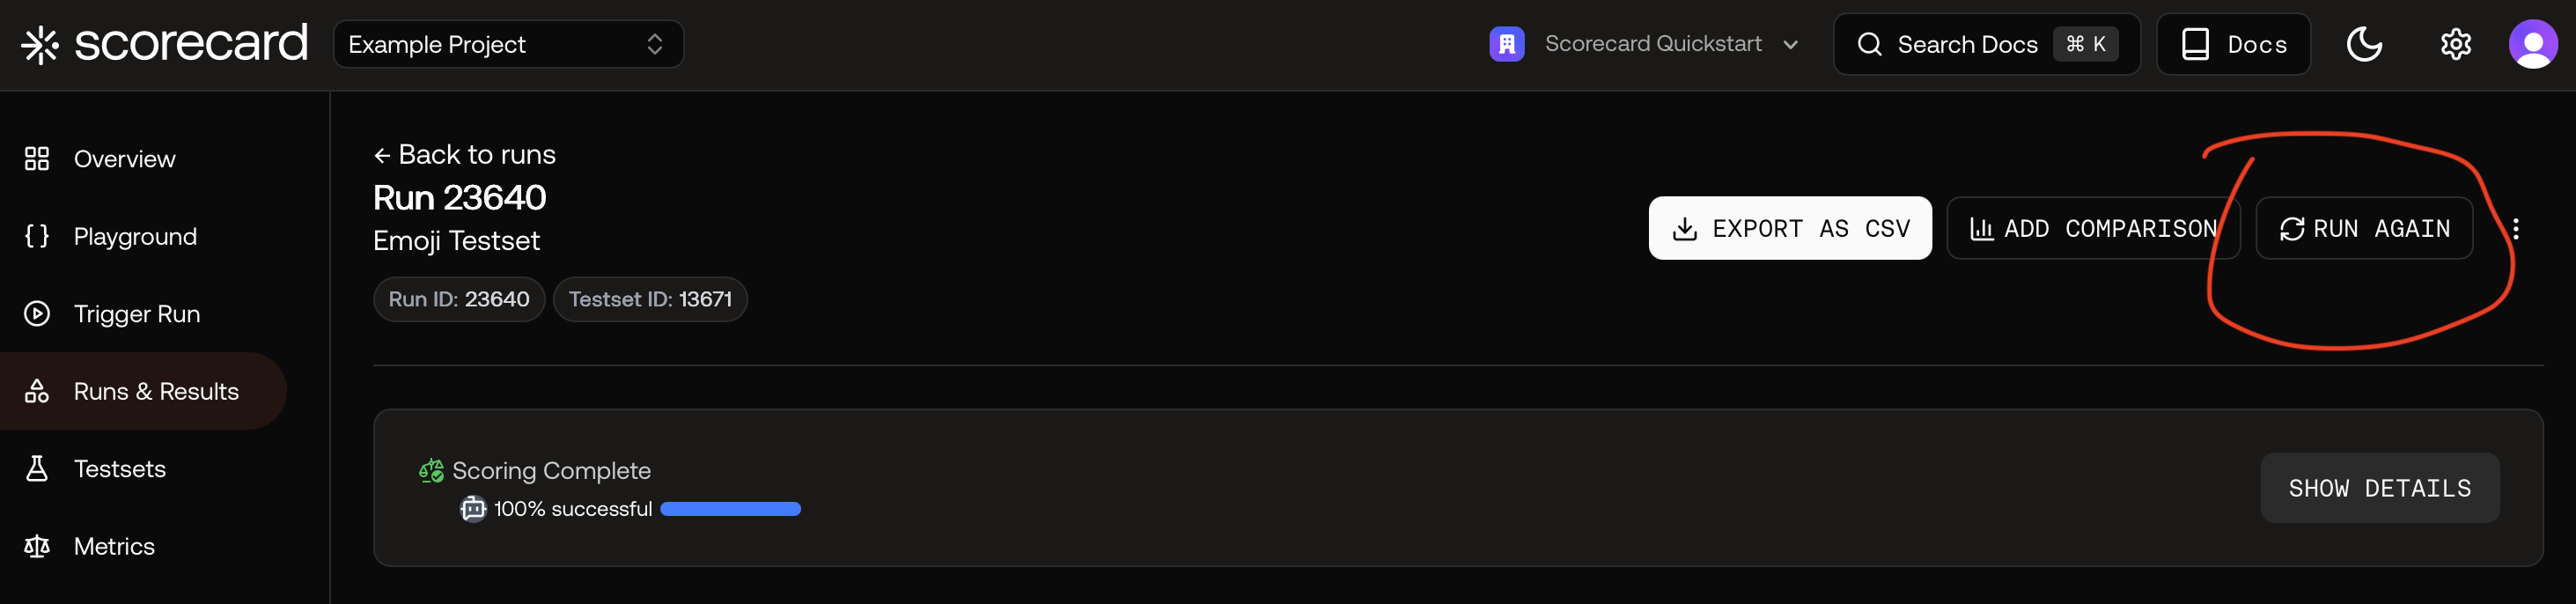
View results (or open the sample run)
After your run starts and scoring completes, open the results to see per‑record scores, distributions, and explanations. You can also click “Run again” to rerun with new settings.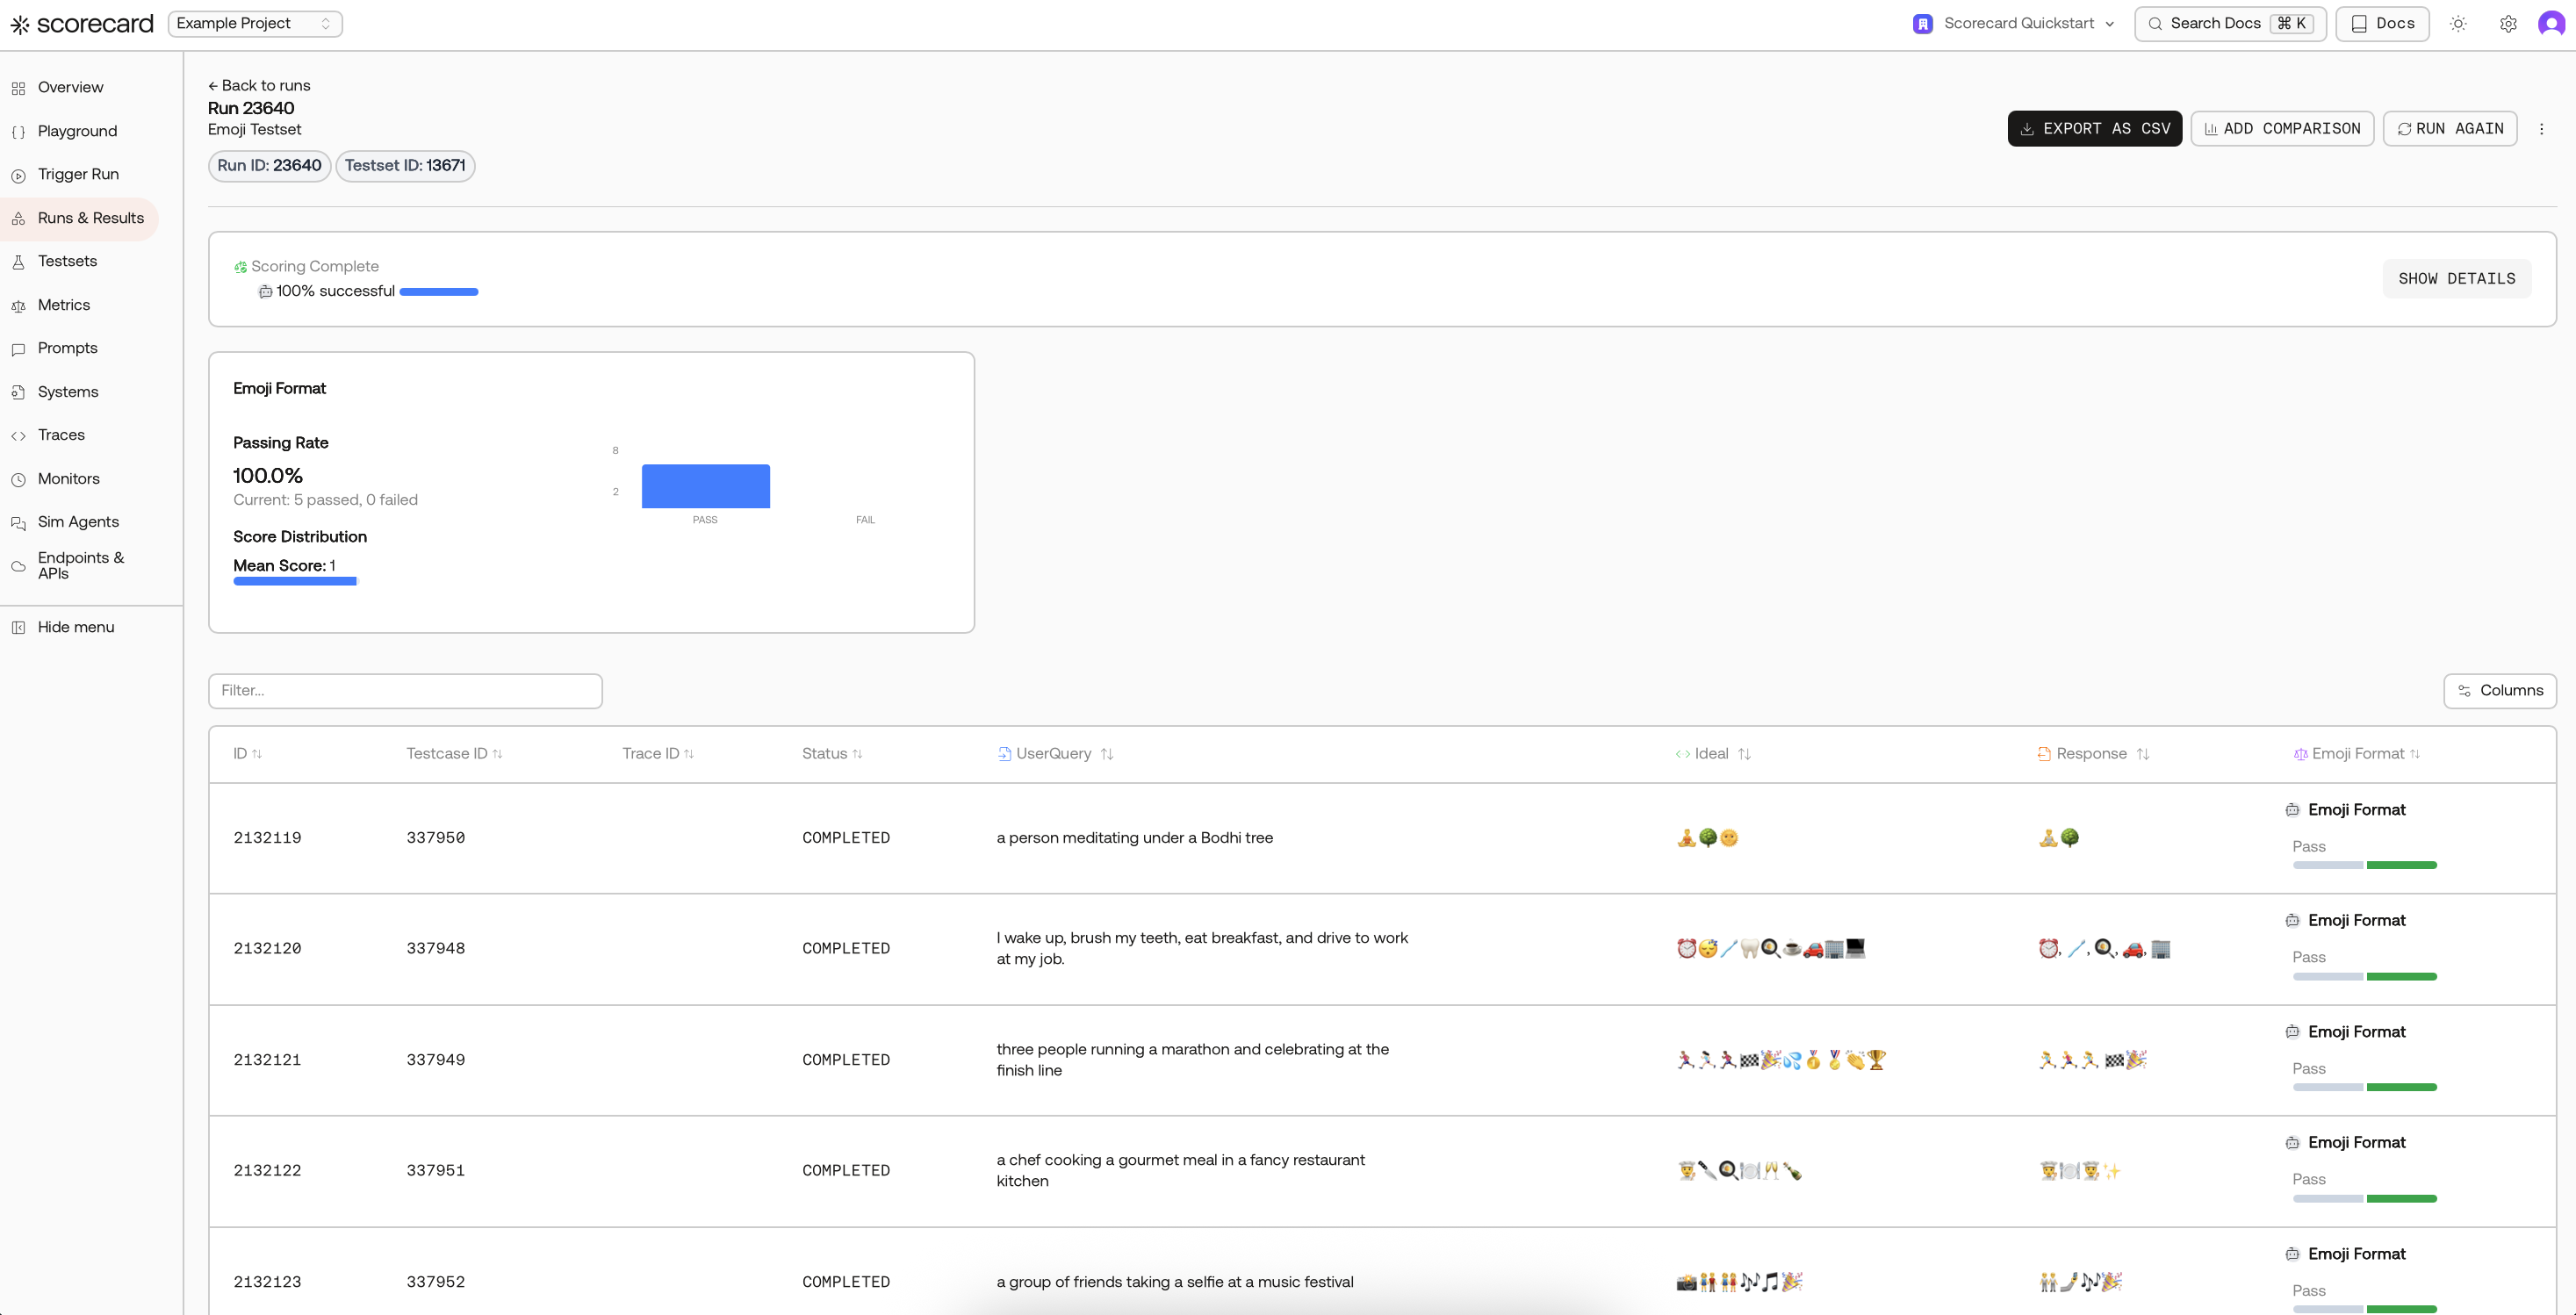
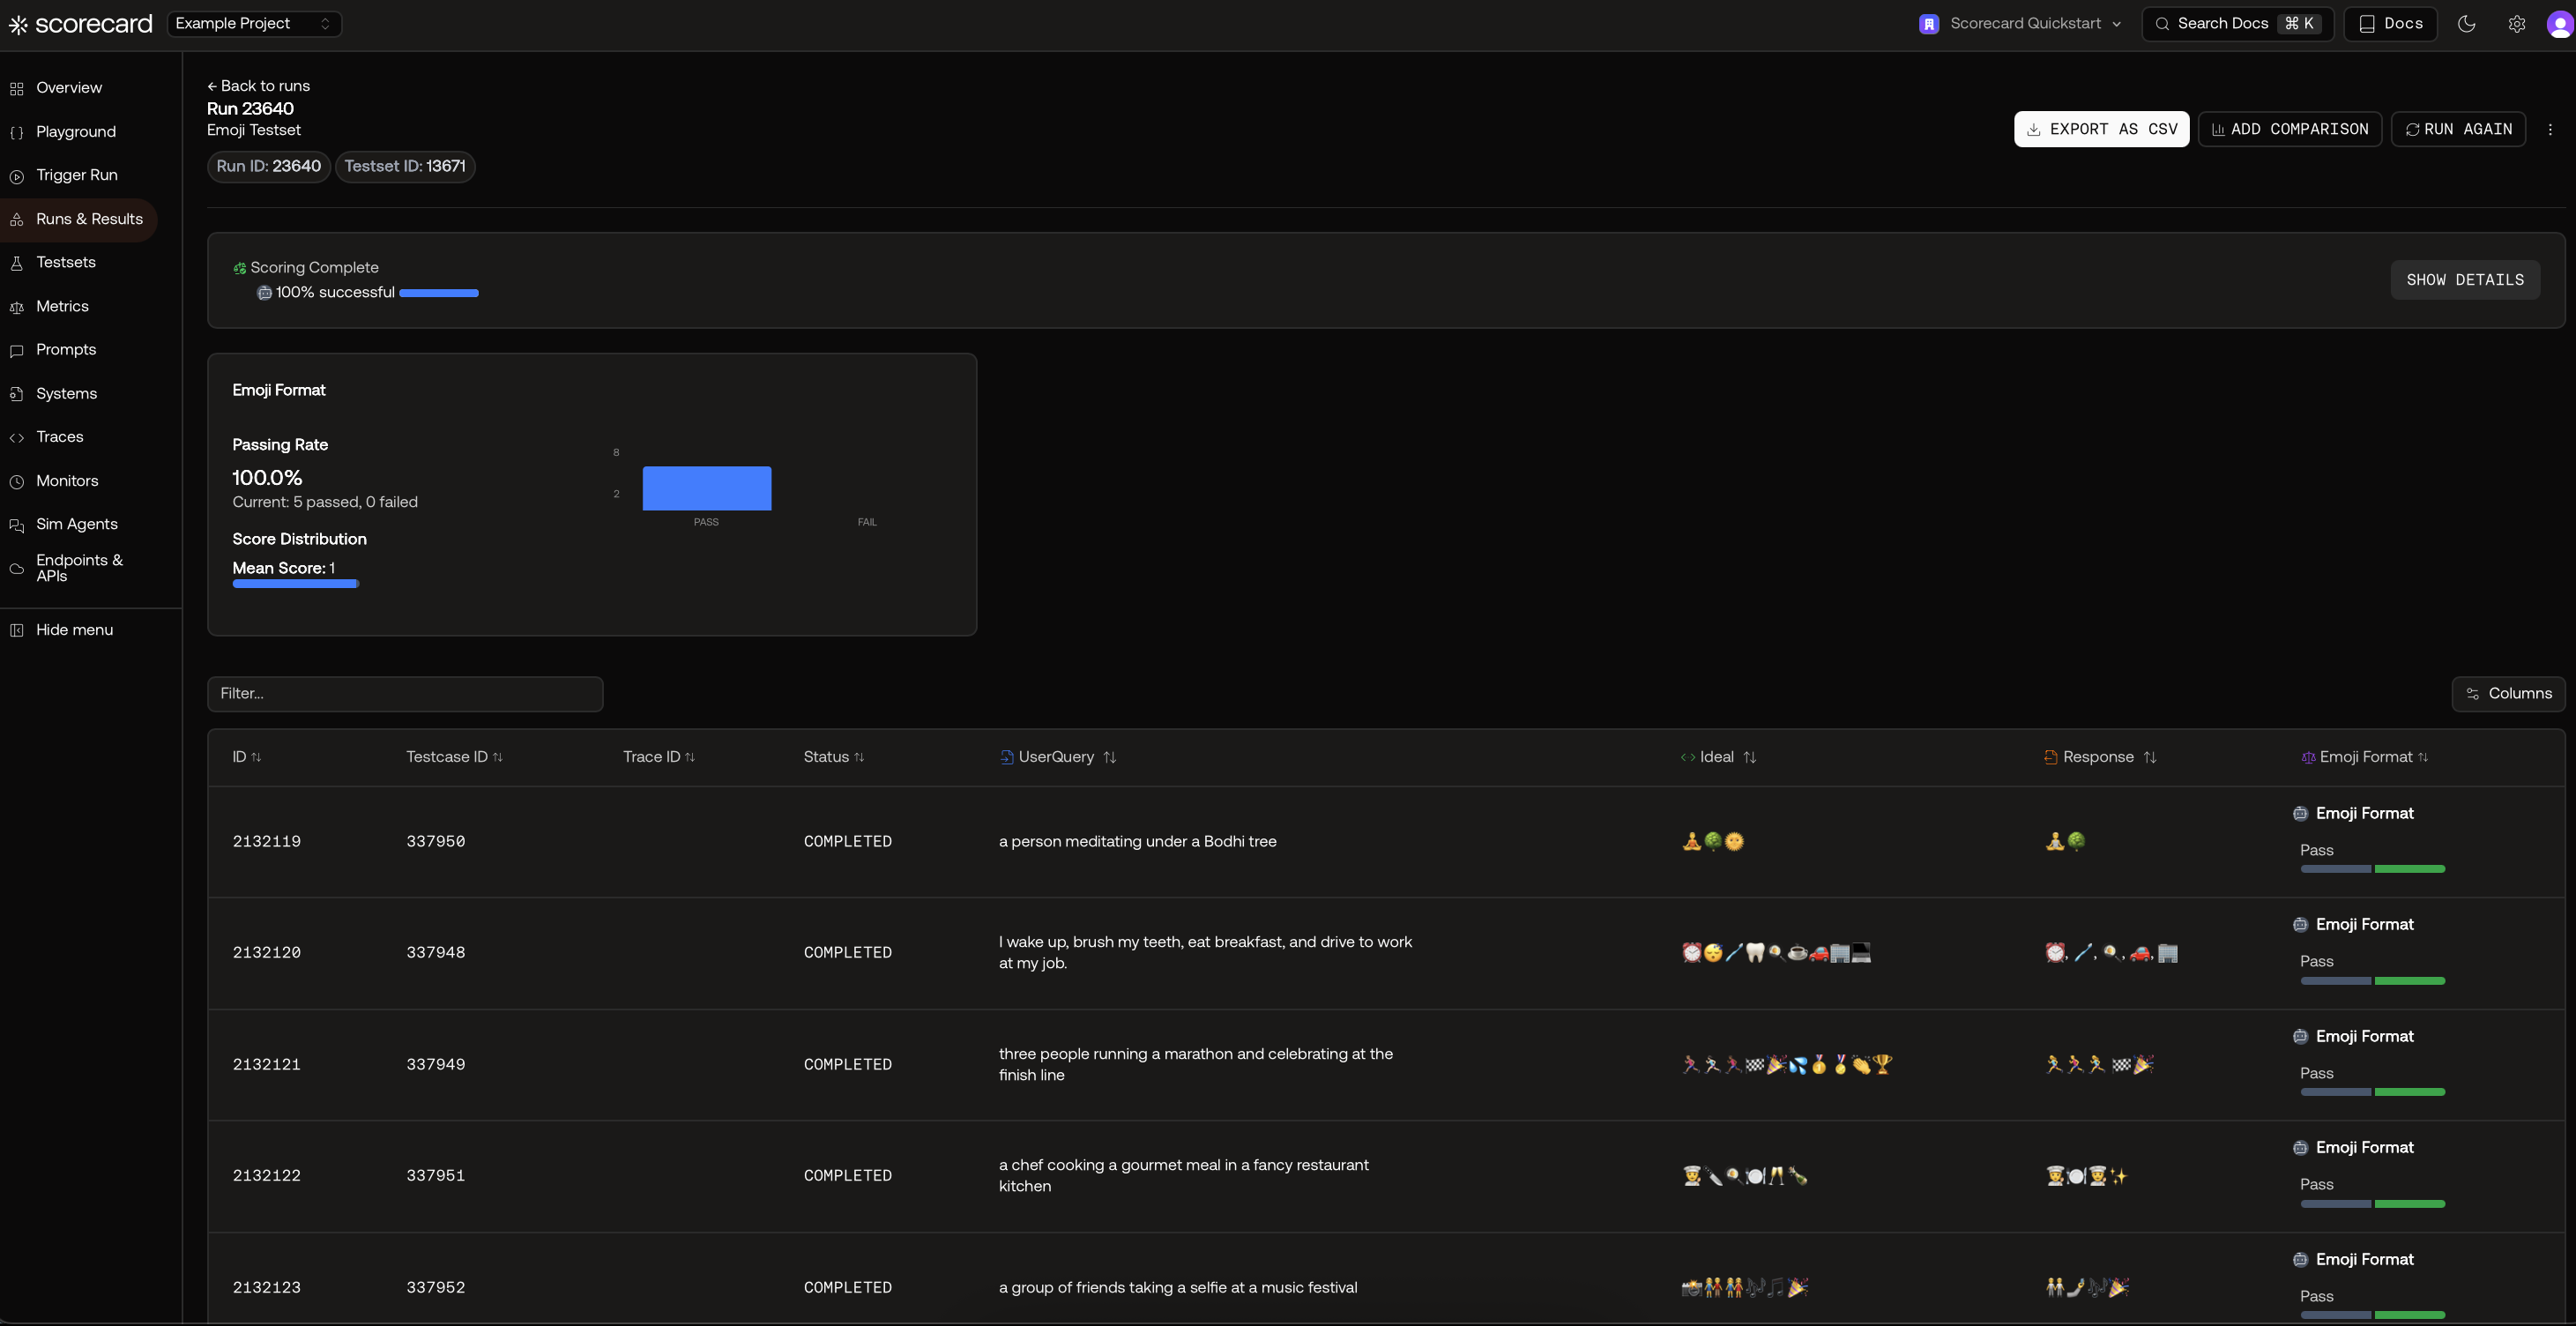 Tip: Click Run Again to iterate with a different prompt version, model, or metric set.
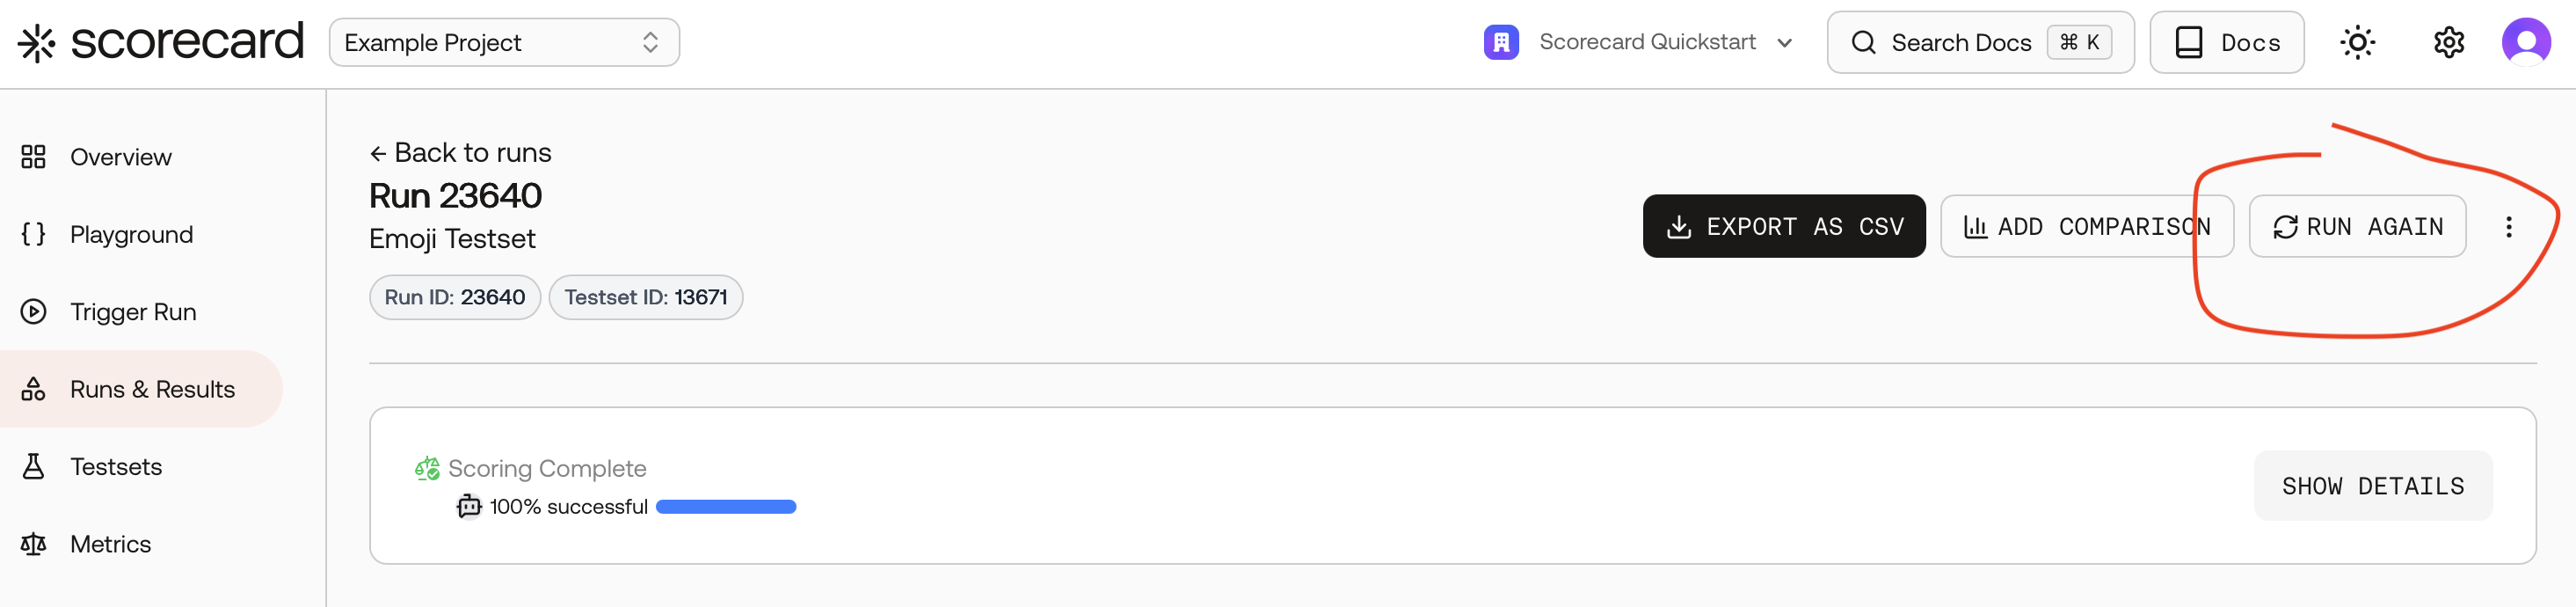
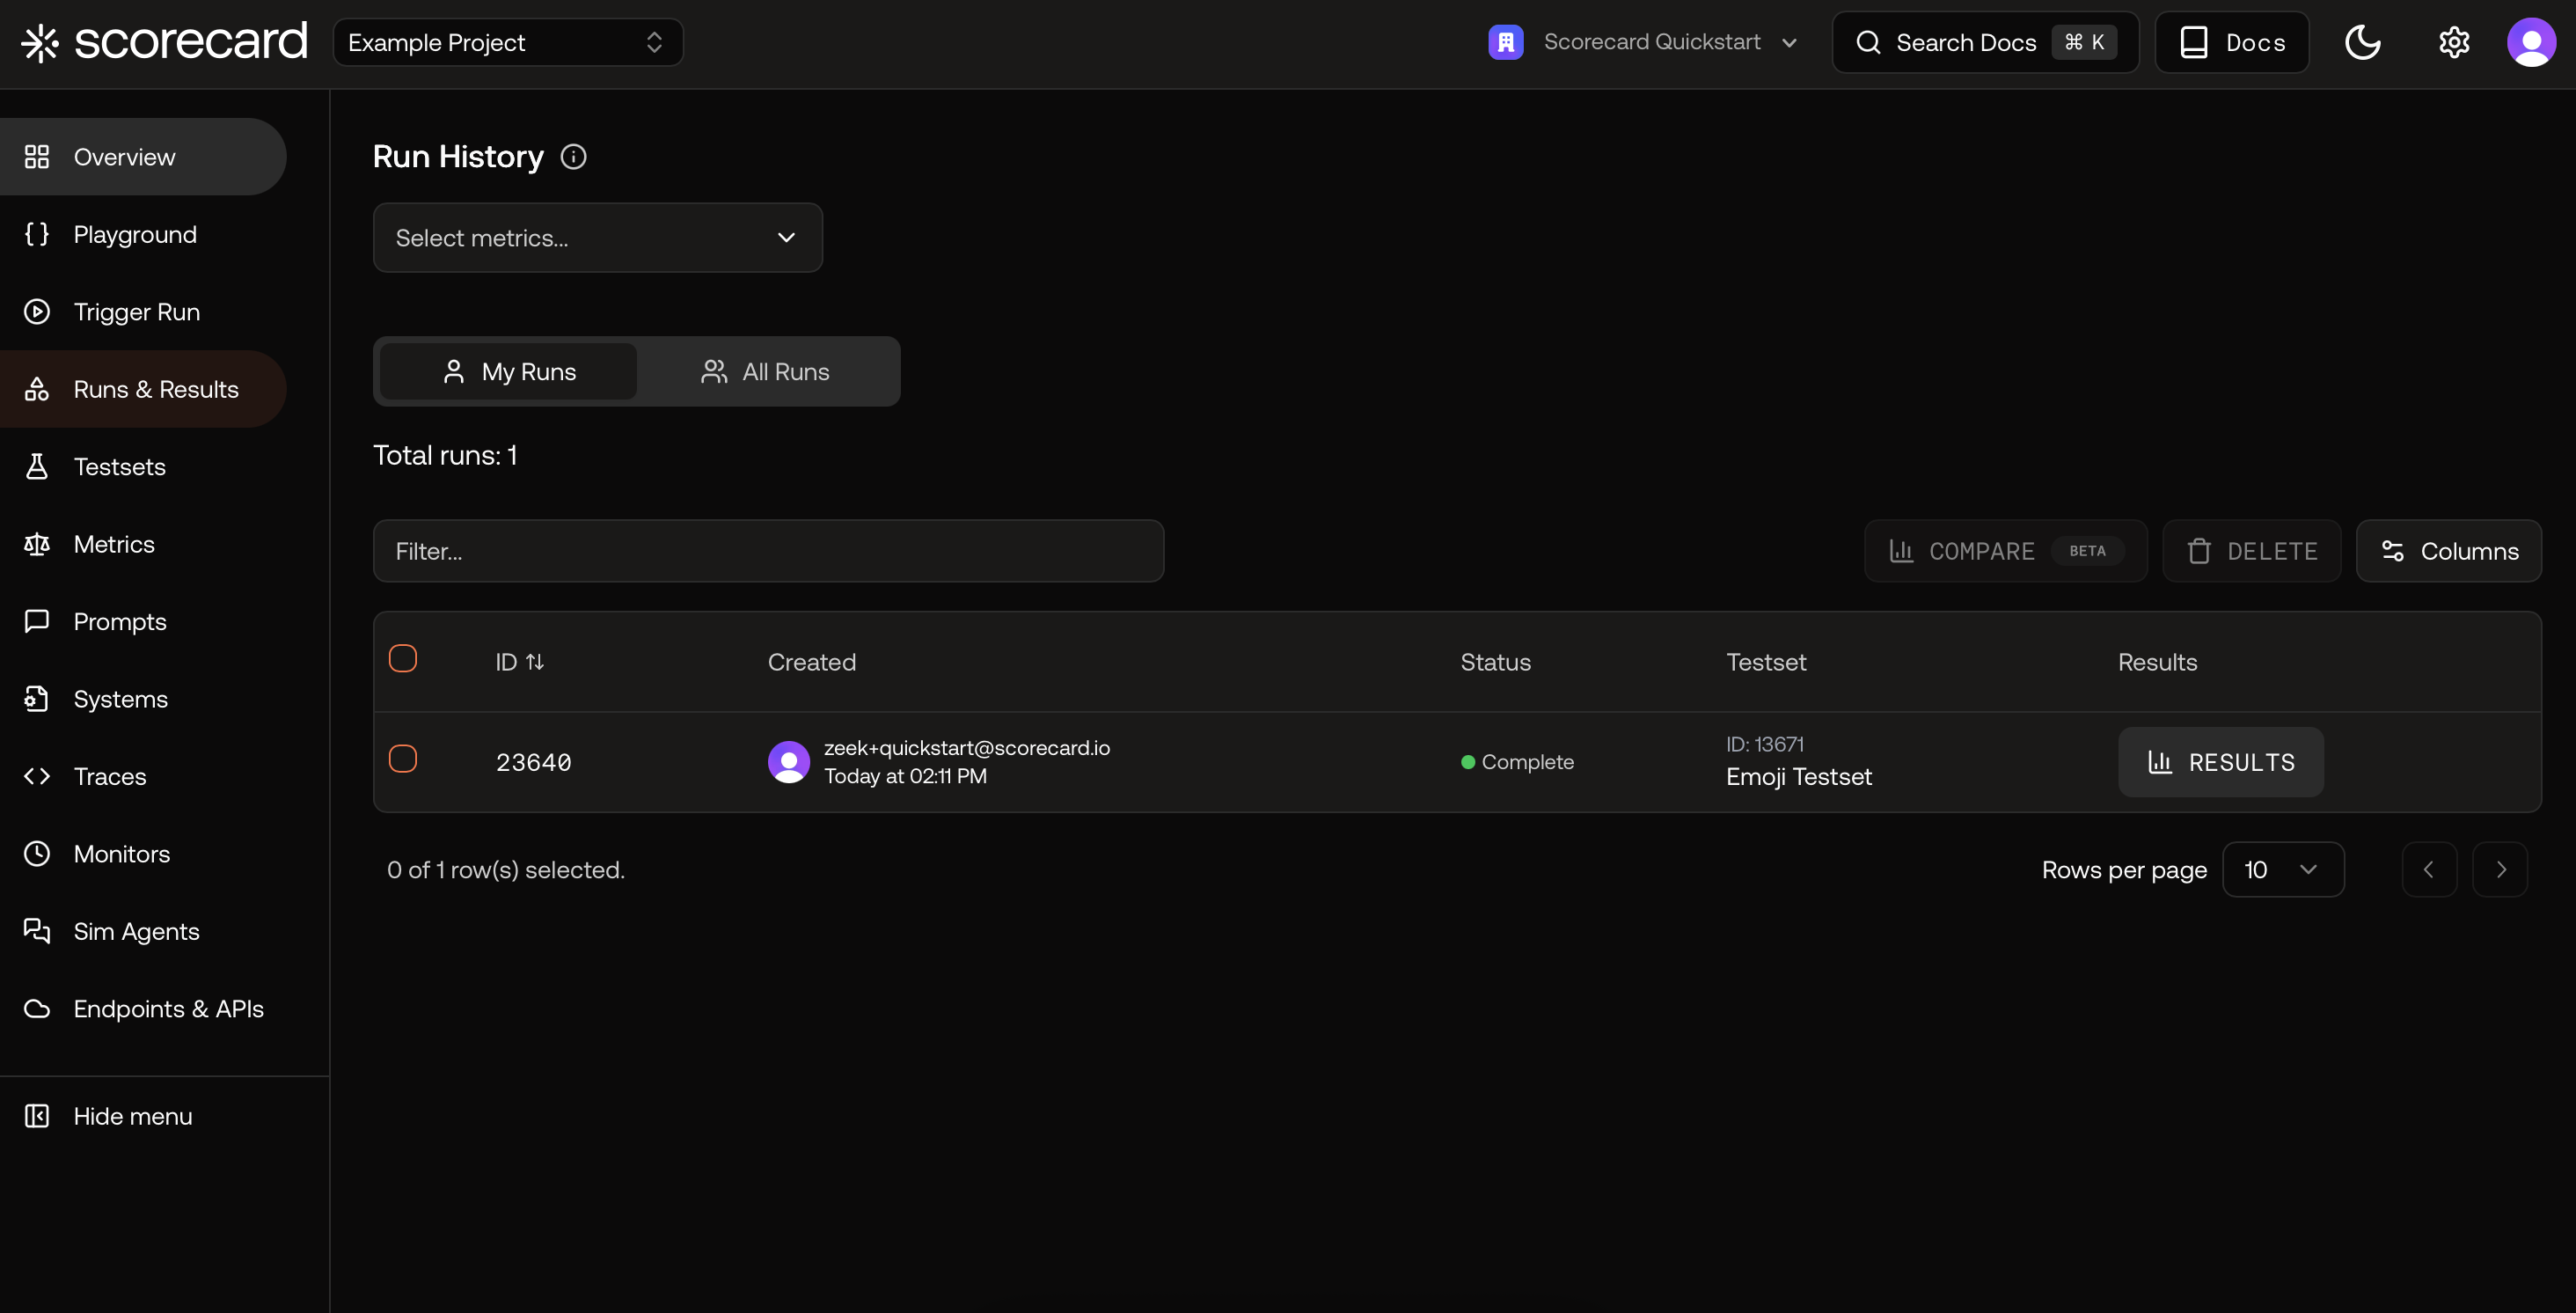
 Prefer to just explore? Visit Runs & Results to open the example run that was created for you automatically.
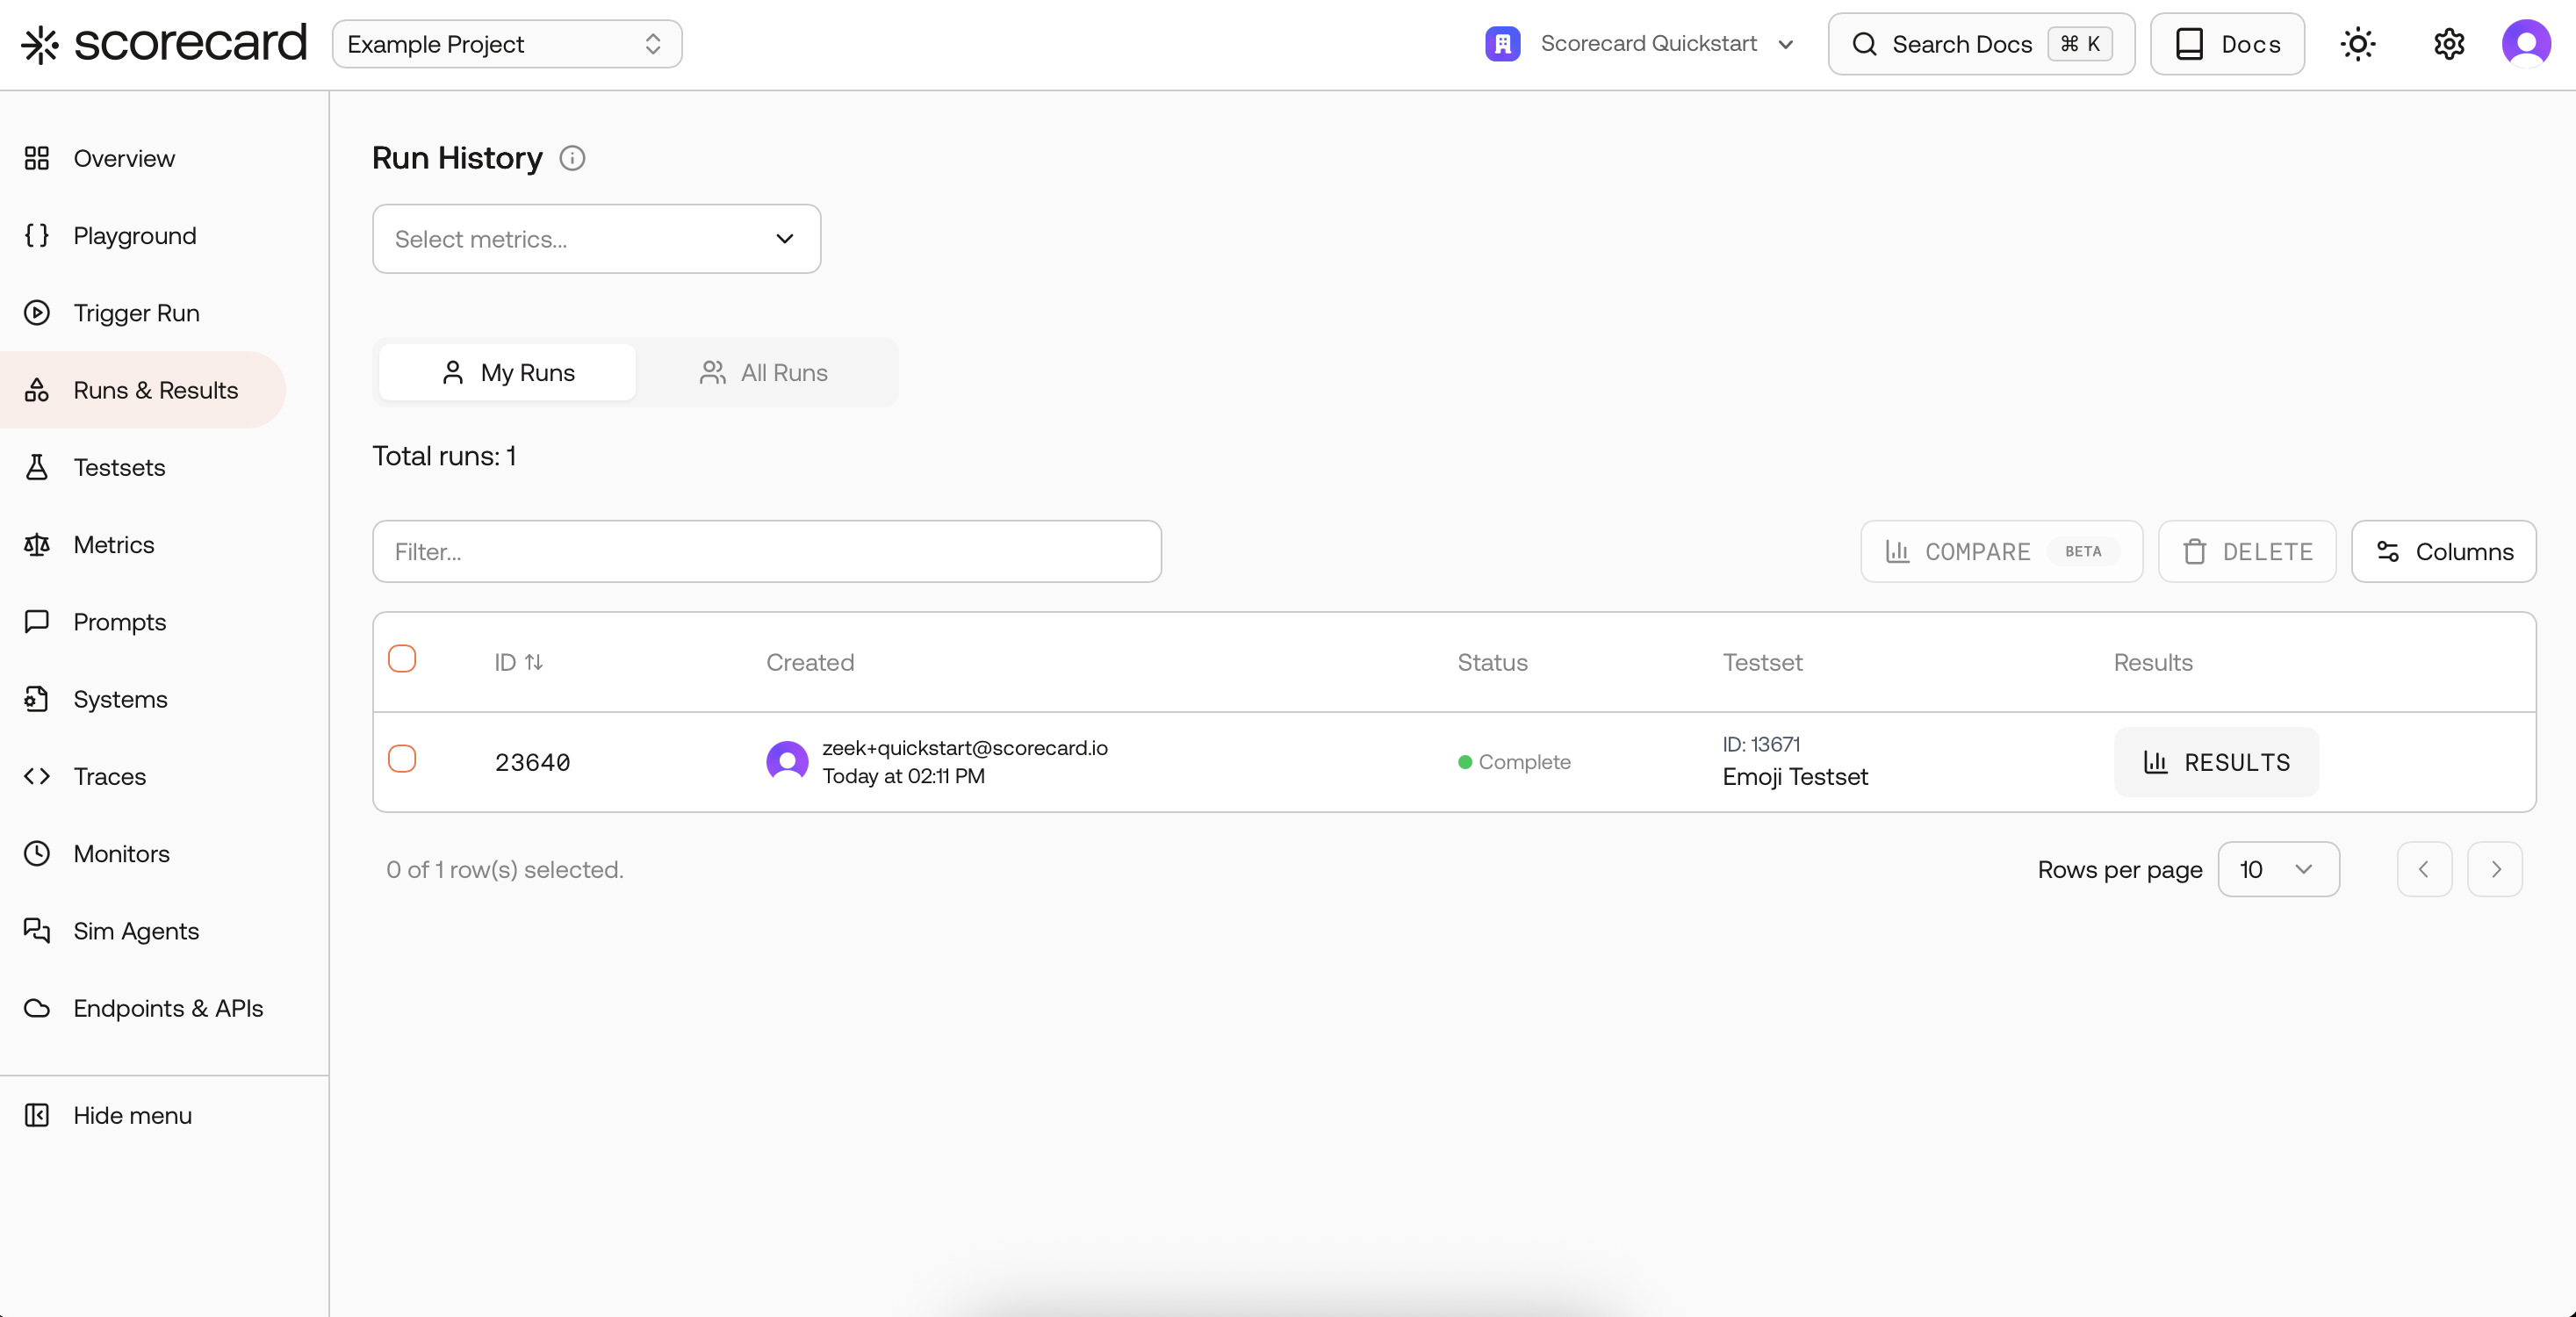
Run details with scores and aggregates.
Run Again lets you quickly iterate.
Runs list with your first example run.
4
Browse the Example Project
Learn how the sample data is organized: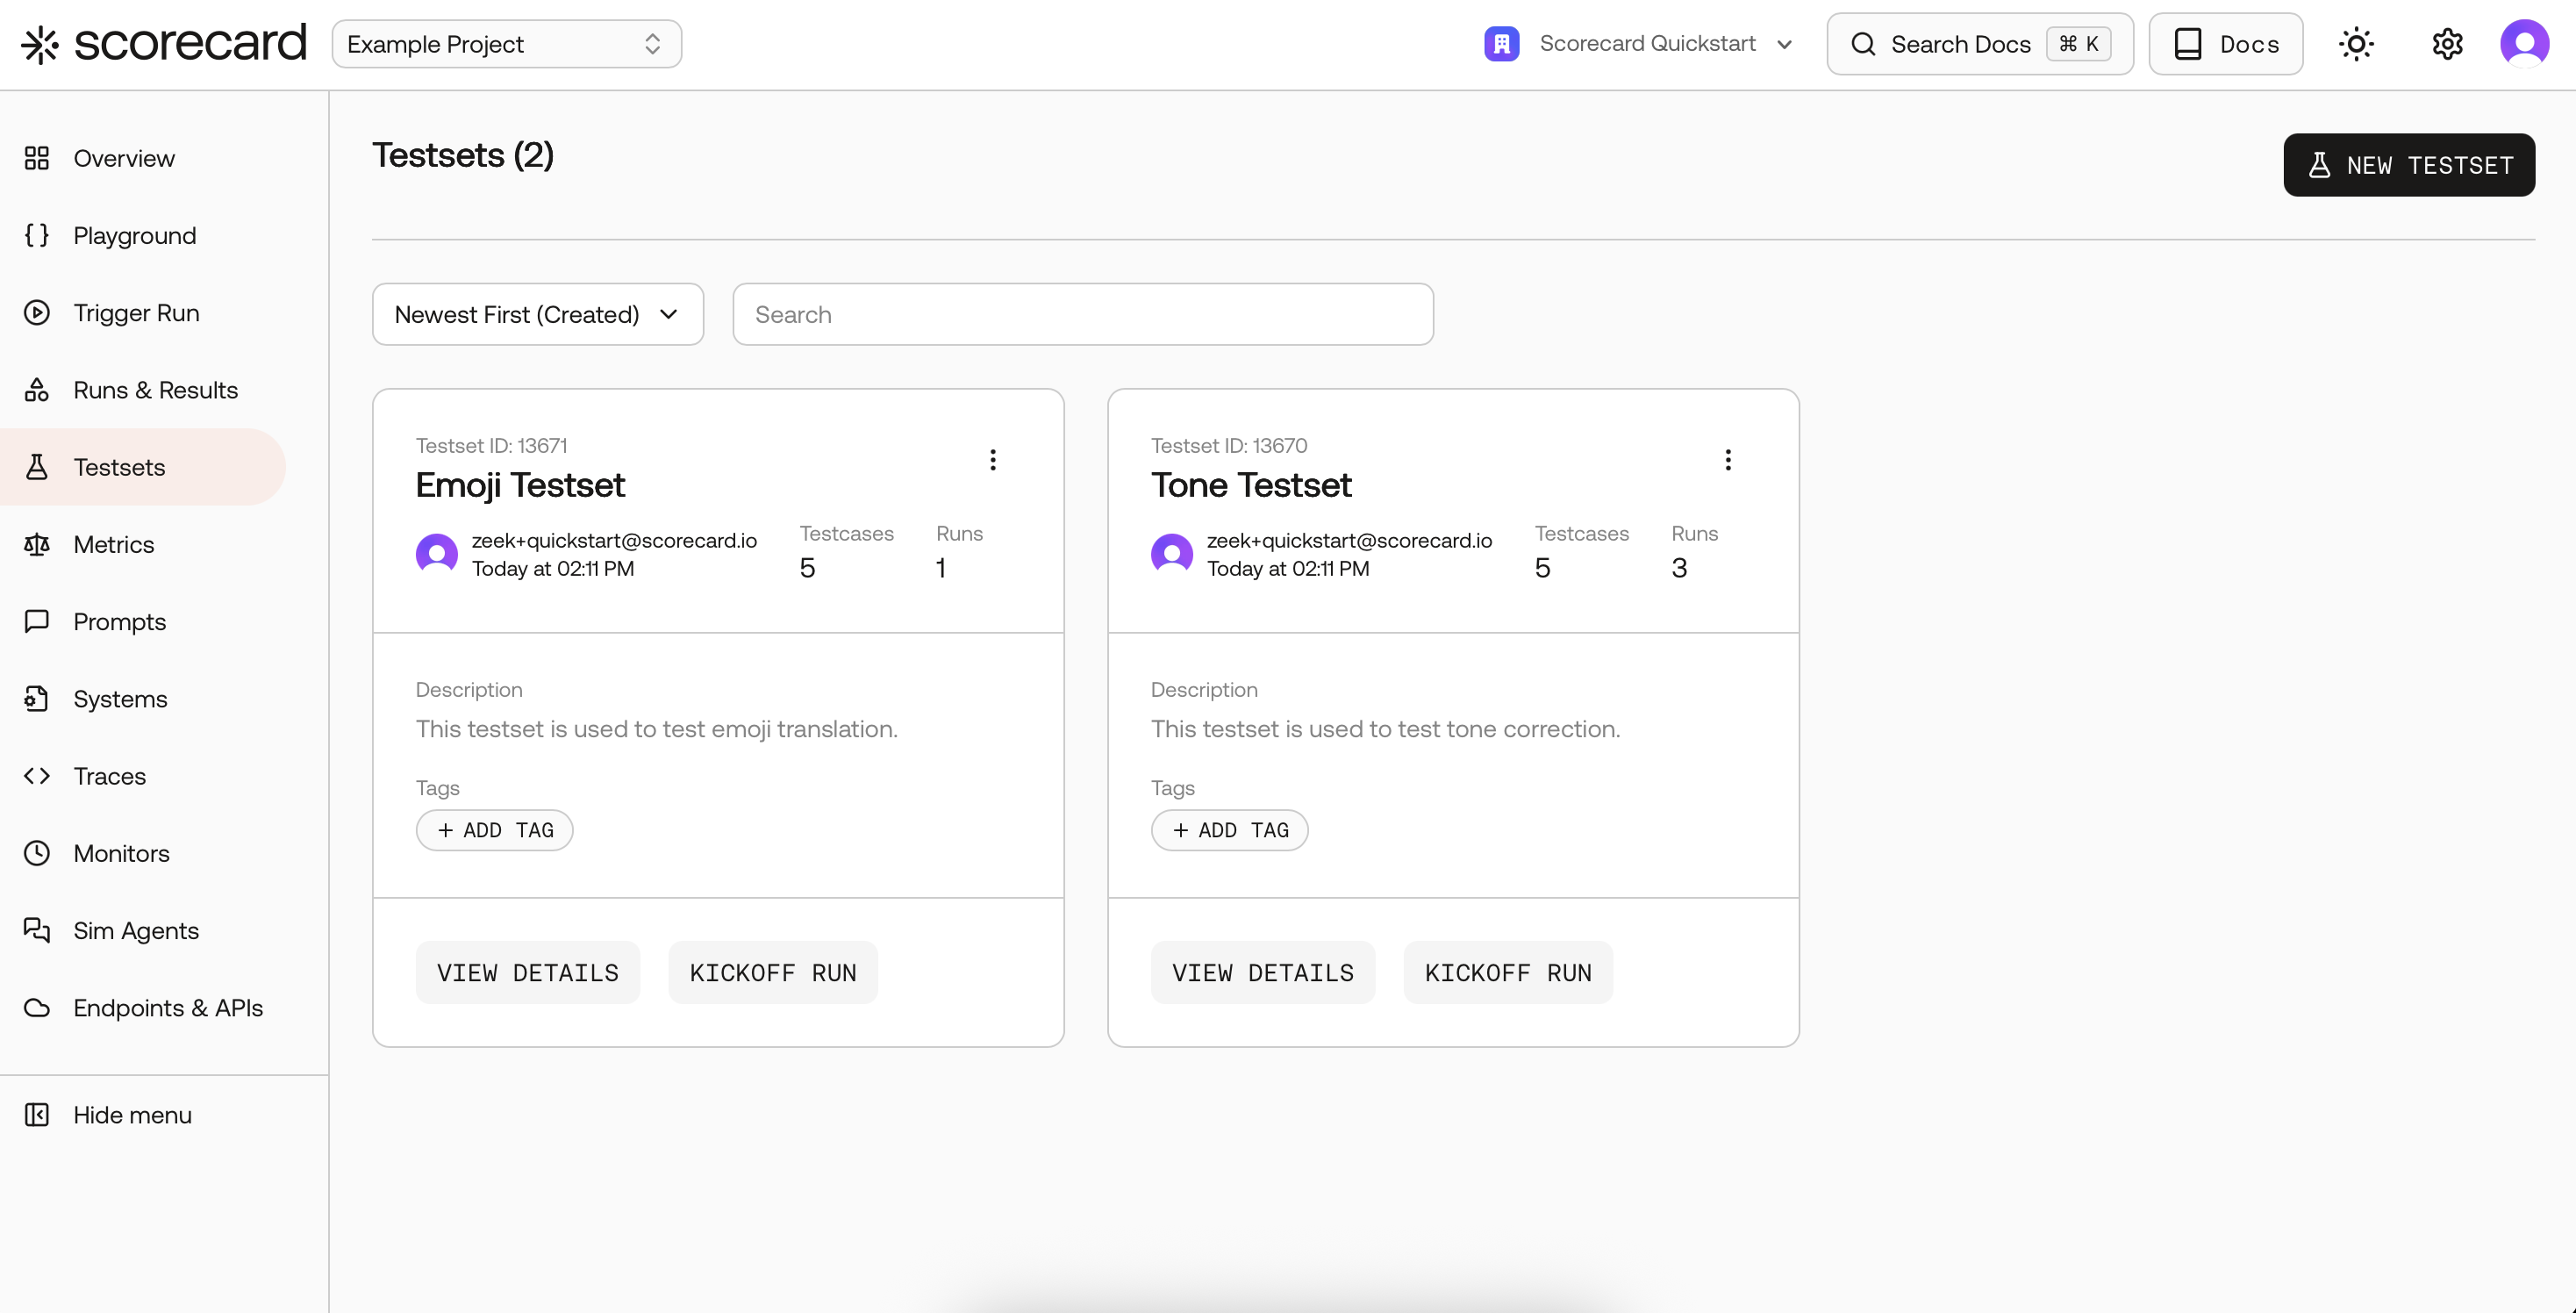
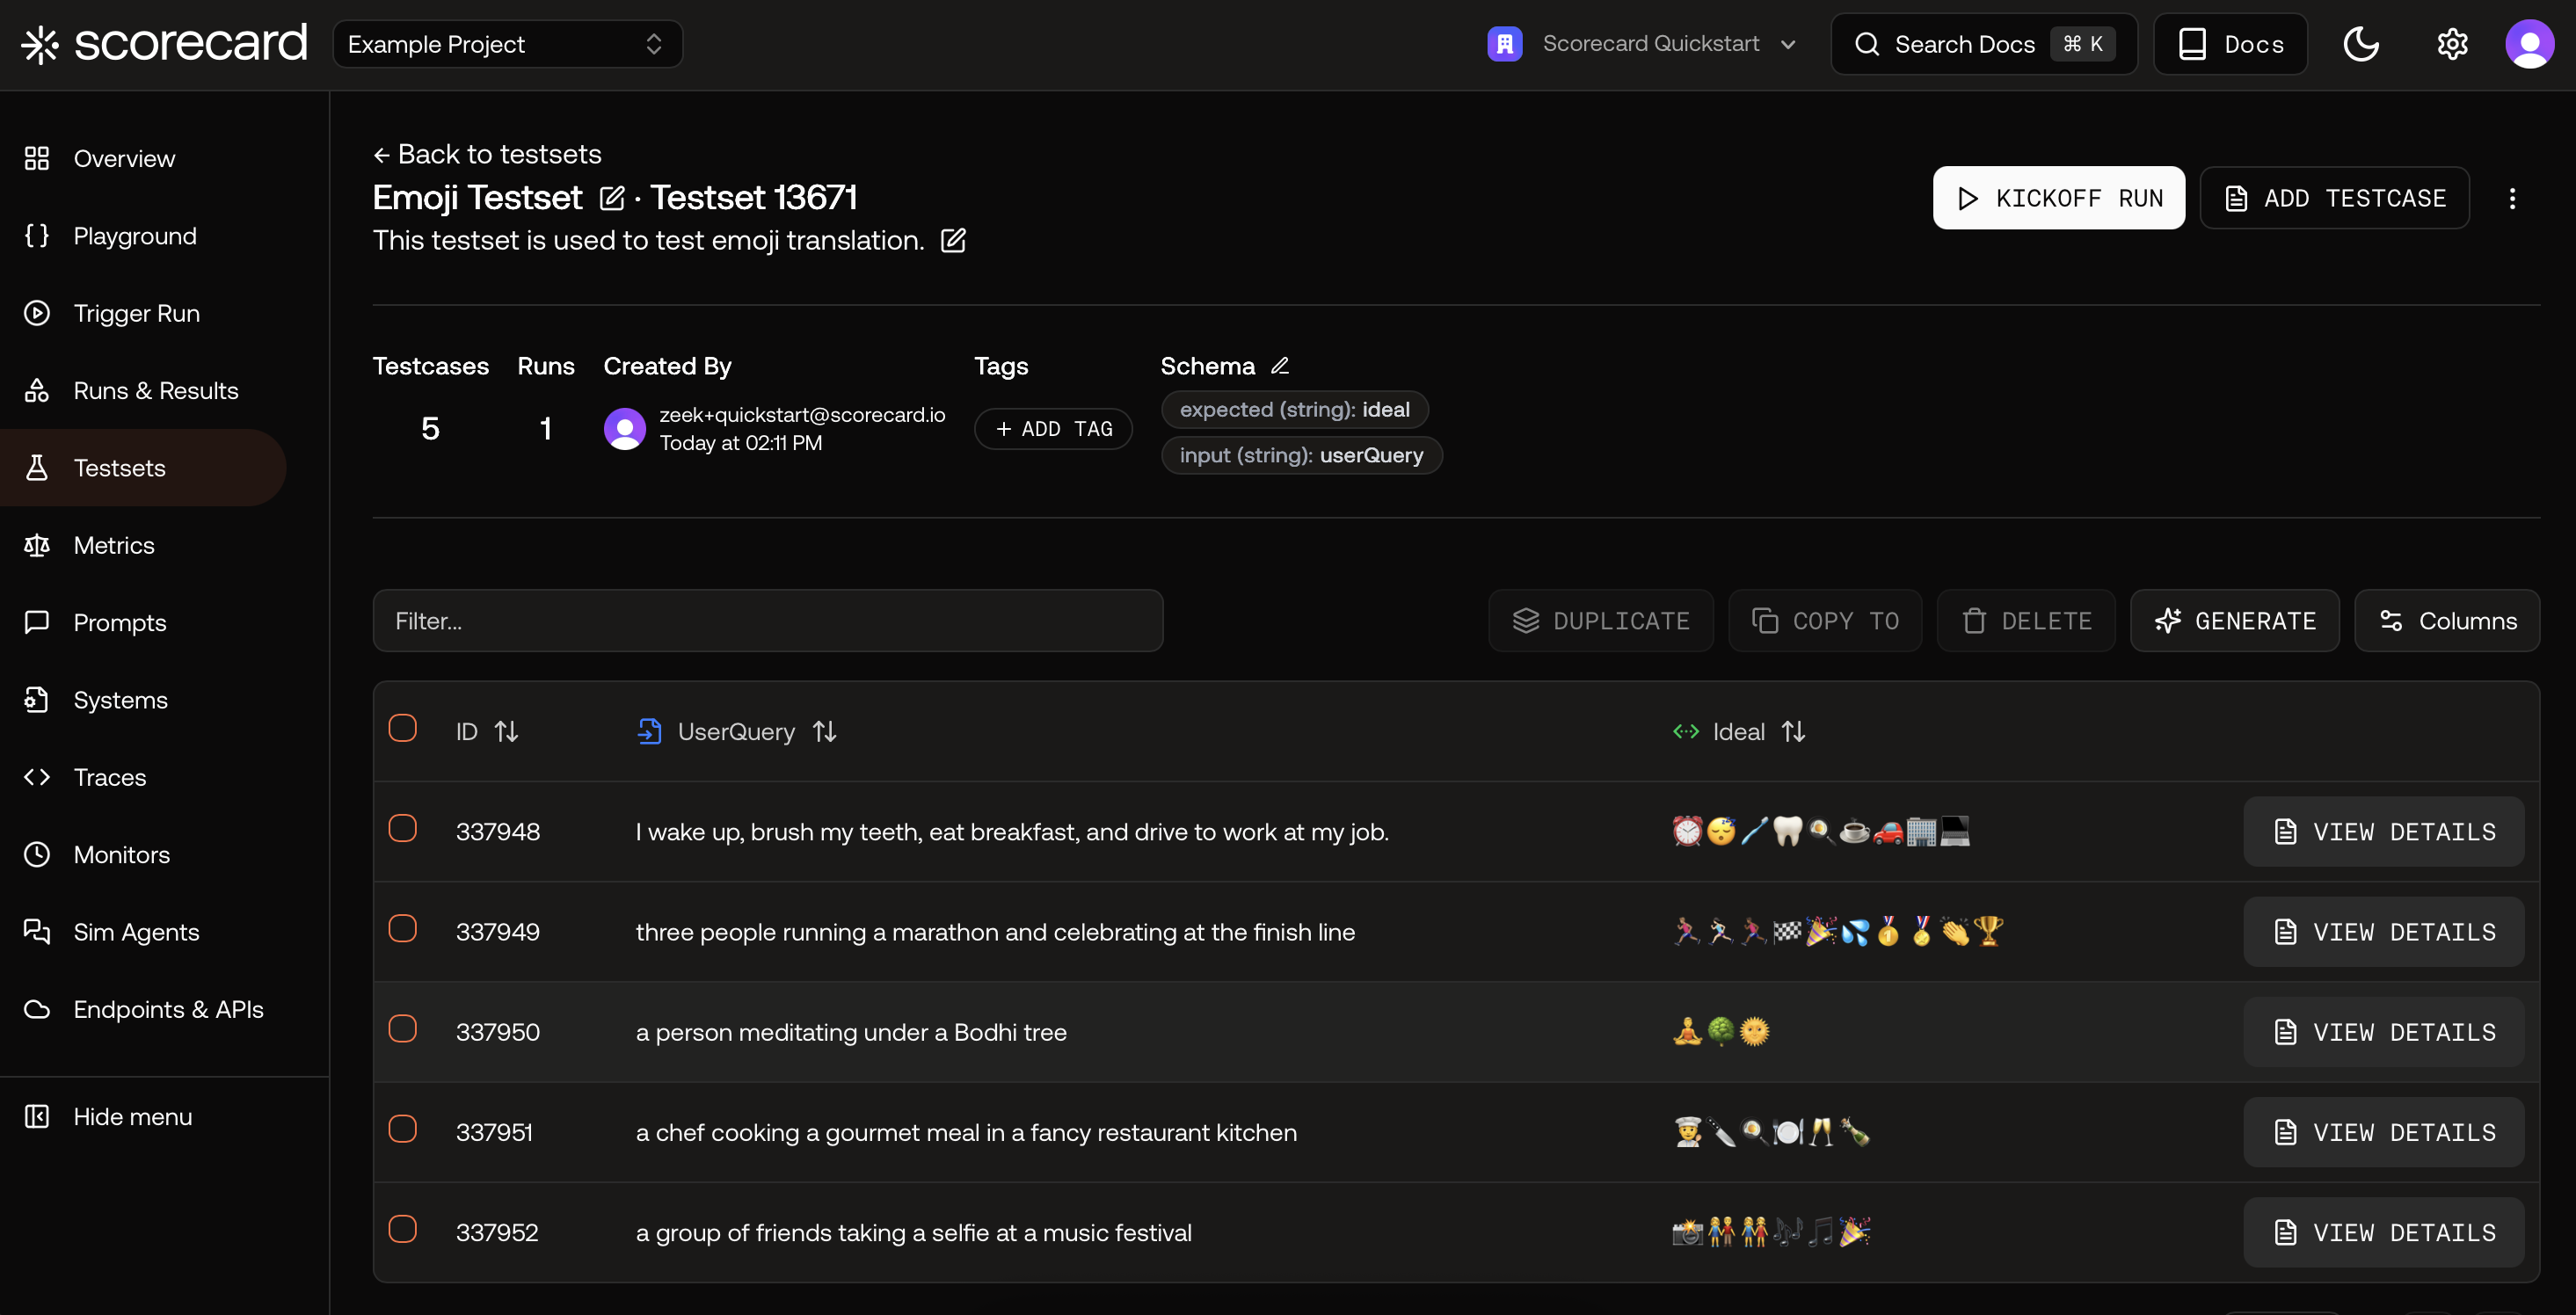
 Open a Testset to see its schema and Testcases. Click a testcase row to view its inputs and expected outputs.
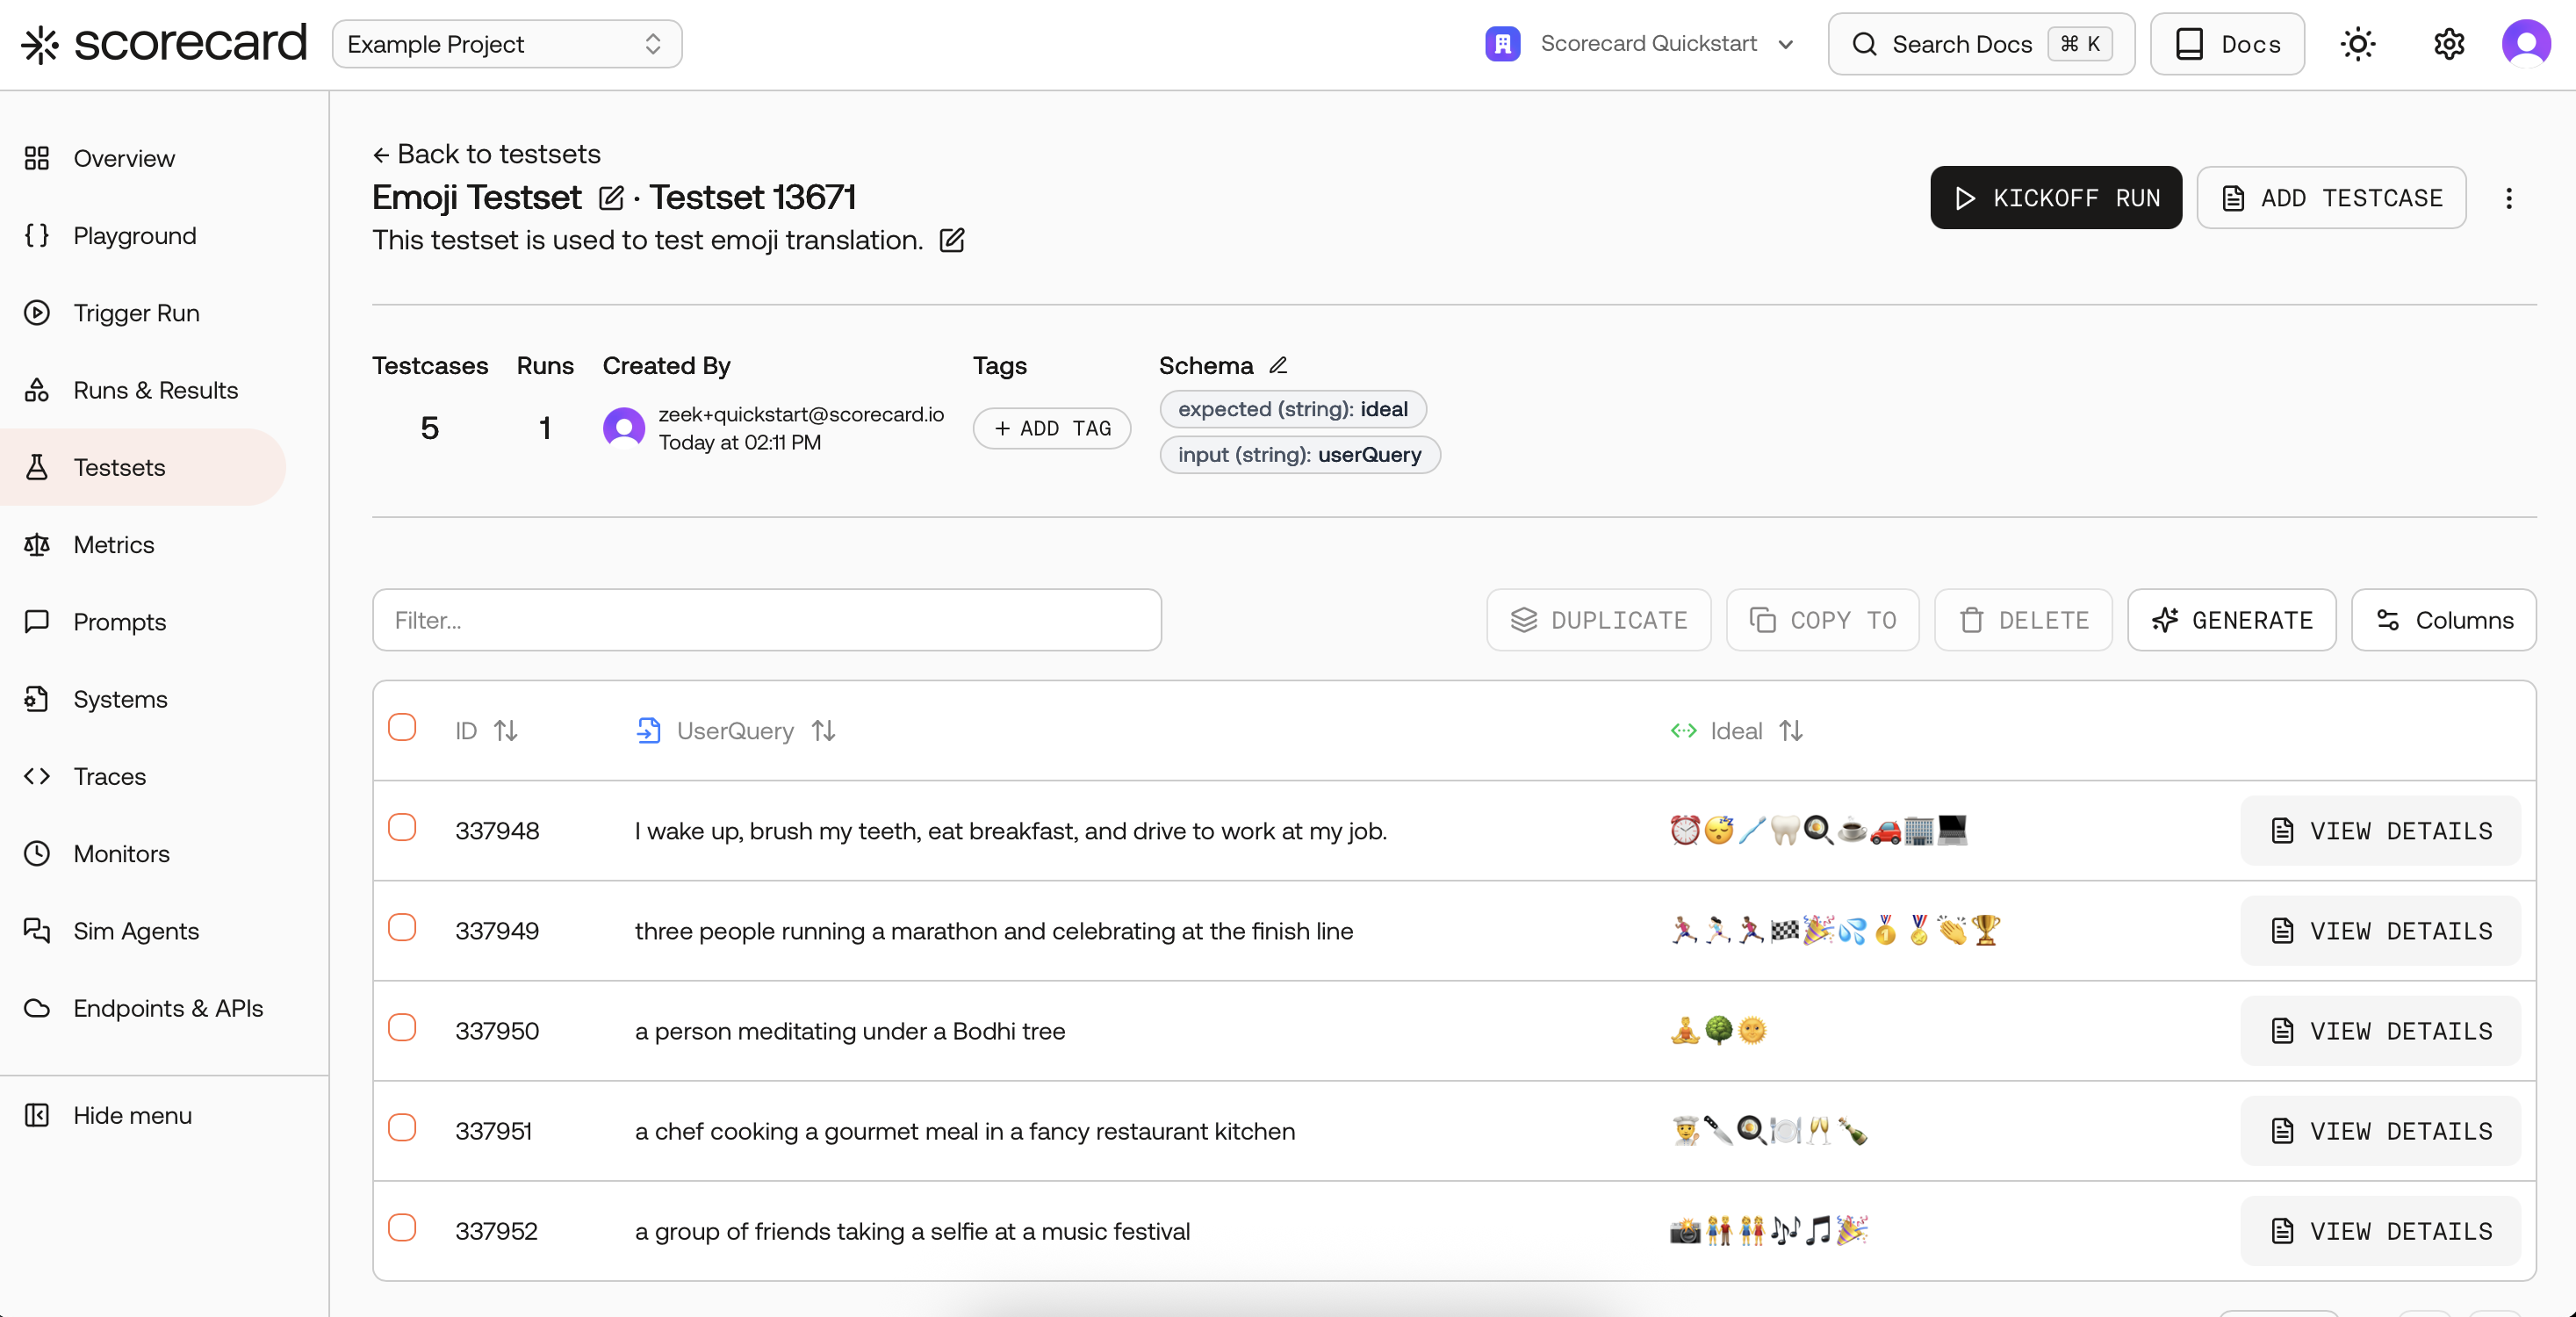
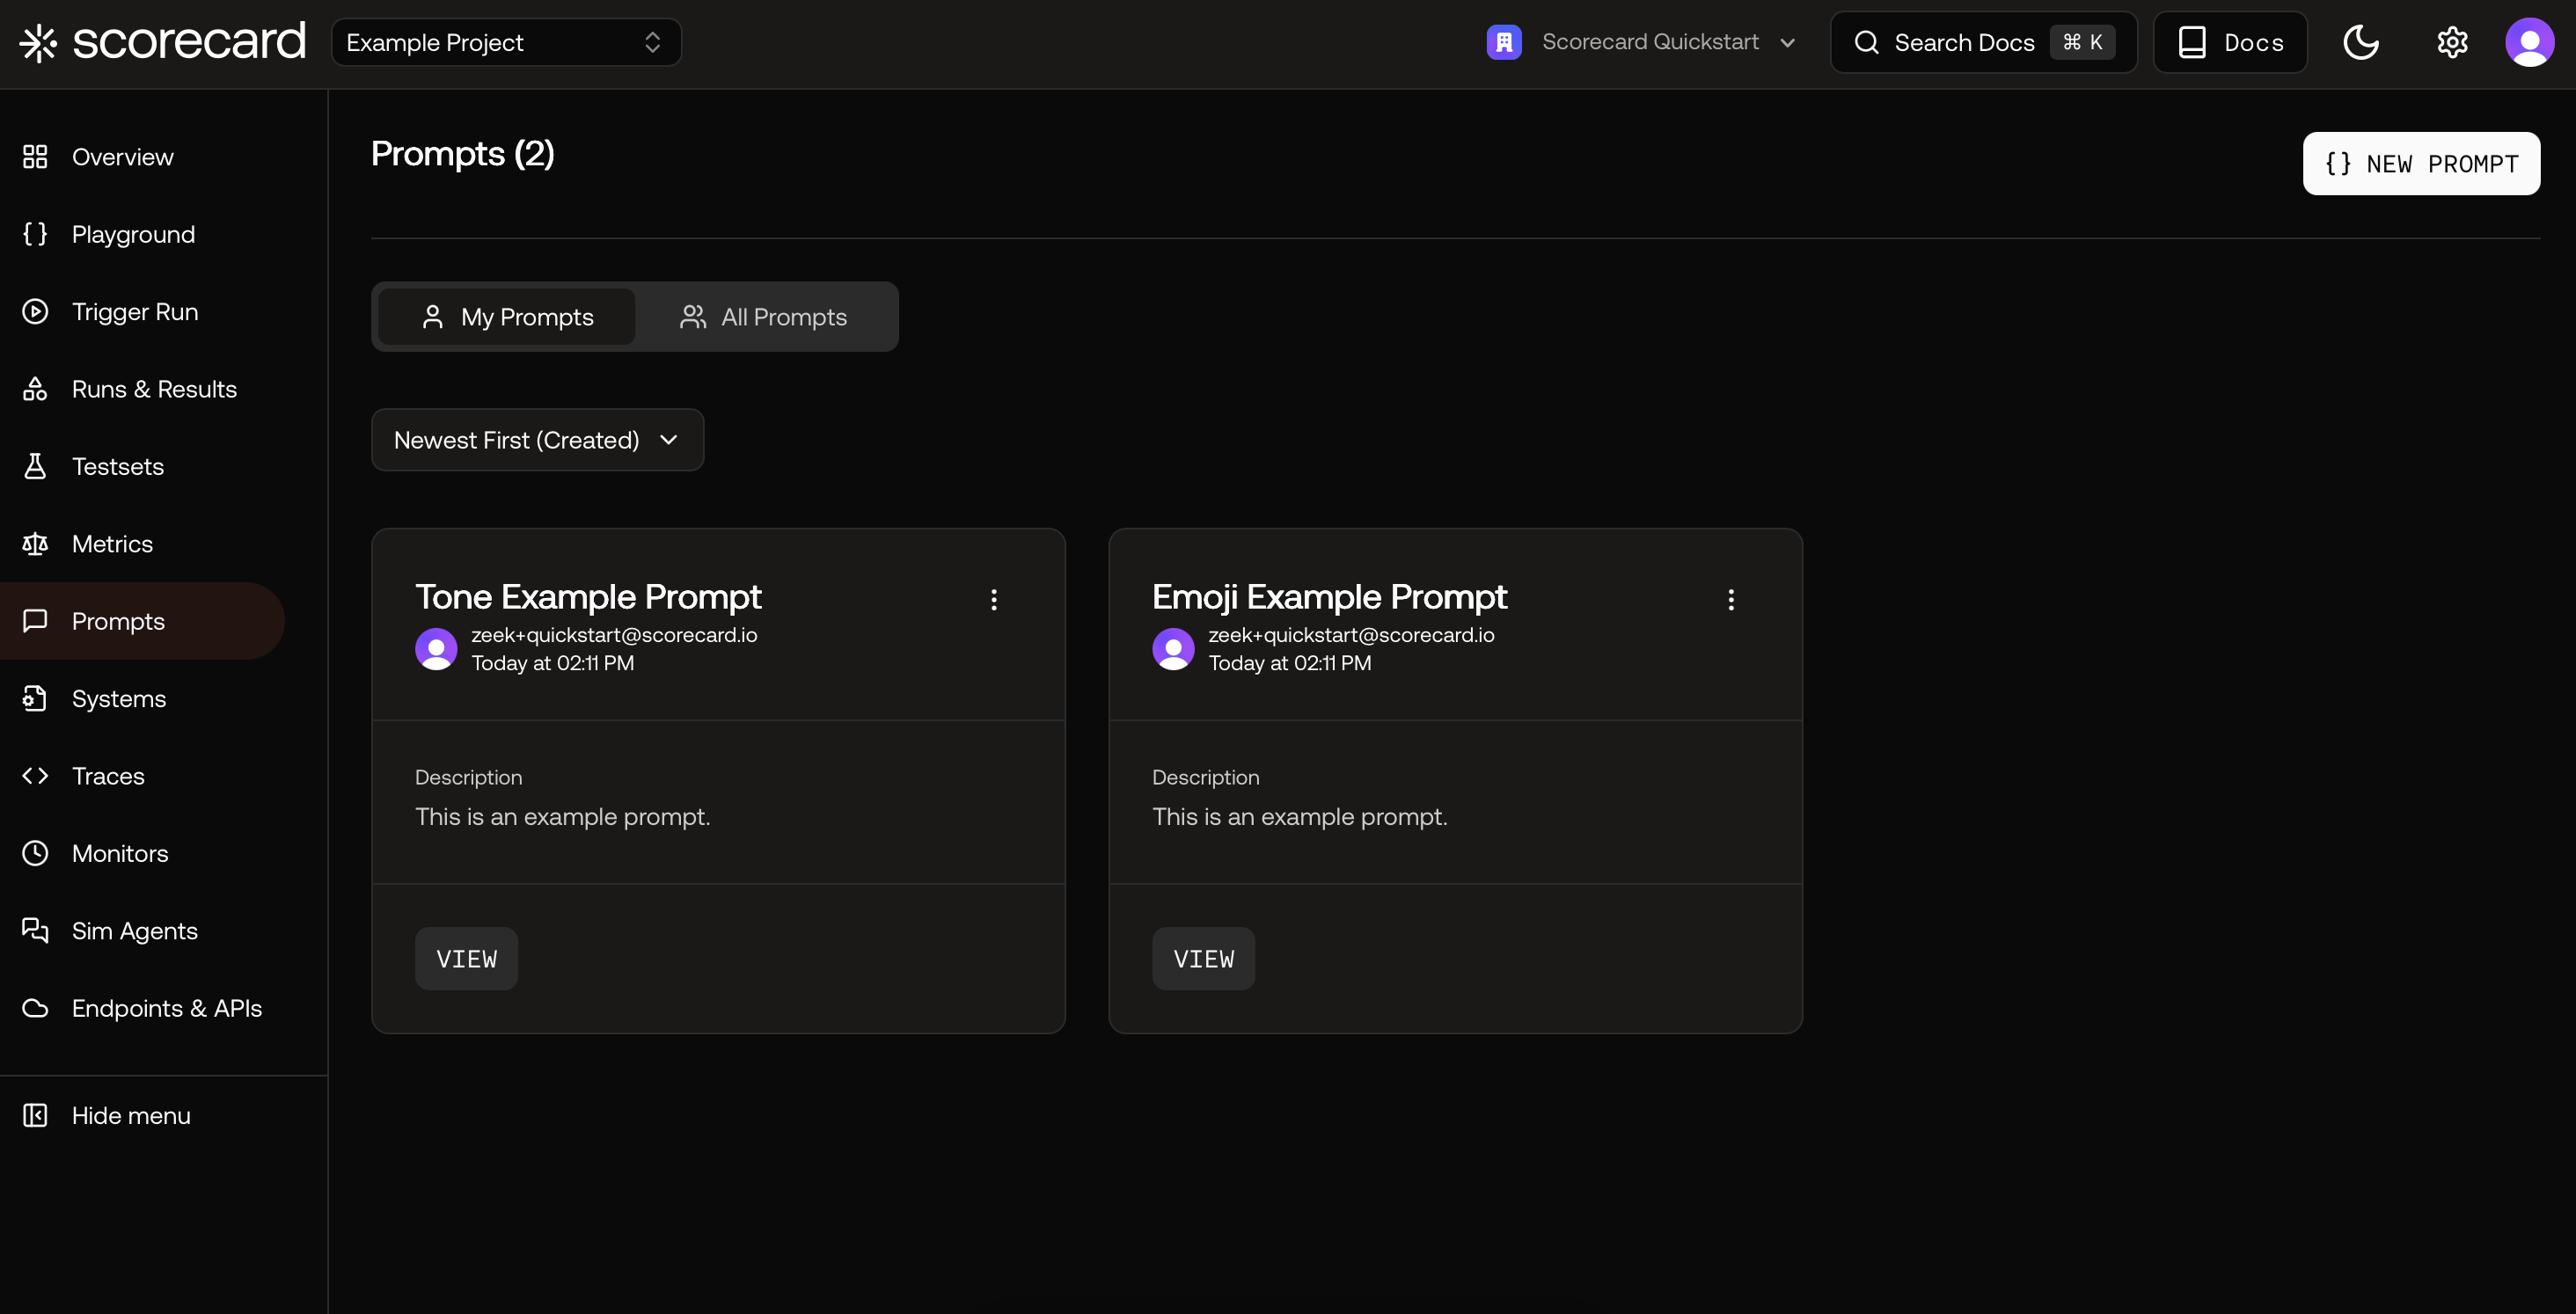
 Next, browse Prompts. Use “View” to open a prompt, review messages, and model settings.
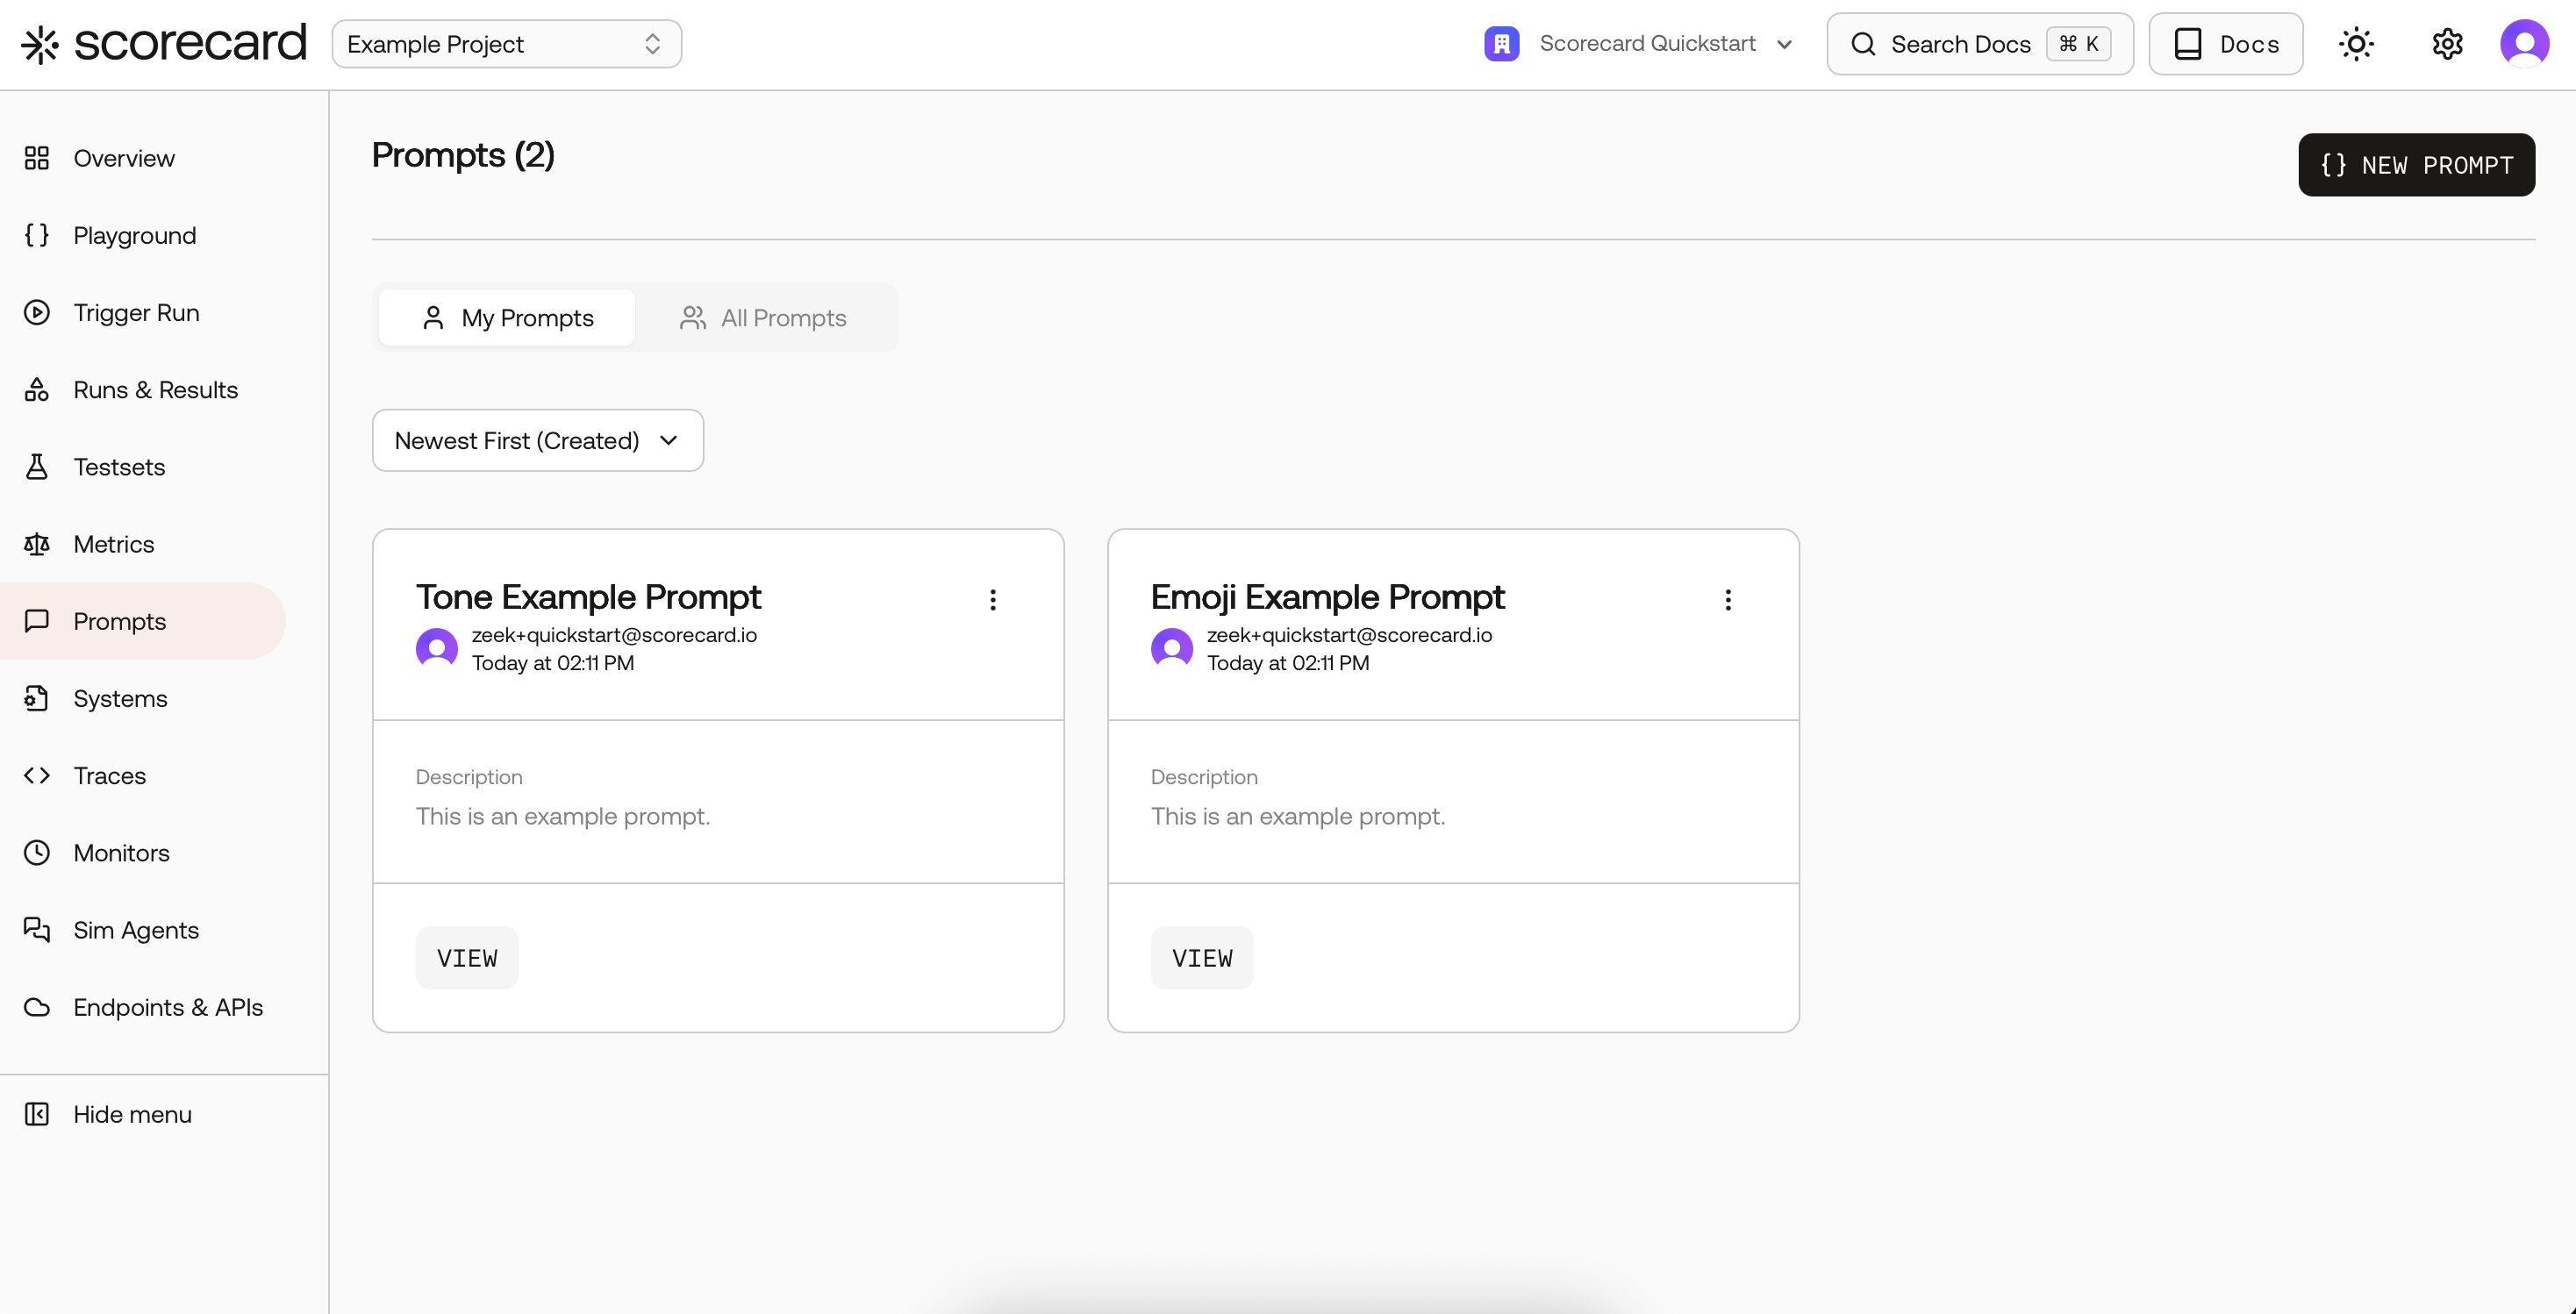
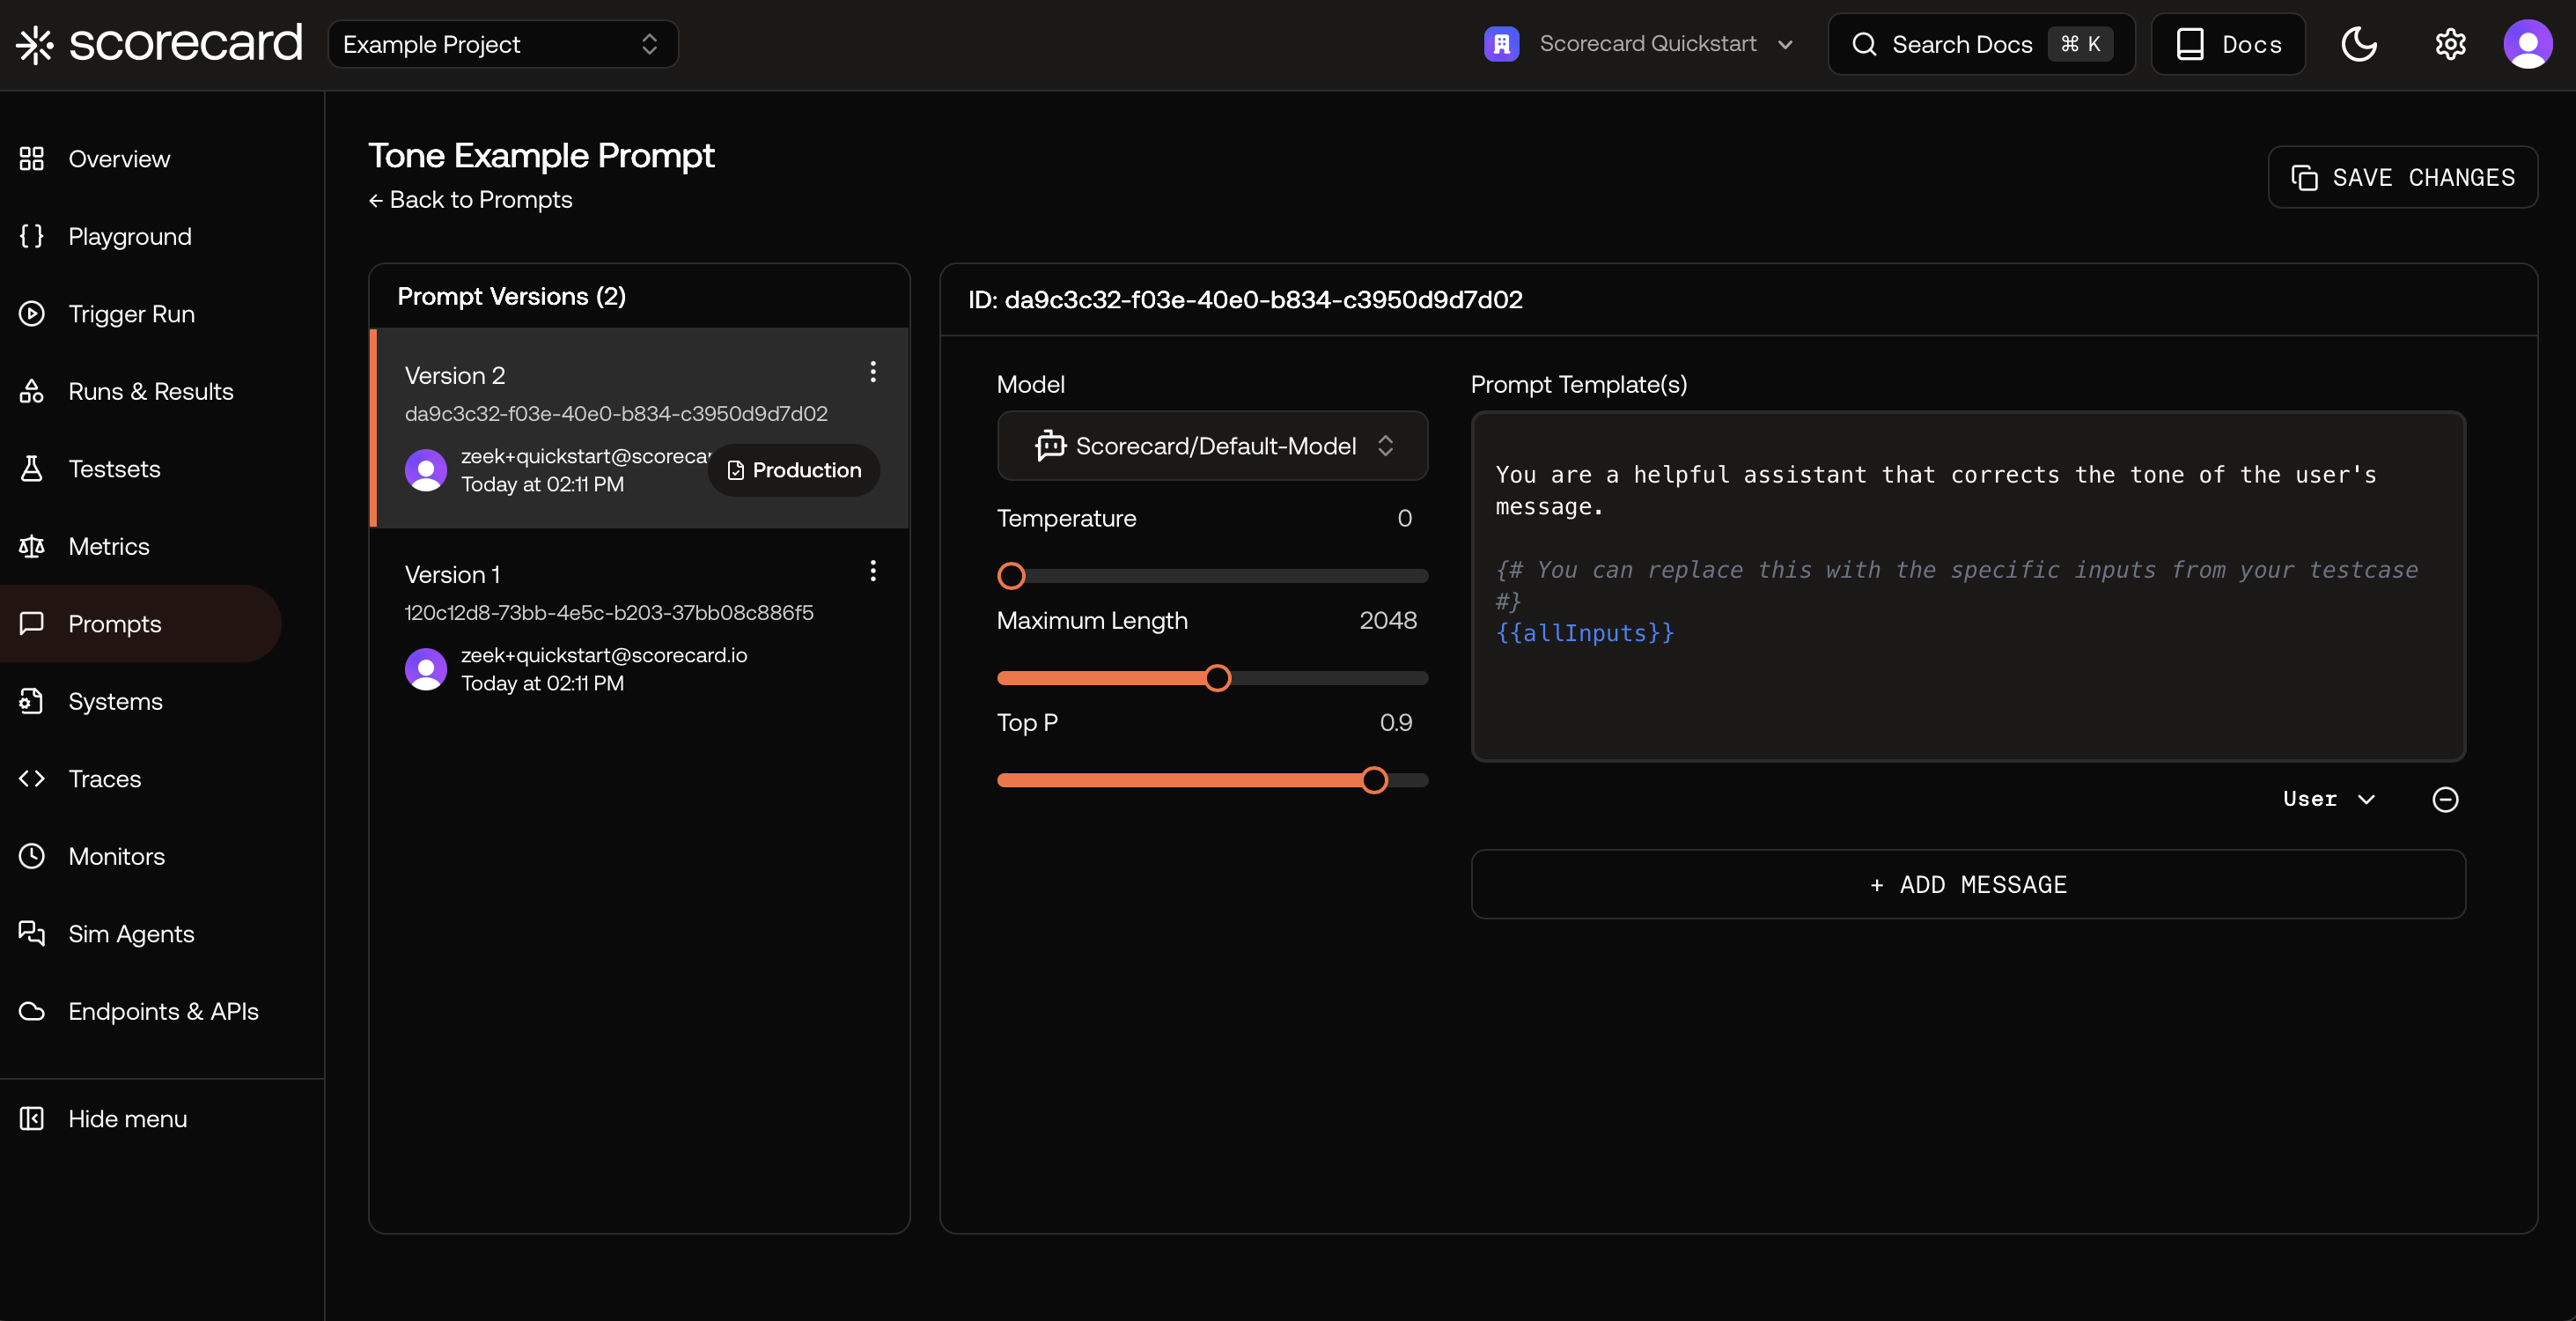
 Inside a prompt version, see the template (Jinja‑style variables) and evaluator model configuration.
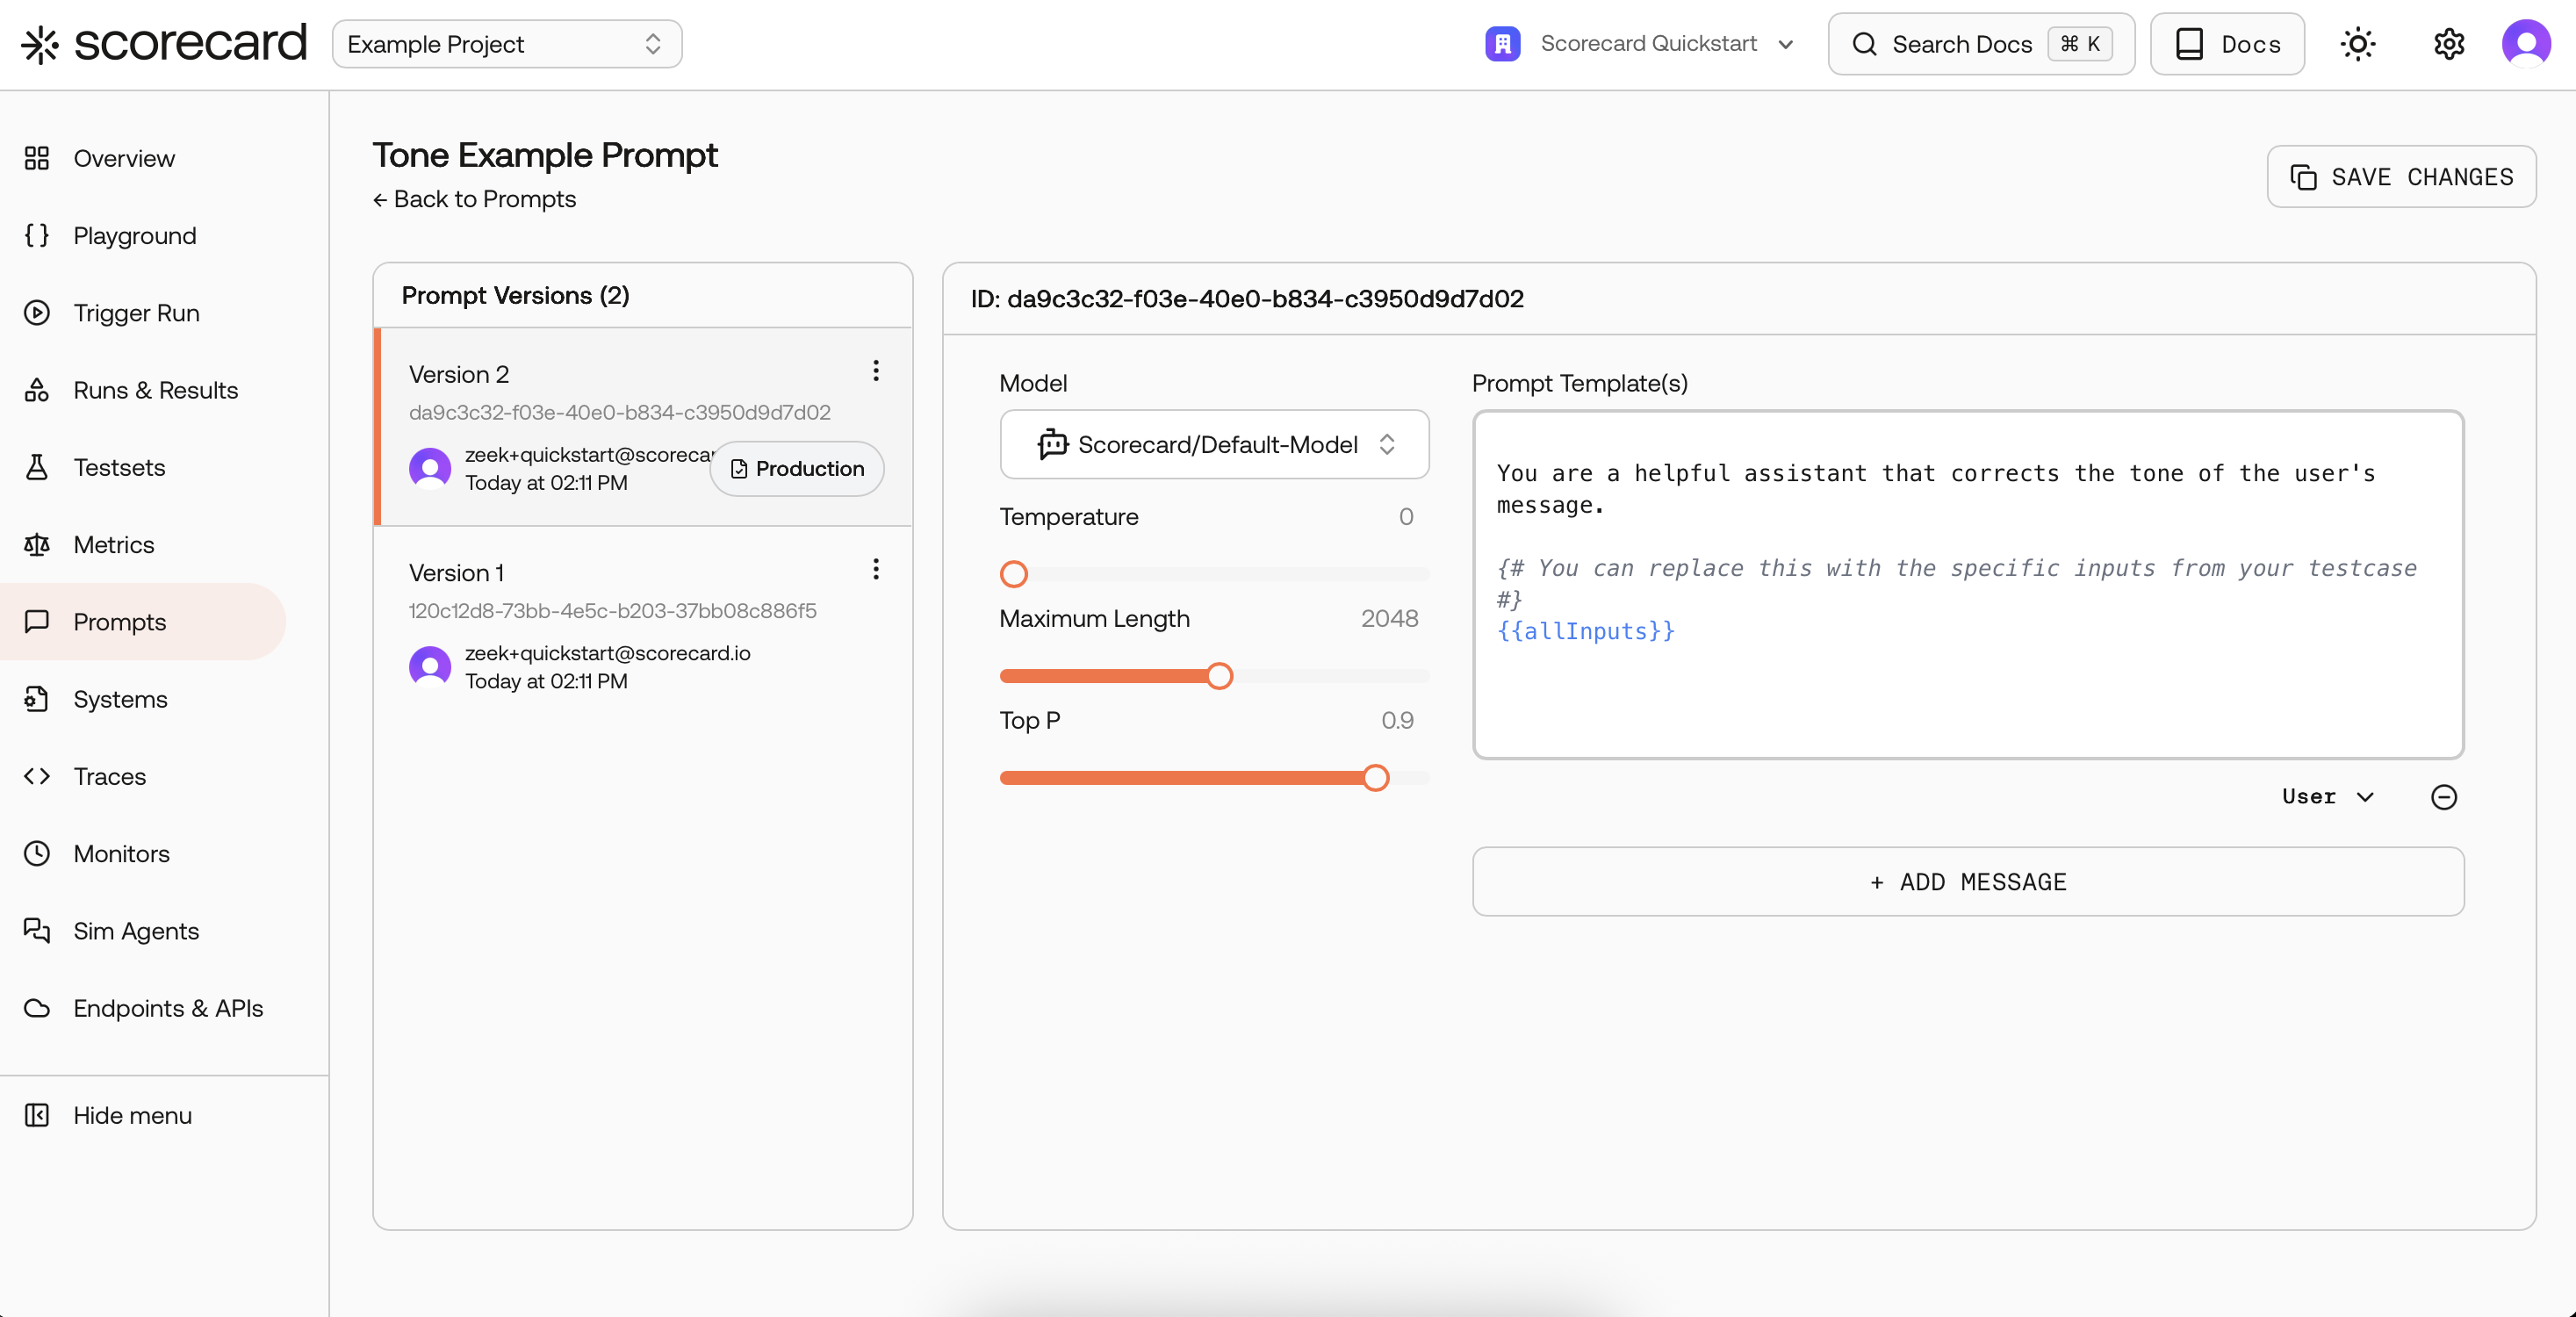
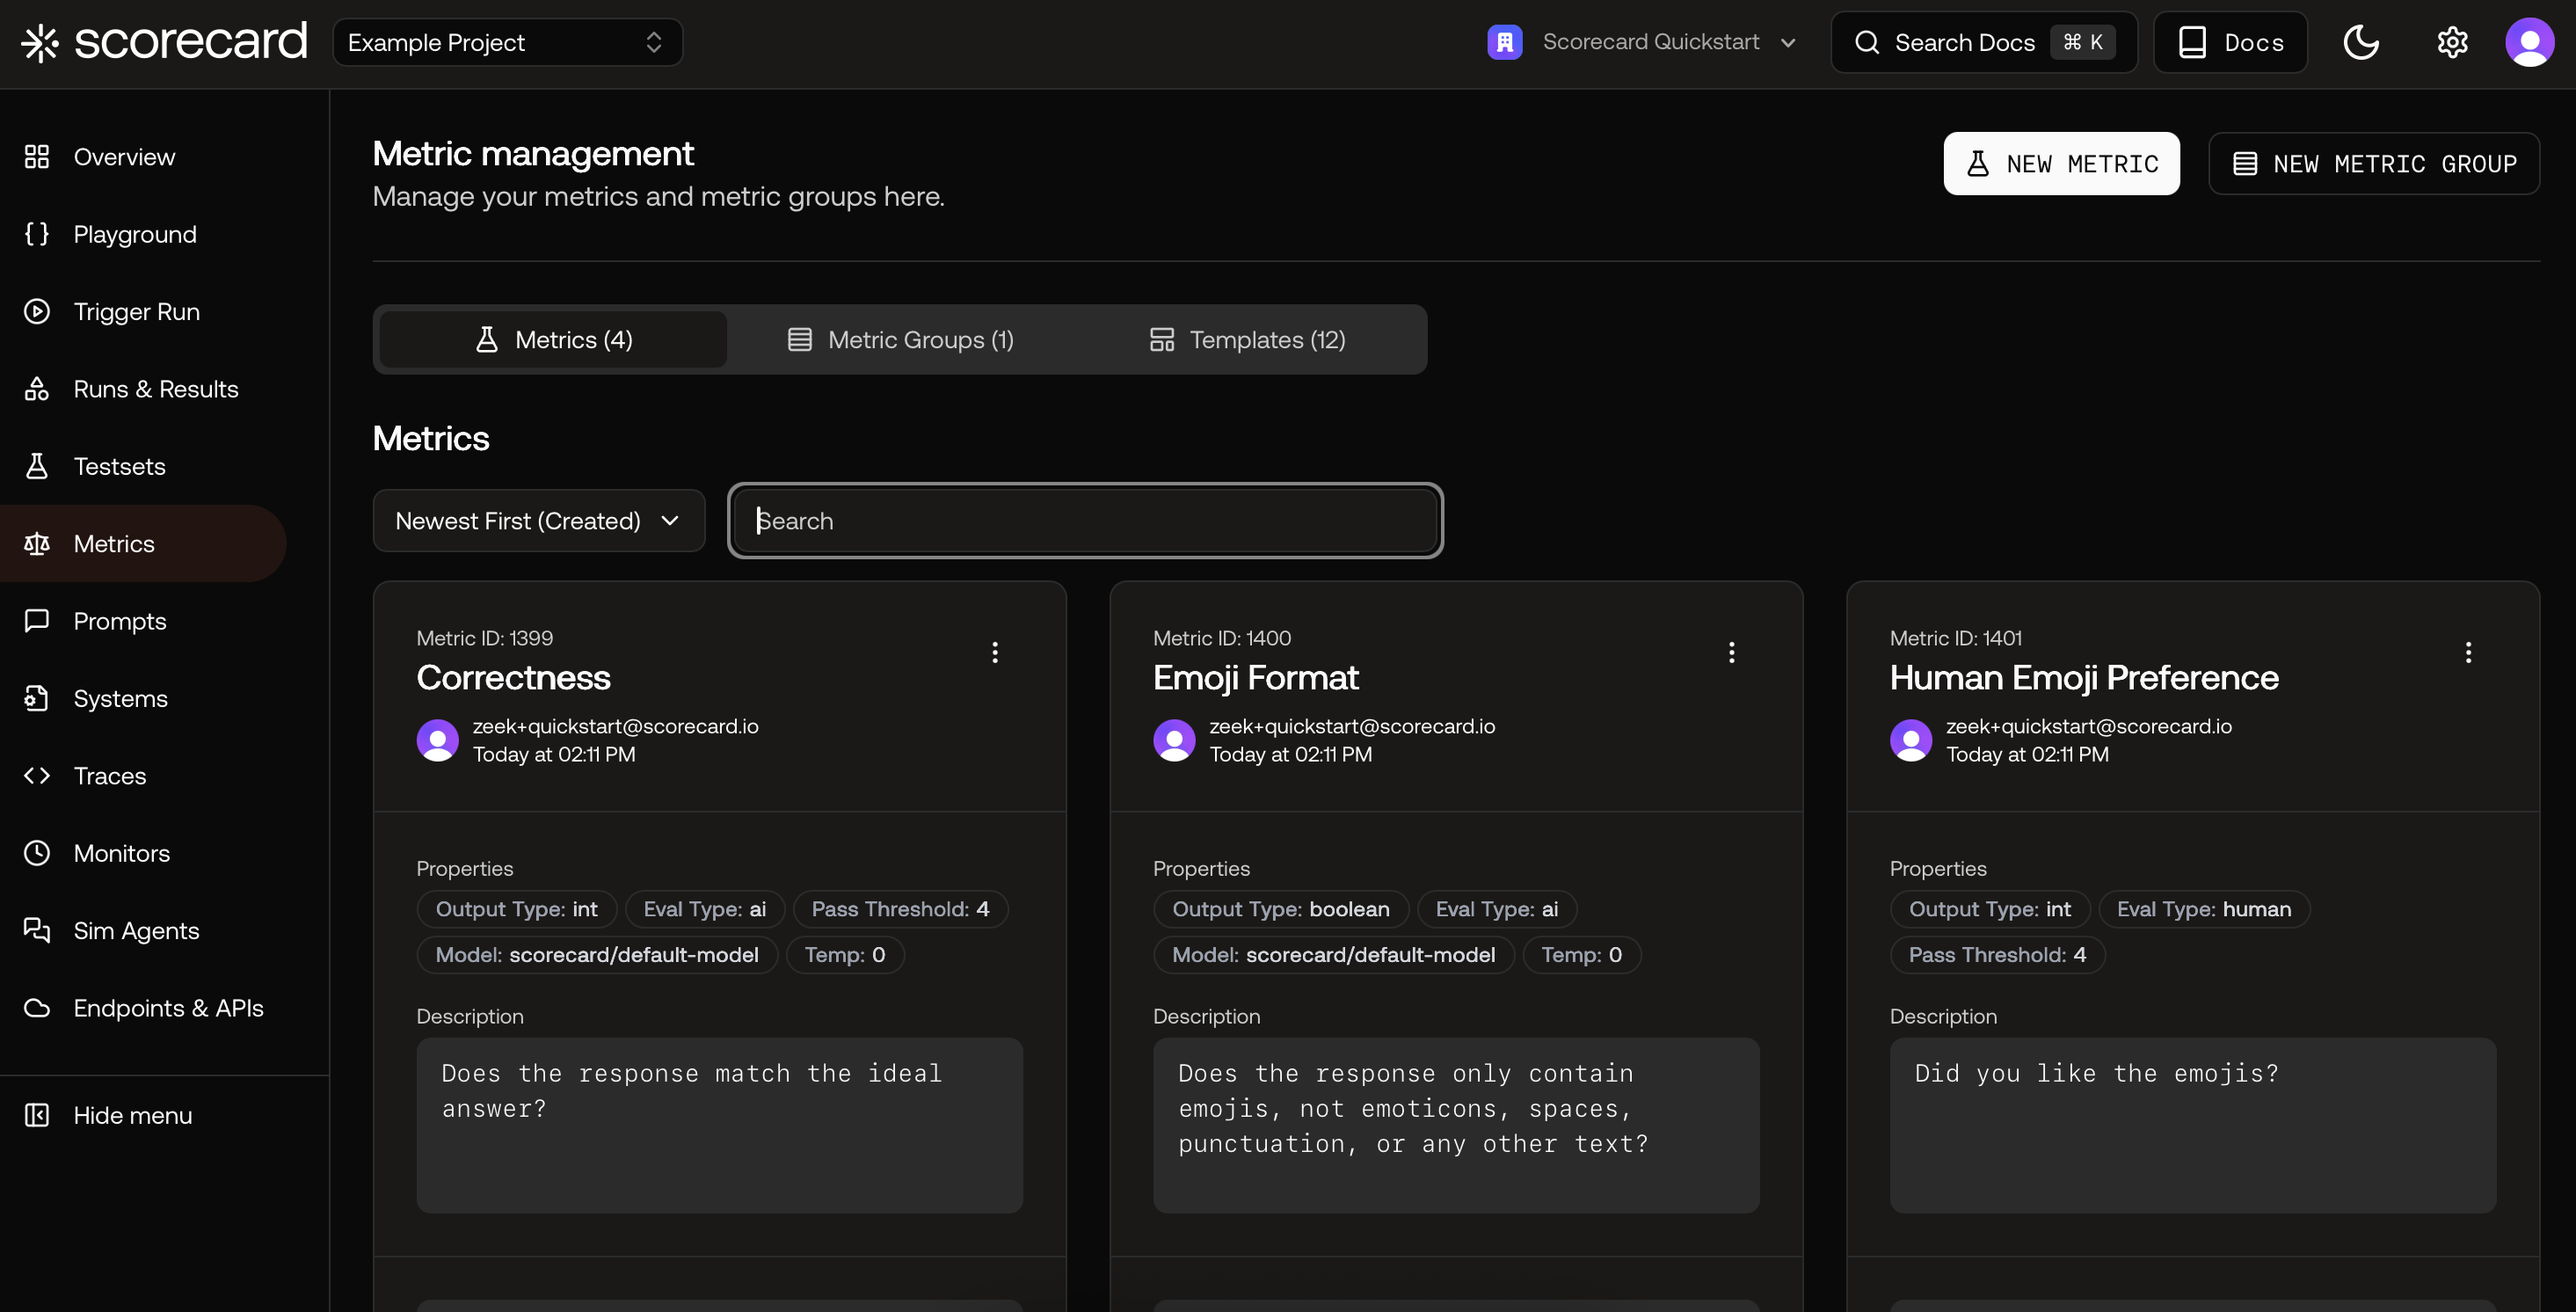
 Finally, explore Metrics to learn how scoring works. Each metric has guidelines, evaluation type, and output type.
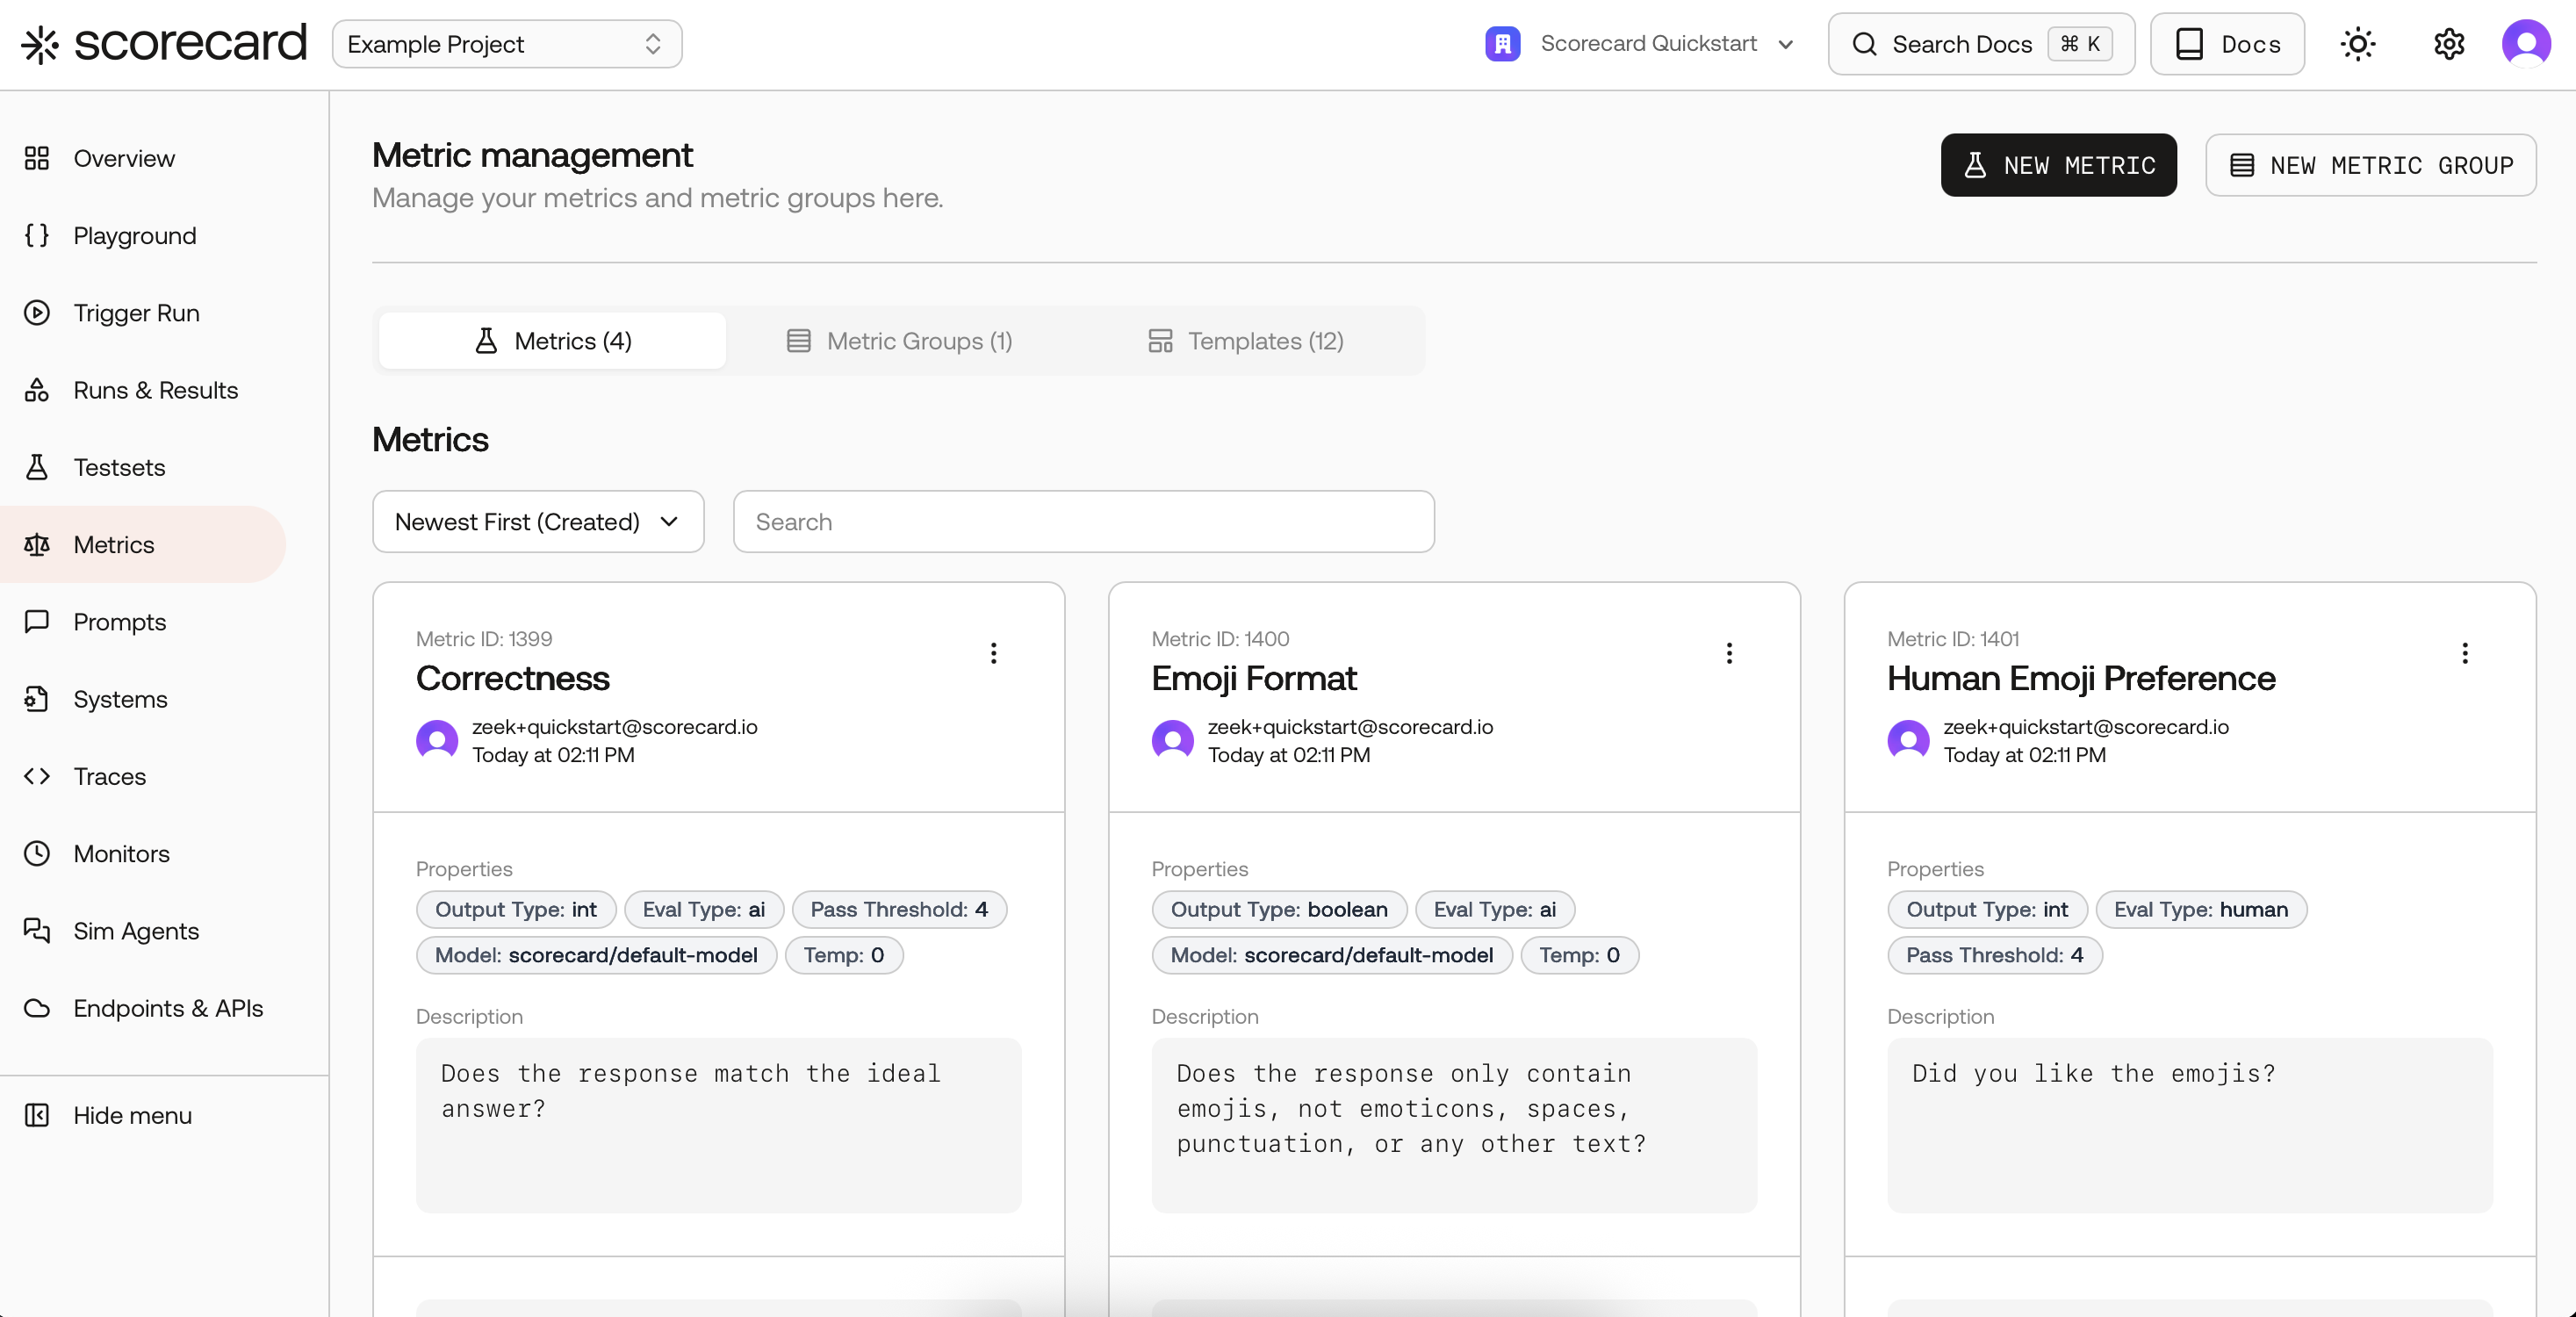
- Emoji Testset: inputs
userQuery→ expectedideal(emojis). - Tone Testset: inputs
original,tone→ expectedidealRewritten. - Prompt versions for Emoji and Tone — already set to Scorecard Cloud with low temperature for consistency.
- Metrics: Correctness (AI, 1–5), Emoji Format (AI, Boolean), Human Emoji Preference (Human, 1–5), Human Tone Check (Human, Boolean).
- Metric Group: Emoji Metrics = Emoji Format + Human Emoji Preference.
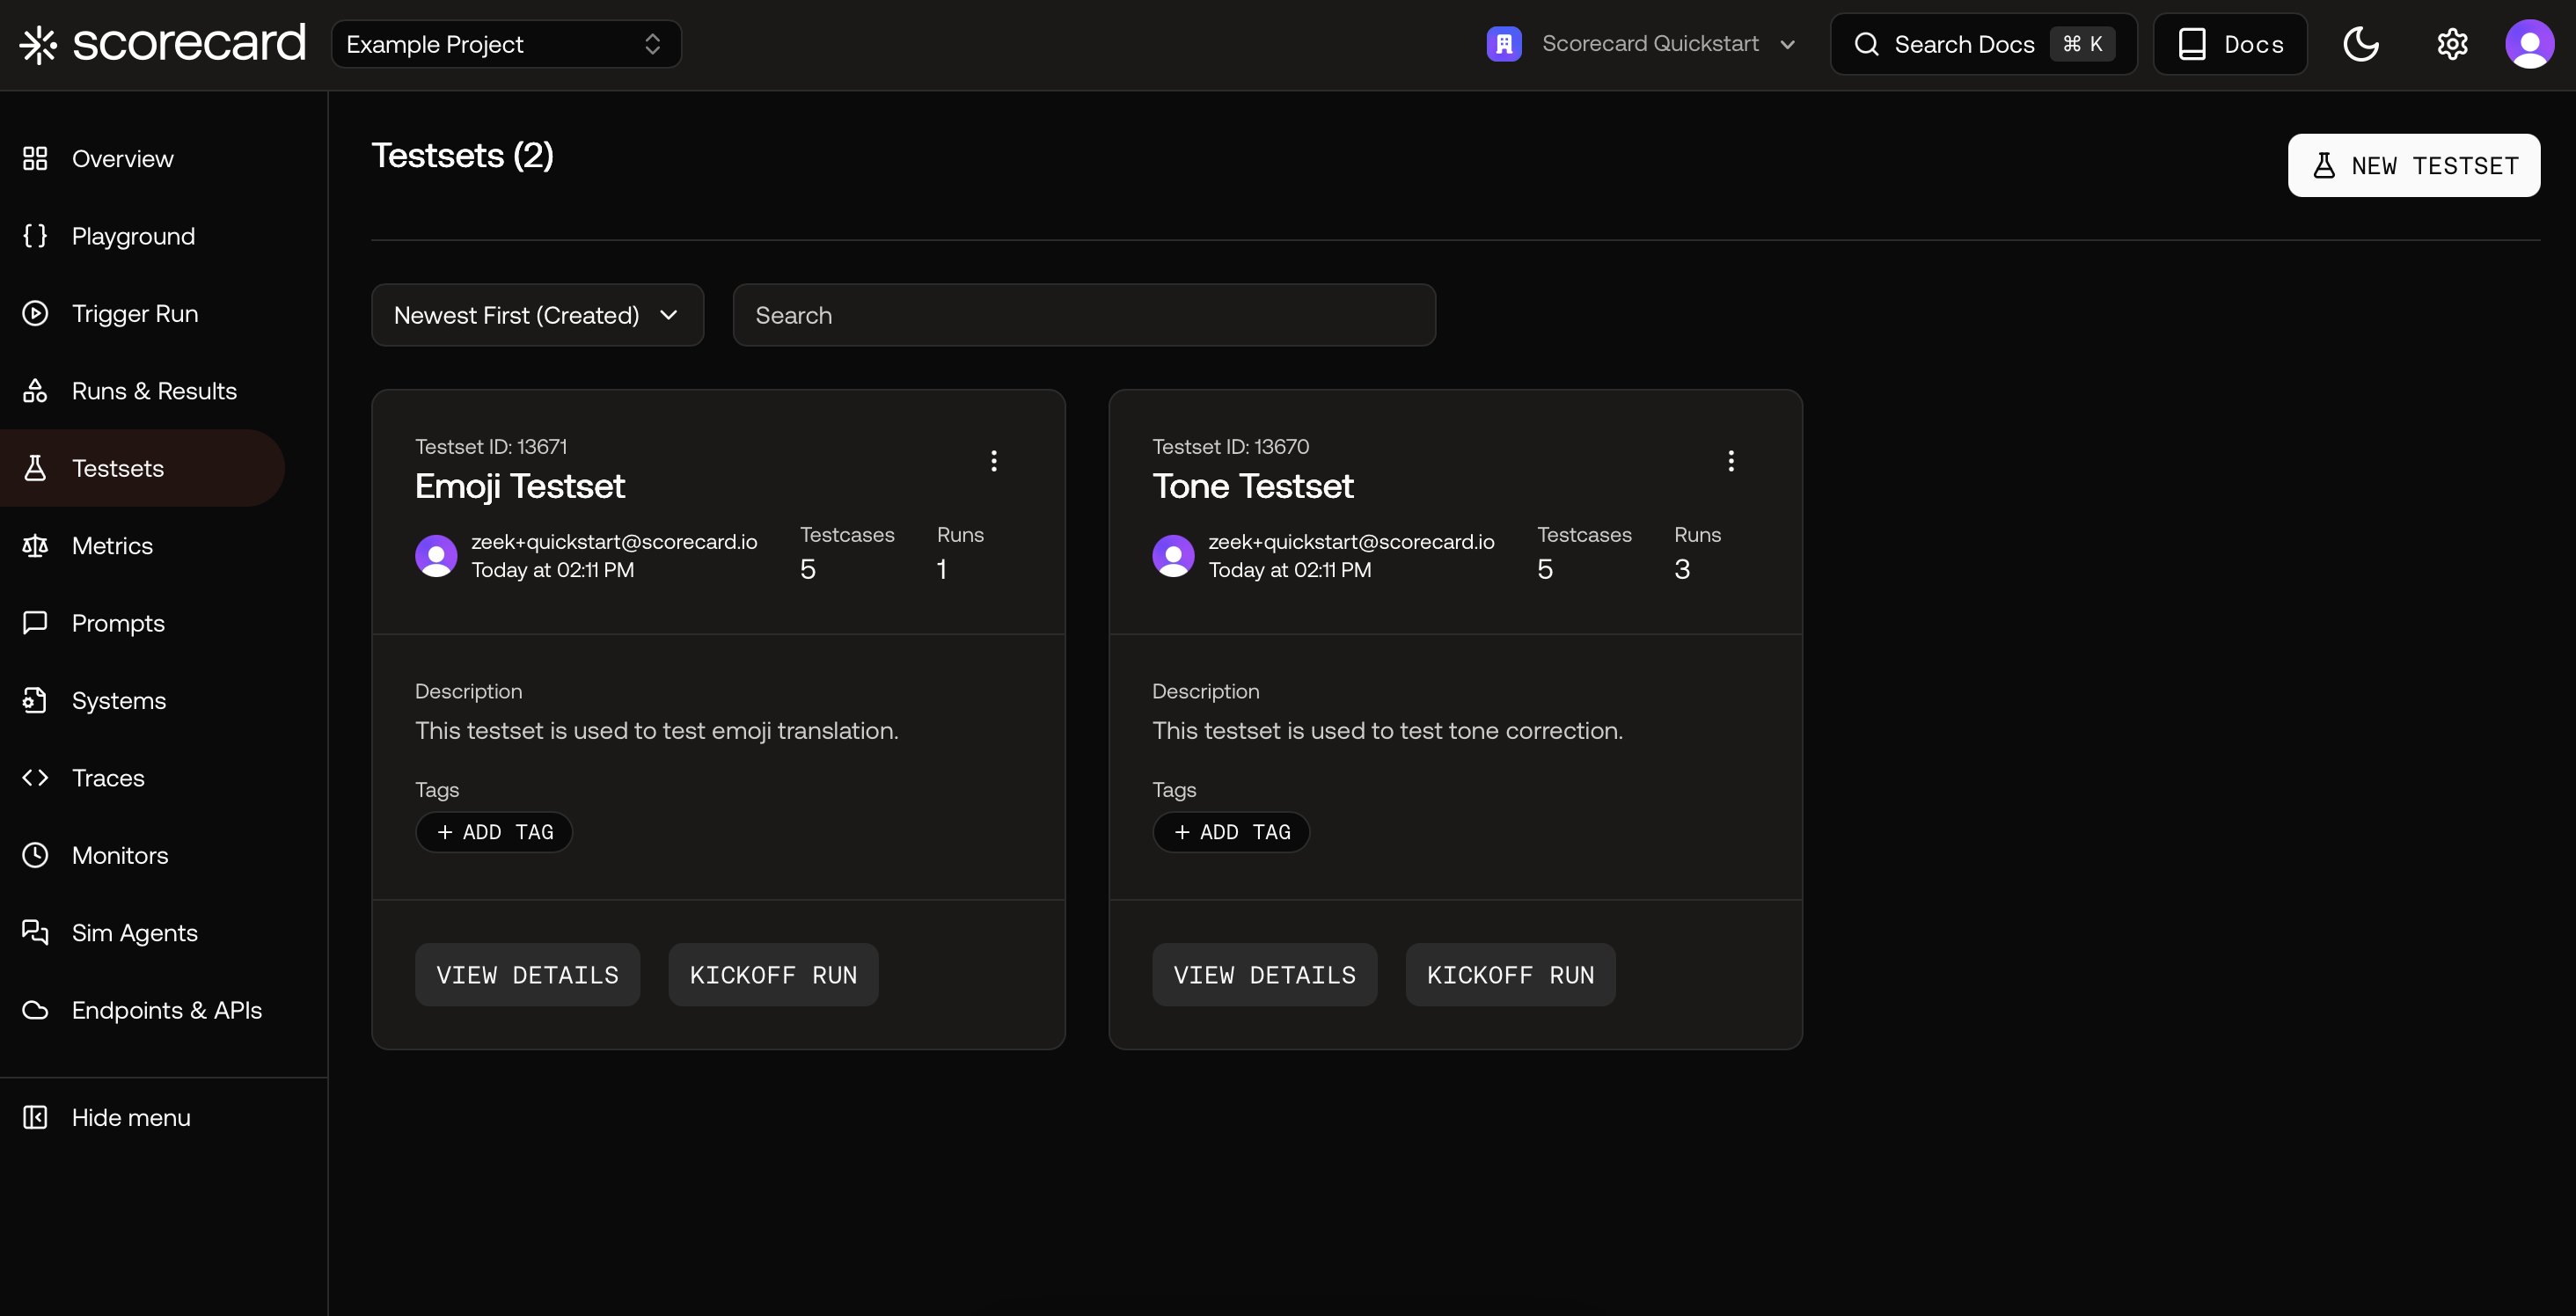
Testsets overview.
A sample Testset with Testcases.
Prompts list.
Prompt version with template and model settings.
Metrics configured for the Example Project.
Where to go next
- Read about creating and managing Testsets in Testsets
- Dive deeper into running evaluations in Runs & Results
- Explore interactive prompt iteration in the Playground
- Define and reuse evaluation criteria with Metrics