Debug performance for web apps
The Flutter framework emits timeline events as it works to build frames, draw scenes, and track other activity such as garbage collections. These events are exposed in the Chrome DevTools performance panel for debugging.
You can also emit your own timeline events using the dart:developer Timeline and TimelineTask APIs for further performance analysis.
Optional flags to enhance tracing
# To configure which timeline events are tracked, set any of the following top-level properties to true in your app's main method.
- debugProfileBuildsEnabled: Adds
Timelineevents for everyWidgetbuilt. - debugProfileBuildsEnabledUserWidgets: Adds
Timelineevents for every user-createdWidgetbuilt. - debugProfileLayoutsEnabled: Adds
Timelineevents for everyRenderObjectlayout. - debugProfilePaintsEnabled: Adds
Timelineevents for everyRenderObjectpainted.
Instructions
#- [Optional] Set any desired tracing flags to true from your app's main method.
- Run your Flutter web app in profile mode.
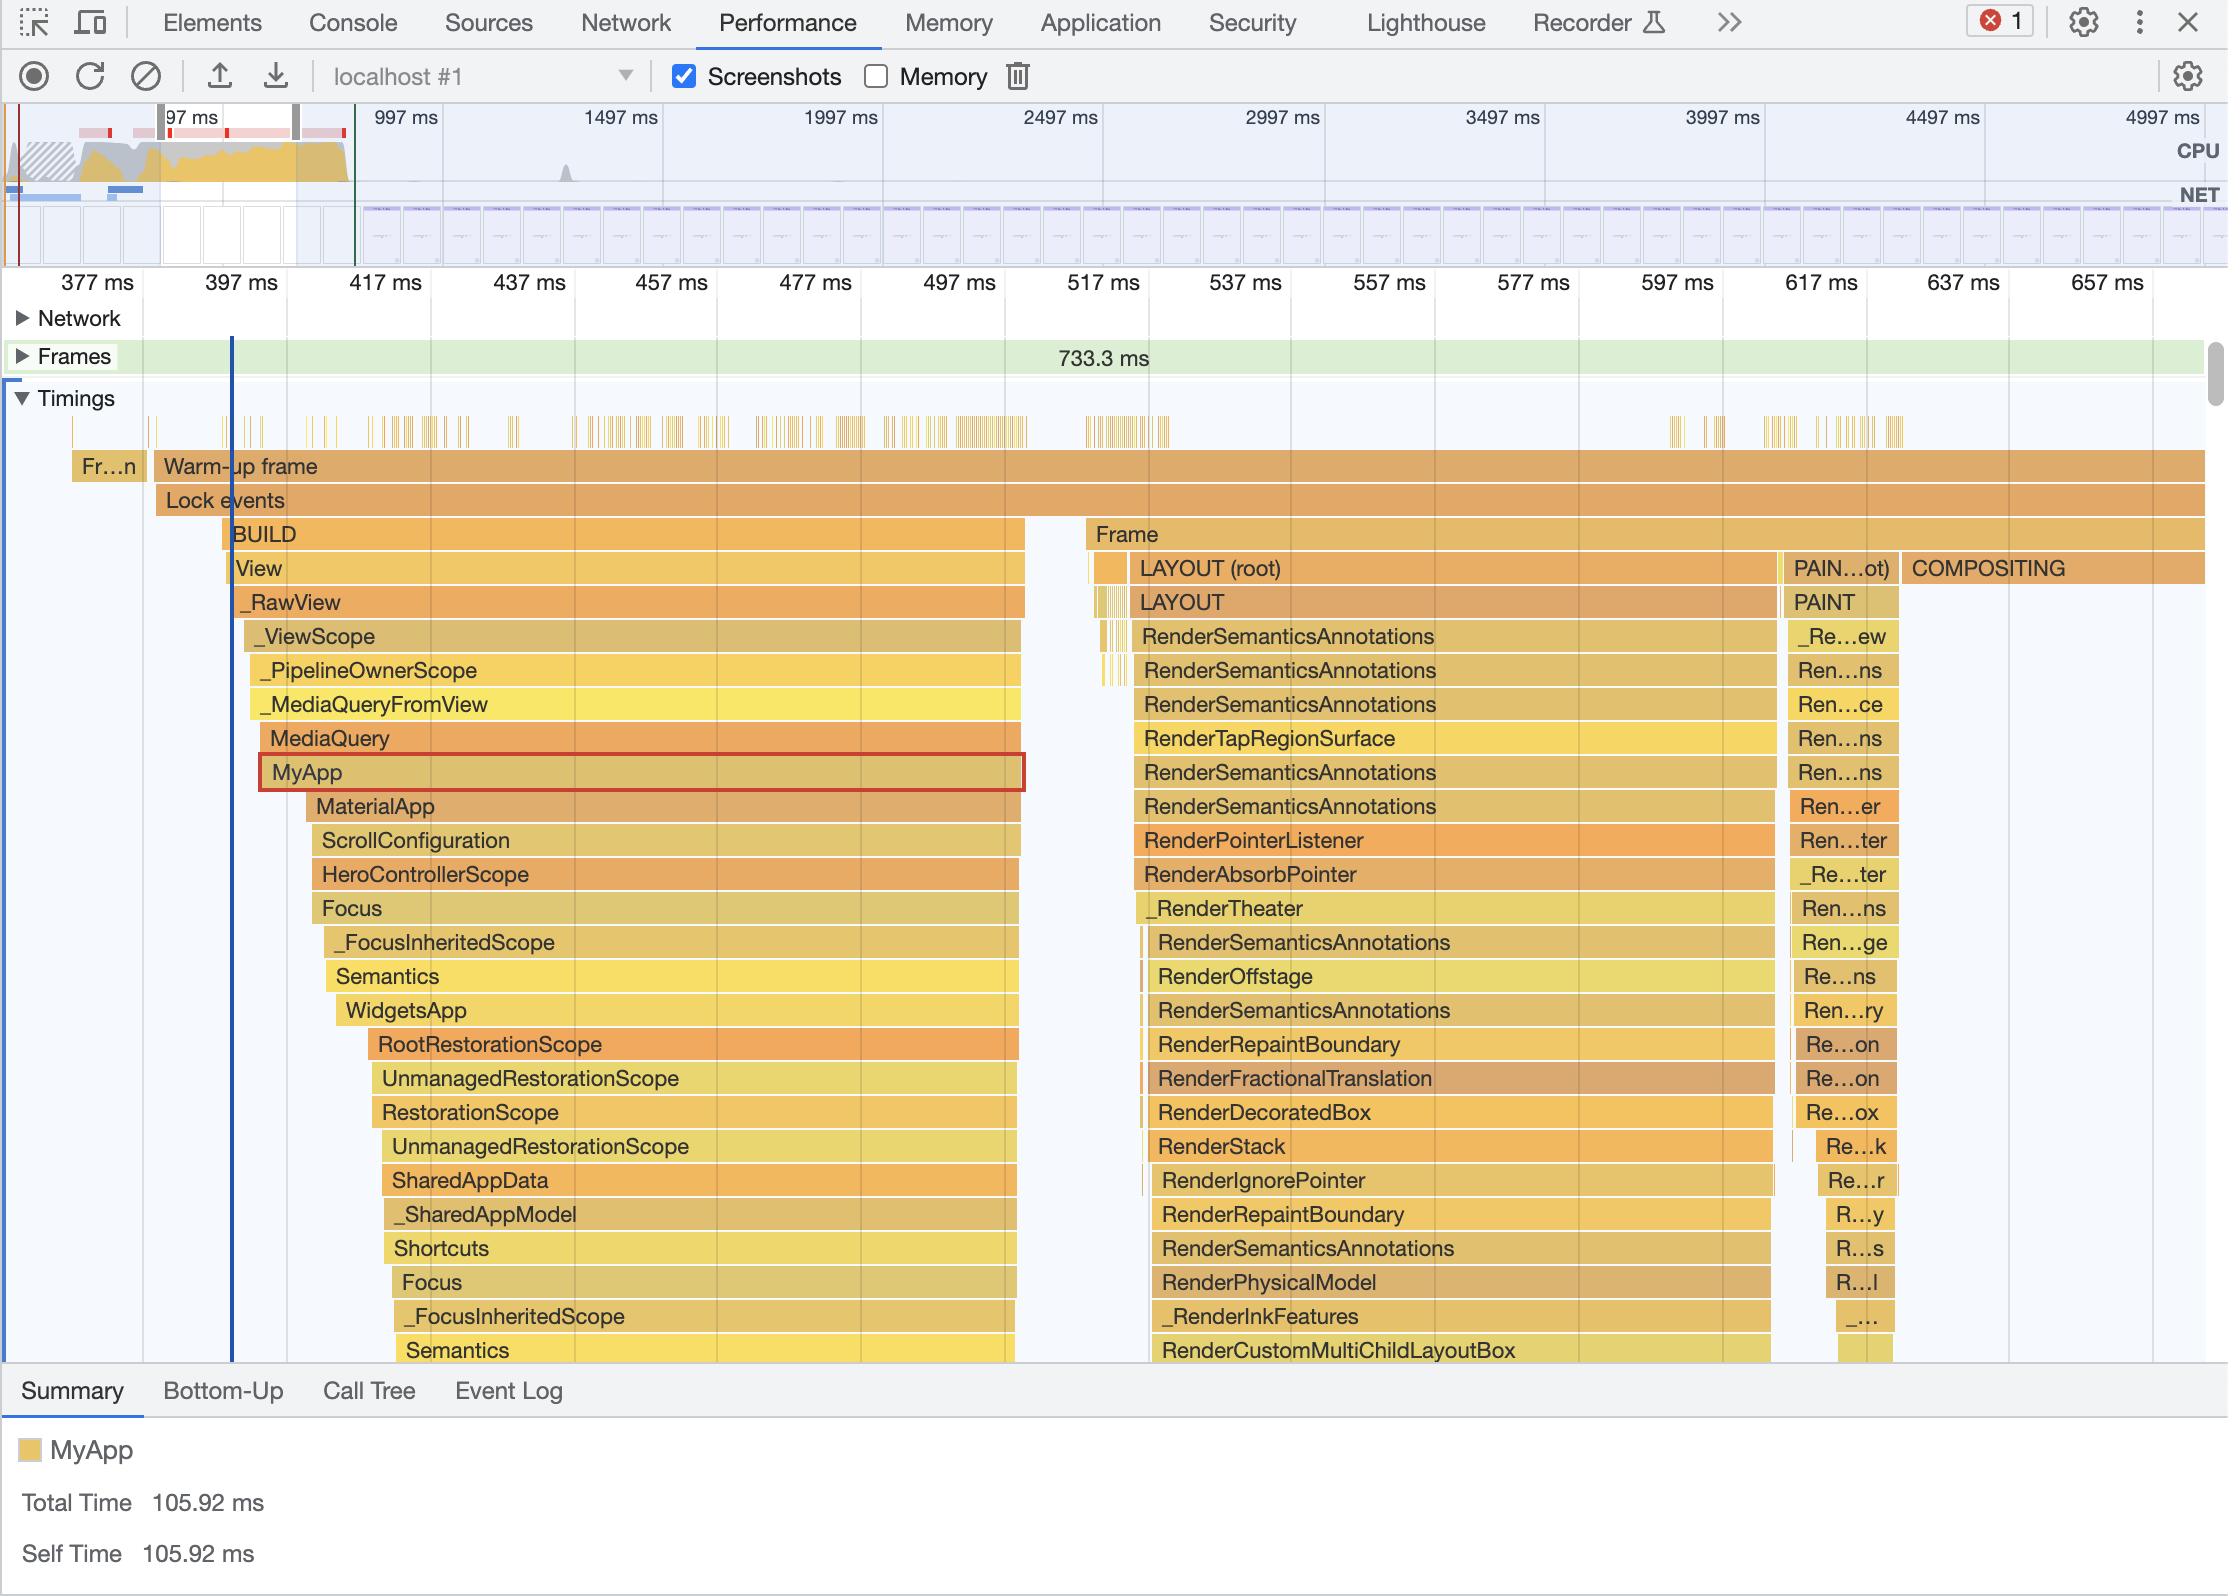
- Open up the Chrome DevTools Performance panel for your application, and start recording to capture timeline events.
Was this page's content helpful?
Unless stated otherwise, the documentation on this site reflects Flutter 3.35.5. Page last updated on 2025-10-30. View source or report an issue.