
 Data Structure
 Networking
 RDBMS
RDBMS Operating System
 Java
Java MS Excel
 iOS
iOS HTML
HTML CSS
CSS Android
 Python
 C Programming
 C++
C++ C#
C# MongoDB
 MySQL
MySQL Javascript
 PHP
PHP
- Selected Reading
- UPSC IAS Exams Notes
- Developer's Best Practices
- Questions and Answers
- Effective Resume Writing
- HR Interview Questions
- Computer Glossary
- Who is Who
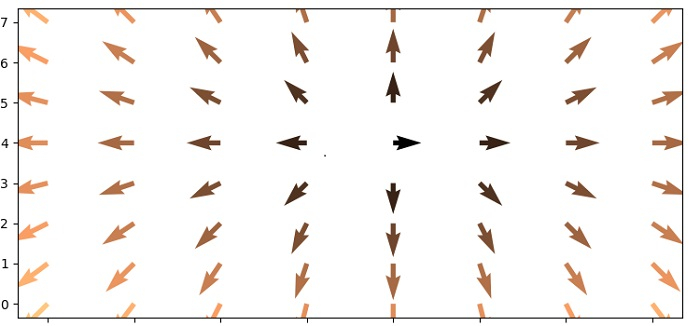
Plot a vector field over the axes in Python Matplotlib?
To plot a vector field over the axes in matplotlib, we can take the following steps −
Set the figure size and adjust the padding between and around the subplots.
Make X, Y, T, R, U and V data points using numpy.
Add an axes to the current figure and make it the current axes.
Plot a 3D field of arrows using quiver() method.
To display the figure, use show() method.
Example
import numpy as np import matplotlib.pyplot as plt plt.rcParams["figure.figsize"] = [7.50, 3.50] plt.rcParams["figure.autolayout"] = True n = 8 X, Y = np.mgrid[0:n, 0:n] T = np.arctan2(Y - n / 2., X - n/2.) R = 10 + np.sqrt((Y - n / 2.0) ** 2 + (X - n / 2.0) ** 2) U, V = R * np.cos(T), R * np.sin(T) plt.axes([0.025, 0.025, 0.95, 0.95]) plt.quiver(X, Y, U, V, R, cmap="copper") plt.show()
Output

Updated on: 2021-06-04T06:31:57+05:30
836 Views

Advertisements