
 Data Structure
 Networking
 RDBMS
RDBMS Operating System
 Java
Java MS Excel
 iOS
iOS HTML
HTML CSS
CSS Android
 Python
 C Programming
 C++
C++ C#
C# MongoDB
 MySQL
MySQL Javascript
 PHP
PHP
- Selected Reading
- UPSC IAS Exams Notes
- Developer's Best Practices
- Questions and Answers
- Effective Resume Writing
- HR Interview Questions
- Computer Glossary
- Who is Who
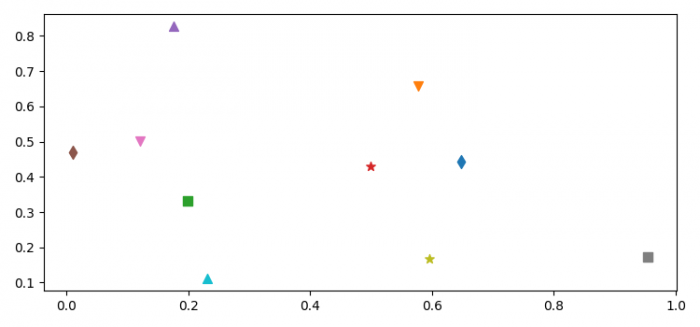
How to use different markers for different points in a Pylab scatter plot(Matplotlib)?
To use different markers for different points in a Pylab (Pyplot) scatter plot, we can use the following steps −
- Set the figure size and adjust the padding between and around the subplots.
- Initialize a variable, N, for number of sample data.
- Create x and y random data points.
- Make a list of markers.
- Zip the x, y and markers.
- Iterate the zipper objects and plot the data points with different markers.
- To display the figure, use show() method.
Example
import numpy as np from matplotlib import pyplot as plt plt.rcParams["figure.figsize"] = [7.50, 3.50] plt.rcParams["figure.autolayout"] = True N = 10 x = np.random.rand(N) y = np.random.rand(N) markers = ["d", "v", "s", "*", "^", "d", "v", "s", "*", "^"] for xp, yp, m in zip(x, y, markers): plt.scatter(xp, yp, marker=m, s=50) plt.show()
Output


Updated on: 2021-08-04T12:45:12+05:30
8K+ Views

Advertisements