
 Data Structure
 Networking
 RDBMS
RDBMS Operating System
 Java
Java MS Excel
 iOS
iOS HTML
HTML CSS
CSS Android
 Python
 C Programming
 C++
C++ C#
C# MongoDB
 MySQL
MySQL Javascript
 PHP
PHP
- Selected Reading
- UPSC IAS Exams Notes
- Developer's Best Practices
- Questions and Answers
- Effective Resume Writing
- HR Interview Questions
- Computer Glossary
- Who is Who
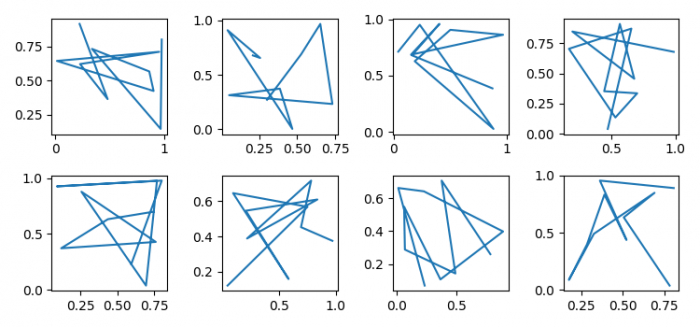
How to unset 'sharex' or 'sharey' from two axes in Matplotlib?
To inset sharex and sharey from two axes in matplotlib, we can use 'none', i.e., False or 'none'. Each subplot X- or Y-axis will be independent.
Steps
Set the figure size and adjust the padding between and around the subplots.
Initialize two variables rows and cols.
Create a figure and a set of subplots.
Iterate the axes where rows=2 and cols=4.
Plot the random data on the axis.
To display the figure, use show() method.
Example
import matplotlib.pyplot as plt import numpy as np plt.rcParams["figure.figsize"] = [7.50, 3.50] plt.rcParams["figure.autolayout"] = True rows = 2 cols = 4 fig, axes = plt.subplots(rows, cols, sharex='none', sharey='none', squeeze=False) for row in range(rows): for col in range(cols): axes[row][col].plot(np.random.rand(10), np.random.rand(10)) plt.show()
Output
It will produce the following output −

Updated on: 2022-02-02T11:13:03+05:30
830 Views

Advertisements