
 Data Structure
 Networking
 RDBMS
RDBMS Operating System
 Java
Java MS Excel
 iOS
iOS HTML
HTML CSS
CSS Android
 Python
 C Programming
 C++
C++ C#
C# MongoDB
 MySQL
MySQL Javascript
 PHP
PHP
- Selected Reading
- UPSC IAS Exams Notes
- Developer's Best Practices
- Questions and Answers
- Effective Resume Writing
- HR Interview Questions
- Computer Glossary
- Who is Who
How to show (0,0) on matplotlib graph at the bottom left corner?
To show (0,0) on matplotlib graph at the bottom left corner, we can use xlim() and ylim() methods.
Steps
Set the figure size and adjust the padding between and around the subplots.
Make lists of data points for x and y.
Plotx and y data points.
Setx and y axes scale.
To display the figure, use Show() method.
Example
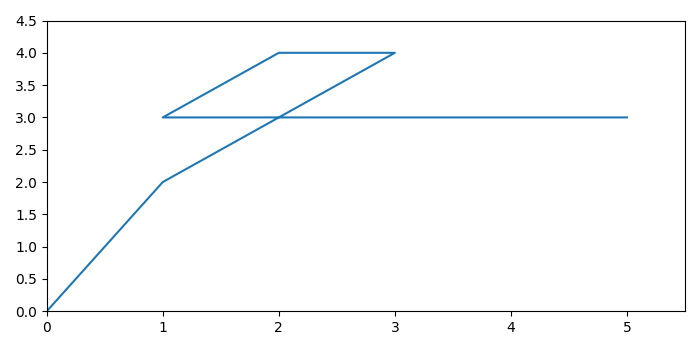
import numpy as np import matplotlib.pyplot as plt plt.rcParams["figure.figsize"] = [7.00, 3.50] plt.rcParams["figure.autolayout"] = True x = np.array([0, 1, 3, 2, 1, 5]) y = np.array([0, 2, 4, 4, 3, 3]) plt.plot(x, y) plt.xlim([0, max(x)+0.5]) plt.ylim([0, max(y)+0.5]) plt.show()
Output
It will produce the following output −

Updated on: 2021-10-08T12:39:24+05:30
13K+ Views

Advertisements