
 Data Structure
 Networking
 RDBMS
RDBMS Operating System
 Java
Java MS Excel
 iOS
iOS HTML
HTML CSS
CSS Android
 Python
 C Programming
 C++
C++ C#
C# MongoDB
 MySQL
MySQL Javascript
 PHP
PHP
- Selected Reading
- UPSC IAS Exams Notes
- Developer's Best Practices
- Questions and Answers
- Effective Resume Writing
- HR Interview Questions
- Computer Glossary
- Who is Who
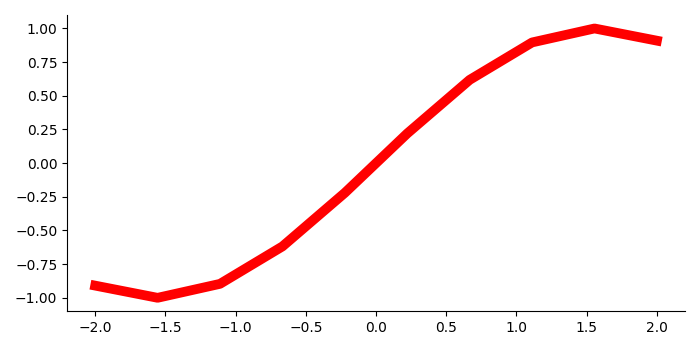
How to display only a left and bottom box border in Matplotlib?
To display or hide box border in matplotlib, we can use spines (value could be right, left, top or bottom) and set_visible() method to set the visibility to True or False.
Steps
Create x and y data points using numpy.
Create a figure and add a set of subplots using subplots() method.
Plot x and y data points using plot() method, where linewidth=7 and color=red.
Set visibility as True for left and bottom, and False for top and right.
To display the figure, use show() method.
Example
import numpy as np from matplotlib import pyplot as plt plt.rcParams["figure.figsize"] = [7.00, 3.50] plt.rcParams["figure.autolayout"] = True x = np.linspace(-2, 2, 10) y = np.sin(x) fg, ax = plt.subplots() ax.plot(x, y, lw=7, c='red') ax.spines['right'].set_visible(False) ax.spines['top'].set_visible(False) ax.spines['left'].set_visible(True) ax.spines['bottom'].set_visible(True) plt.show()
Output

Updated on: 2021-05-08T09:30:52+05:30
4K+ Views

Advertisements