
 Data Structure
 Networking
 RDBMS
RDBMS Operating System
 Java
Java MS Excel
 iOS
iOS HTML
HTML CSS
CSS Android
 Python
 C Programming
 C++
C++ C#
C# MongoDB
 MySQL
MySQL Javascript
 PHP
PHP
- Selected Reading
- UPSC IAS Exams Notes
- Developer's Best Practices
- Questions and Answers
- Effective Resume Writing
- HR Interview Questions
- Computer Glossary
- Who is Who
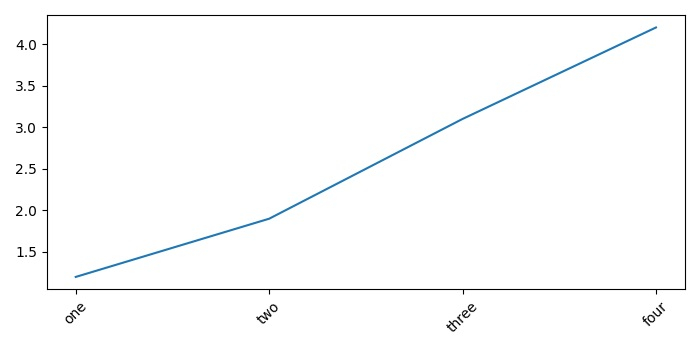
How to set "step" on axis X in my figure in Matplotlib Python 2.6.6?
To set Step on X-axis in a figure in Matplotlib Python, we can take the following Steps −
Steps
- Create a list of data points, x.
- Add a subplot to the current figure using subplot() method.
- Set xticks and ticklabels with rotation=45.
- To display the figure, use show() method.
Example
import matplotlib.pyplot as plt plt.rcParams["figure.figsize"] = [7.00, 3.50] plt.rcParams["figure.autolayout"] = True x = [1, 2, 3, 4] y = [1.2, 1.9, 3.1, 4.2] plt.plot(x,y) ax1 = plt.subplot() ax1.set_xticks(x) ax1.set_xticklabels(["one", "two", "three", "four"], rotation=45) plt.show()
Output

Updated on: 2021-05-15T12:24:35+05:30
2K+ Views

Advertisements