
 Data Structure
 Networking
 RDBMS
RDBMS Operating System
 Java
Java MS Excel
 iOS
iOS HTML
HTML CSS
CSS Android
 Python
 C Programming
 C++
C++ C#
C# MongoDB
 MySQL
MySQL Javascript
 PHP
PHP
- Selected Reading
- UPSC IAS Exams Notes
- Developer's Best Practices
- Questions and Answers
- Effective Resume Writing
- HR Interview Questions
- Computer Glossary
- Who is Who
How to put the plot title inside the plot using ggplot2 in R?
Generally, we put the plot title on top side of the plot but we can put it inside the plot as well. Of course, this will change the display of the chart but it will also get attraction of viewers. To do this, we can use the theme function of ggplot2 package where margin argument for plot title will change the position of the title.
Consider the below data frame −
Example
x<-rnorm(20) y<-rnorm(20) df<-data.frame(x,y) df
Output
x y 1 -0.30662899 -0.37957405 2 -0.82615057 -1.26477881 3 -0.11692952 0.01427444 4 -0.34331938 2.03706444 5 -1.49544241 0.35632086 6 -0.07656434 -1.68049294 7 -0.05300648 -0.24720322 8 1.24363223 0.84503405 9 -0.05653599 -1.18044286 10 -0.04502879 0.43735809 11 0.04637793 0.47158401 12 -0.52382139 -1.02630948 13 1.60555319 0.64673159 14 1.80033105 -1.79870479 15 -0.10558775 -0.02166056 16 -0.68224275 0.61533007 17 -1.79128676 -0.45239927 18 0.34083402 -0.95344404 19 -0.39968860 -0.20690004 20 -0.53267410 2.17089520
Loading ggplot2 package and creating a scatterplot between x and y −
Example
library(ggplot2) ggplot(df,aes(x,y))+geom_point()+ggtitle("Scatterplot") Output
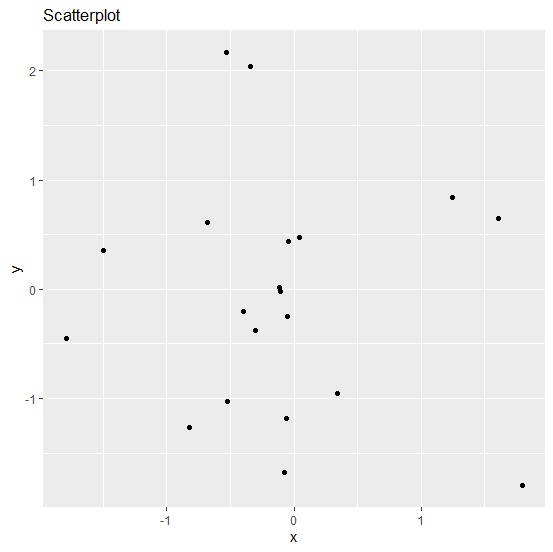
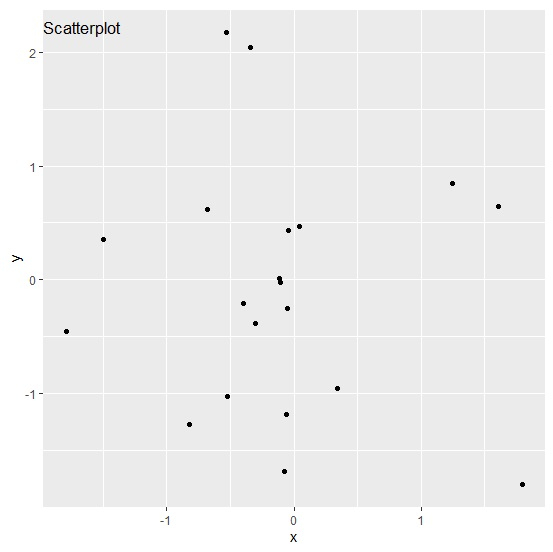
Creating the scatterplot between x and y with plot title inside the plot area −
Example
ggplot(df,aes(x,y))+geom_point()+ggtitle("Scatterplot")+theme(plot.title=element_text(margin=margin(t=10,b=-20))) Output

Updated on: 2021-02-06T09:08:10+05:30
872 Views

Advertisements