
 Data Structure
 Networking
 RDBMS
RDBMS Operating System
 Java
Java MS Excel
 iOS
iOS HTML
HTML CSS
CSS Android
 Python
 C Programming
 C++
C++ C#
C# MongoDB
 MySQL
MySQL Javascript
 PHP
PHP
- Selected Reading
- UPSC IAS Exams Notes
- Developer's Best Practices
- Questions and Answers
- Effective Resume Writing
- HR Interview Questions
- Computer Glossary
- Who is Who
How to label a patch in matplotlib?
To label a patch in matplotlib, we can take the following steps −
Set the figure size and adjust the padding between and around the subplots.
Initialize the center of the rectangle patch.
Create a new figure or activate an existing figure.
Add an 'ax' to the figure as part of a subplot arrangement.
Add a 'rectangle' to the axes' patches; return the patch.
Place a legend on the figure.
To display the figure, use show() method.
Example
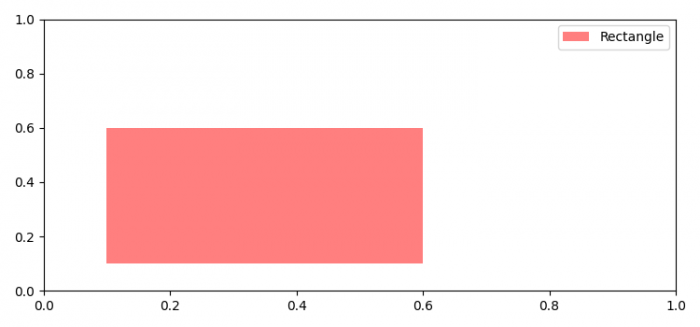
import matplotlib.pyplot as plt import matplotlib.patches as patches plt.rcParams["figure.figsize"] = [7.50, 3.50] plt.rcParams["figure.autolayout"] = True x = y = 0.1 fig = plt.figure() ax = fig.add_subplot(111) patch = ax.add_patch(patches.Rectangle((x, y), 0.5, 0.5, alpha=0.5, facecolor='red', label='Rectangle')) plt.legend(loc='upper right') plt.show()
Output

Updated on: 2021-08-10T07:01:05+05:30
3K+ Views

Advertisements