
 Data Structure
 Networking
 RDBMS
RDBMS Operating System
 Java
Java MS Excel
 iOS
iOS HTML
HTML CSS
CSS Android
 Python
 C Programming
 C++
C++ C#
C# MongoDB
 MySQL
MySQL Javascript
 PHP
PHP
- Selected Reading
- UPSC IAS Exams Notes
- Developer's Best Practices
- Questions and Answers
- Effective Resume Writing
- HR Interview Questions
- Computer Glossary
- Who is Who
How to control the border of a bar patch in matplotlib?
To control the border of a bar patch in matplotlib, we can take the following steps
Steps
Set the figure size and adjust the padding between and around the subplots.
Create a list of heights and a tuple for labels.
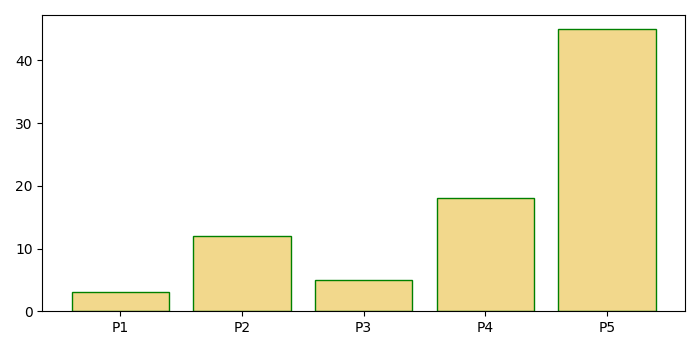
Use the bar() method with edgecolor in the argument to control the color of the bar patch. Here we have used edgecolor='green'.
Set the ticks and labels of the X-axis.
To display the figure, use Show() method.
Example
import numpy as np import matplotlib.pyplot as plt plt.rcParams["figure.figsize"] = [7.00, 3.50] plt.rcParams["figure.autolayout"] = True height = [3, 12, 5, 18, 45] labels = ('P1', 'P2', 'P3', 'P4', 'P5') x_pos = np.arange(len(labels)) plt.bar(x_pos, height, color=(0.9, 0.7, 0.1, 0.5), edgecolor='green') plt.xticks(x_pos, labels) plt.show() Output
It will produce the following output −
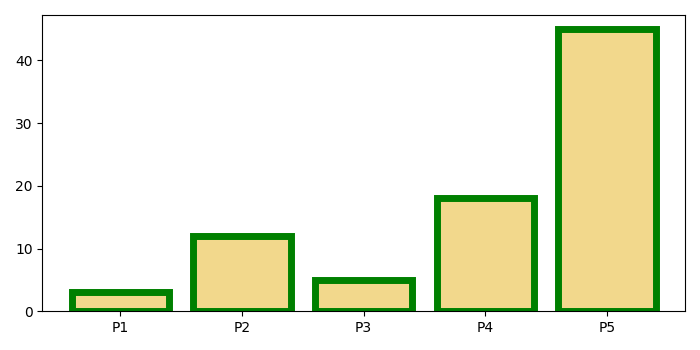
You can change the width of the borders by introducing the linewidth parameter in the bar() method. Suppose we take linewidth=5, then It will produce the following output −

Updated on: 2021-10-09T09:35:09+05:30
6K+ Views

Advertisements