
 Data Structure
 Networking
 RDBMS
RDBMS Operating System
 Java
Java MS Excel
 iOS
iOS HTML
HTML CSS
CSS Android
 Python
 C Programming
 C++
C++ C#
C# MongoDB
 MySQL
MySQL Javascript
 PHP
PHP
- Selected Reading
- UPSC IAS Exams Notes
- Developer's Best Practices
- Questions and Answers
- Effective Resume Writing
- HR Interview Questions
- Computer Glossary
- Who is Who
How to extract data from a Matplotlib plot?
To extract data from a plot in matplotlib, we can use get_xdata() and get_ydata() methods.
Steps
- Set the figure size and adjust the padding between and around the subplots.
- Create y data points using numpy.
- Plot y data points with color=red and linewidth=5.
- Print a statment for data extraction.
- Use get_xdata() and get_ydata() methods to extract the data from the plot (step 3).
- Print x and y data (Step 5).
- To display the figure, use show() method.
Example
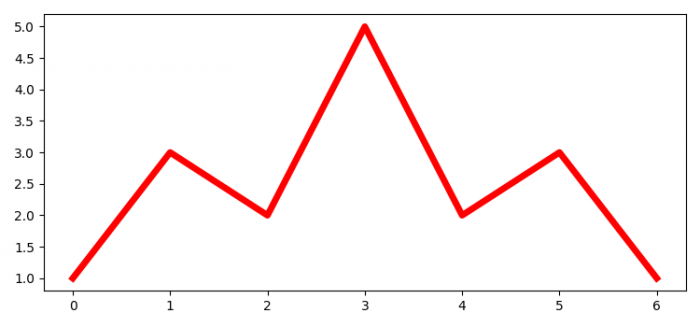
import numpy as np from matplotlib import pyplot as plt plt.rcParams["figure.figsize"] = [7.50, 3.50] plt.rcParams["figure.autolayout"] = True y = np.array([1, 3, 2, 5, 2, 3, 1]) curve, = plt.plot(y, c='red', lw=5) print("Extracting data from plot....") xdata = curve.get_xdata() ydata = curve.get_ydata() print("X data points for the plot is: ", xdata) print("Y data points for the plot is: ", ydata) plt.show() Output
Extracting data from plot.... X data points for the plot is: [0. 1. 2. 3. 4. 5. 6.] Y data points for the plot is: [1 3 2 5 2 3 1]

Updated on: 2021-06-01T11:32:47+05:30
16K+ Views

Advertisements