
 Data Structure
 Networking
 RDBMS
RDBMS Operating System
 Java
Java MS Excel
 iOS
iOS HTML
HTML CSS
CSS Android
 Python
 C Programming
 C++
C++ C#
C# MongoDB
 MySQL
MySQL Javascript
 PHP
PHP
- Selected Reading
- UPSC IAS Exams Notes
- Developer's Best Practices
- Questions and Answers
- Effective Resume Writing
- HR Interview Questions
- Computer Glossary
- Who is Who
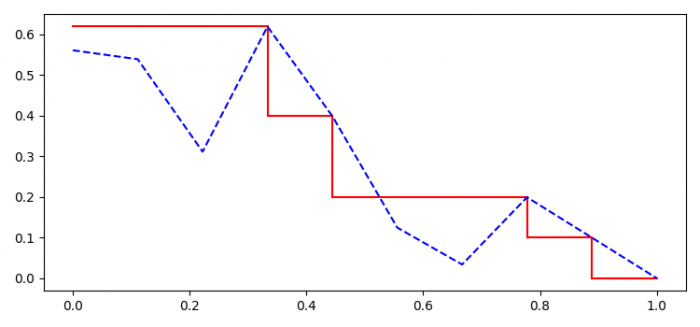
How to draw a precision-recall curve with interpolation in Python Matplotlib?
To draw a precision-recall curve with interpolation in Python, we can take the following steps −
Steps
Set the figure size and adjust the padding between and around the subplots.
Create r, p and duplicate recall, i data points using numpy.
Create a figure and a set of subplots.
Plot the recall matrix in the range of r.shape.
Plot the r and dup_r data points using plot() method.
To display the figure, use show() method.
Example
import numpy as np import matplotlib.pyplot as plt plt.rcParams["figure.figsize"] = [7.50, 3.50] plt.rcParams["figure.autolayout"] = True r = np.linspace(0.0, 1.0, num=10) p = np.random.rand(10) * (1. - r) dup_p = p.copy() i = r.shape[0] - 2 while i >= 0: if p[i + 1] > p[i]: p[i] = p[i + 1] i = i - 1 fig, ax = plt.subplots() for i in range(r.shape[0] - 1): ax.plot((r[i], r[i]), (p[i], p[i + 1]), 'k-', label='', color='red') ax.plot((r[i], r[i + 1]), (p[i + 1], p[i + 1]), 'k-', label='', color='red') ax.plot(r, dup_p, 'k--', color='blue') plt.show()
Output
It will produce the following output −

Updated on: 2022-02-02T11:33:00+05:30
866 Views

Advertisements