
 Data Structure
 Networking
 RDBMS
RDBMS Operating System
 Java
Java MS Excel
 iOS
iOS HTML
HTML CSS
CSS Android
 Python
 C Programming
 C++
C++ C#
C# MongoDB
 MySQL
MySQL Javascript
 PHP
PHP
- Selected Reading
- UPSC IAS Exams Notes
- Developer's Best Practices
- Questions and Answers
- Effective Resume Writing
- HR Interview Questions
- Computer Glossary
- Who is Who
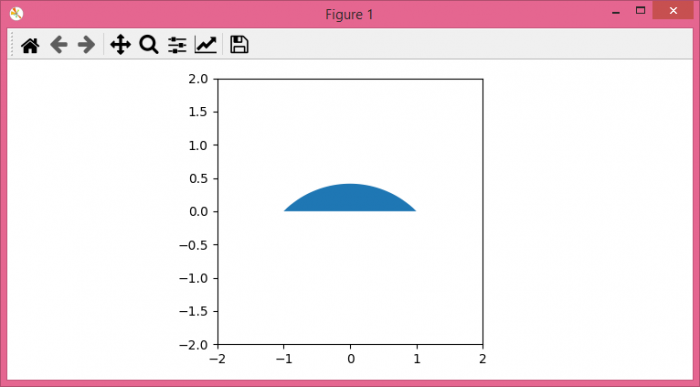
How to draw a filled arc in Matplotlib?
To draw a filled arc in matplotlib, we can take the following steps −
Set the figure size and adjust the padding between and around the subplots.
Create a figure and a set of subplots.
Initialize two variables, r, yoff.
Create x and y data points using Numpy.
Fill the area between x and y plots.
Set the axis aspect and draw the figure canvas.
To display the figure, use show() method.
Example
import matplotlib.pyplot as plt import numpy as np plt.rcParams["figure.figsize"] = [7.50, 3.50] plt.rcParams["figure.autolayout"] = True fg, ax = plt.subplots(1, 1) r = 2. yoff = -1 x = np.arange(-1., 1.05, 0.05) y = np.sqrt(r - x ** 2) + yoff ax.fill_between(x, y, 0) ax.axis([-2, 2, -2, 2]) ax.set_aspect("equal") fg.canvas.draw() plt.show() Output

Updated on: 2021-09-23T09:12:31+05:30
1K+ Views

Advertisements