
 Data Structure
 Networking
 RDBMS
RDBMS Operating System
 Java
Java MS Excel
 iOS
iOS HTML
HTML CSS
CSS Android
 Python
 C Programming
 C++
C++ C#
C# MongoDB
 MySQL
MySQL Javascript
 PHP
PHP
- Selected Reading
- UPSC IAS Exams Notes
- Developer's Best Practices
- Questions and Answers
- Effective Resume Writing
- HR Interview Questions
- Computer Glossary
- Who is Who
How to change the Y axis limit for boxplot created by using ggplot2 in R?
One of the most important aspects of a boxplot is Y-axis labels because these labels help us to understand the limit of the variable. Since R generate these labels automatically in a good way, we stick with that but we can change that using coord_cartesian function with ylim as shown in the below example.
Example
Consider the below data frame −
set.seed(1212) x<-sample(LETTERS[1:4],20,replace=TRUE) y<-rnorm(20,330,24) df<-data.frame(x,y) df
Output
x y 1 D 339.7344 2 B 321.6099 3 A 362.2010 4 A 370.1631 5 D 336.1964 6 B 306.7497 7 D 321.2534 8 D 297.1067 9 C 330.8902 10 B 353.0927 11 A 308.0316 12 C 335.7435 13 A 321.4714 14 B 299.6519 15 D 389.7760 16 A 298.2838 17 C 335.7696 18 C 310.1602 19 D 310.3076 20 C 310.8022
Loading ggplot2 package and creating boxplot of y for x −
Example
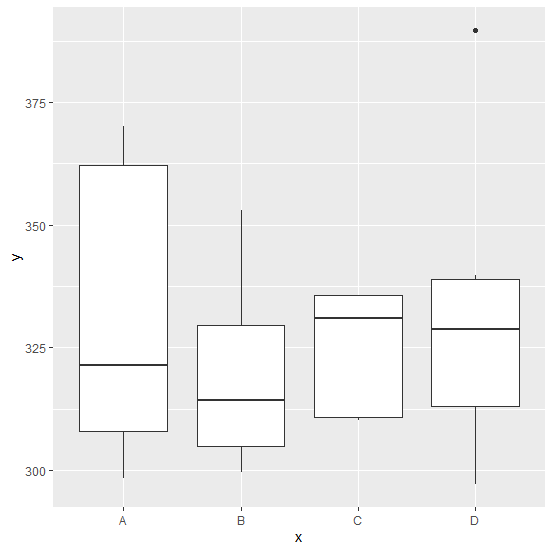
library(ggplot2) ggplot(df,aes(x,y))+geom_boxplot()
Output
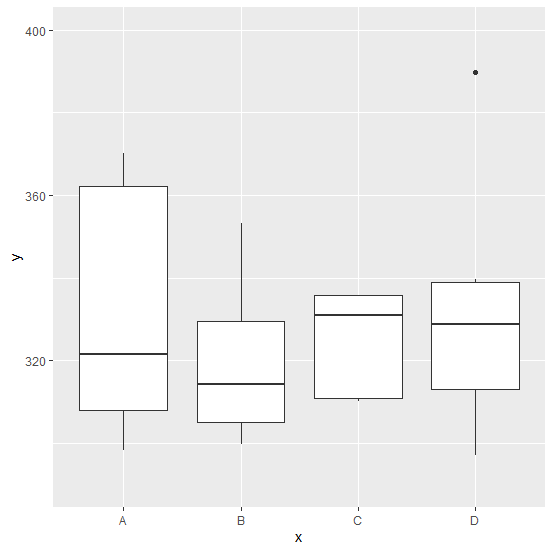
Creating boxplot of y with different limits on the Y-axis −
ggplot(df,aes(x,y))+geom_boxplot()+coord_cartesian(ylim=c(290,400))
Output

Updated on: 2020-10-17T13:57:17+05:30
2K+ Views

Advertisements