
 Data Structure
 Networking
 RDBMS
RDBMS Operating System
 Java
Java MS Excel
 iOS
iOS HTML
HTML CSS
CSS Android
 Python
 C Programming
 C++
C++ C#
C# MongoDB
 MySQL
MySQL Javascript
 PHP
PHP
- Selected Reading
- UPSC IAS Exams Notes
- Developer's Best Practices
- Questions and Answers
- Effective Resume Writing
- HR Interview Questions
- Computer Glossary
- Who is Who
How to change the size of dots in dotplot created by using ggplot2 in R?
To change the size of dots in dotplot created by using ggplot2, we can use binwidth argument inside geom_dotplot. For example, if we have a data frame called df that contains a column x for which we want to create the dotplot then the plot with different size of dots can be created by using the command ggplot(df,aes(x))+geom_dotplot(binwidth=2).
Example
Consider the below data frame −
x<-rpois(20,5) df<-data.frame(x) df
Output
x 1 1 2 3 3 6 4 3 5 5 6 11 7 2 8 3 9 2 10 6 11 5 12 4 13 4 14 6 15 8 16 6 17 8 18 9 19 4 20 7
Loading ggplot2 package and creating a dotpot for data in df with different size of dots −
Example
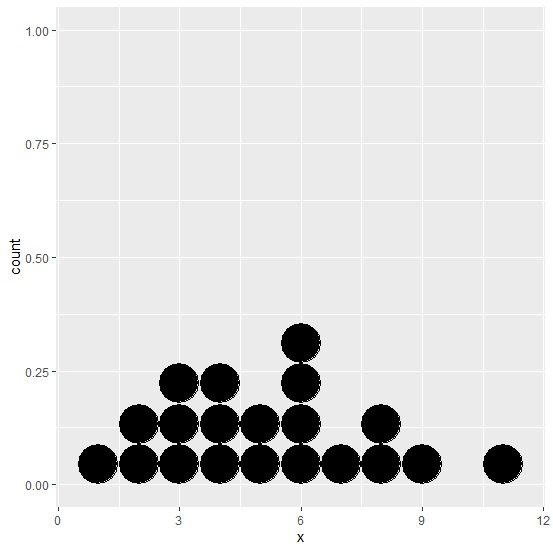
library(ggplot2) ggplot(df,aes(x))+geom_dotplot(binwidth=1)
Output
Example
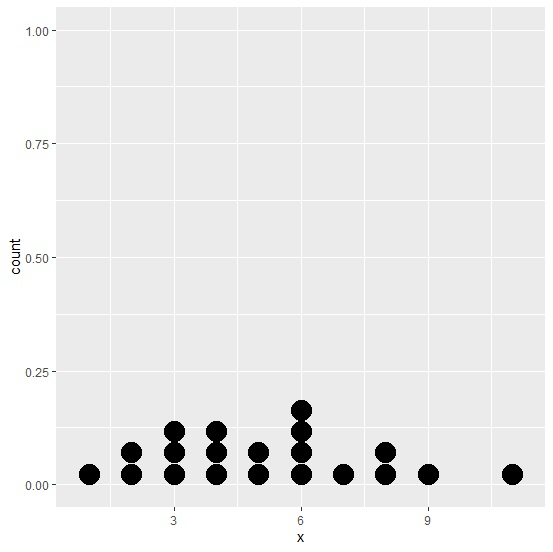
ggplot(df,aes(x))+geom_dotplot(binwidth=0.5)
Output
Example
ggplot(df,aes(x))+geom_dotplot(binwidth=2)
Output


Updated on: 2021-03-06T13:28:23+05:30
3K+ Views

Advertisements