
 Data Structure
 Networking
 RDBMS
RDBMS Operating System
 Java
Java MS Excel
 iOS
iOS HTML
HTML CSS
CSS Android
 Python
 C Programming
 C++
C++ C#
C# MongoDB
 MySQL
MySQL Javascript
 PHP
PHP
- Selected Reading
- UPSC IAS Exams Notes
- Developer's Best Practices
- Questions and Answers
- Effective Resume Writing
- HR Interview Questions
- Computer Glossary
- Who is Who
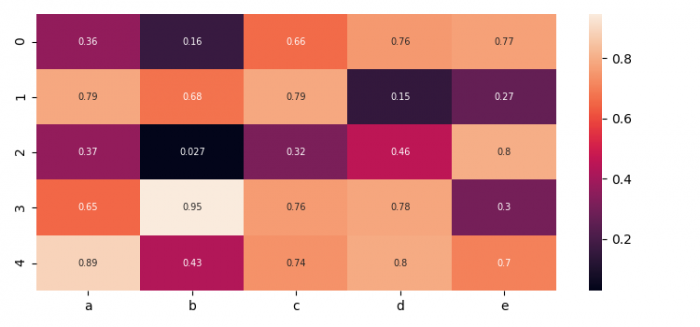
How to annotate each cell of a heatmap in Seaborn?
To annotate each cell of a heatmap, we can make annot = True in heatmap() method.
Steps
- Set the figure size and adjust the padding between and around the subplots.
- Create a Pandas dataframe with 5 columns.
- Use sns.heatmap() to plot a dataframe (Step 2) with annot=True flag in the argument.
- To display the figure, use show() method.
Example
import seaborn as sns import pandas as pd import numpy as np import matplotlib.pyplot as plt plt.rcParams["figure.figsize"] = [7.50, 3.50] plt.rcParams["figure.autolayout"] = True df = pd.DataFrame(np.random.random((5, 5)), columns=["a", "b", "c", "d", "e"]) sns.heatmap(df, annot=True, annot_kws={"size": 7}) plt.show() Output

Updated on: 2021-06-02T08:43:16+05:30
2K+ Views

Advertisements