
 Data Structure
 Networking
 RDBMS
RDBMS Operating System
 Java
Java MS Excel
 iOS
iOS HTML
HTML CSS
CSS Android
 Python
 C Programming
 C++
C++ C#
C# MongoDB
 MySQL
MySQL Javascript
 PHP
PHP
- Selected Reading
- UPSC IAS Exams Notes
- Developer's Best Practices
- Questions and Answers
- Effective Resume Writing
- HR Interview Questions
- Computer Glossary
- Who is Who
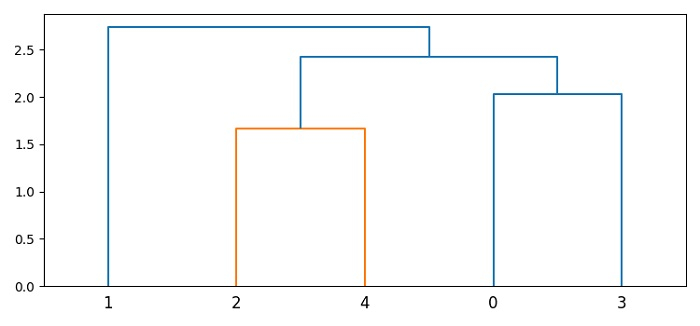
How to adjust the branch lengths of a dendrogram in Matplotlib?
To adjust the branch length of a dendrogram in Matplotlib, we can take the following steps −
Set the figure size and adjust the padding between and around the subplots.
Draw random samples (a and b) from a multivariate normal distribution.
Join a sequence of arrays along an existing axis, using concatenate() method.
Perform hierarchical/agglomerative clustering.
Create a new figure or activate an existing figure using figure() method.
Add an axes to the figure as part of a subplot arrangement.
Plot the hierarchical clustering as a dendrogram using dendrogram() method.
To display the figure, use show() method.
Example
from matplotlib import pyplot as plt from scipy.cluster.hierarchy import dendrogram, linkage import numpy as np plt.rcParams["figure.figsize"] = [7.50, 3.50] plt.rcParams["figure.autolayout"] = True a = np.random.multivariate_normal([0, 10], [[3, 1], [1, 4]], size=[2, ]) b = np.random.multivariate_normal([0, 10], [[3, 1], [1, 4]], size=[3, ]) X = np.concatenate((a, b), ) Z = linkage(X) fig = plt.figure() ax = fig.add_subplot(1, 1, 1) dendrogram(Z, ax=ax) plt.show()
Output

Updated on: 2021-06-03T12:32:56+05:30
1K+ Views

Advertisements