
 Data Structure
 Networking
 RDBMS
RDBMS Operating System
 Java
Java MS Excel
 iOS
iOS HTML
HTML CSS
CSS Android
 Python
 C Programming
 C++
C++ C#
C# MongoDB
 MySQL
MySQL Javascript
 PHP
PHP
- Selected Reading
- UPSC IAS Exams Notes
- Developer's Best Practices
- Questions and Answers
- Effective Resume Writing
- HR Interview Questions
- Computer Glossary
- Who is Who
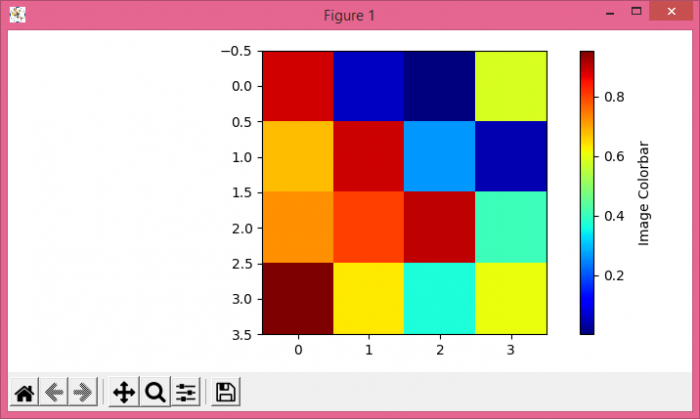
How do I adjust (offset) the colorbar title in Matplotlib?
To adjust (offset) the colorbar title in matplotlib, we can take the following steps −
Create a random data of 4×4 dimension.
Use imshow() method to display the data as an imgage.
Create a colorbar for a scalar mappable instance using colorbar() method, with im mappable instance.
Now, adjust (offset) the colorbar title in matplotlib, with labelpad=-1. You can assign different values to labelpad to see how it affects the colorbar title.
To display the figure, use show() method.
Example
import numpy as np from matplotlib import pyplot as plt, cm plt.rcParams["figure.figsize"] = [7.00, 3.50] plt.rcParams["figure.autolayout"] = True data = np.random.rand(4, 4) im = plt.imshow(data, cmap=cm.jet) cb = plt.colorbar(im) cb.set_label('Image Colorbar', labelpad=-1) plt.show() Output

Updated on: 2021-05-08T09:30:32+05:30
3K+ Views

Advertisements