
 Data Structure
 Networking
 RDBMS
RDBMS Operating System
 Java
Java MS Excel
 iOS
iOS HTML
HTML CSS
CSS Android
 Python
 C Programming
 C++
C++ C#
C# MongoDB
 MySQL
MySQL Javascript
 PHP
PHP
- Selected Reading
- UPSC IAS Exams Notes
- Developer's Best Practices
- Questions and Answers
- Effective Resume Writing
- HR Interview Questions
- Computer Glossary
- Who is Who
Exporting an svg file from a Matplotlib figure
To export an SVG file from a matplotlib figure, we can take the following steps −
Set the figure size and adjust the padding between and around the subplots.
Create a figure and a set of subplots.
Create random x and y data points using numpy.
Plot x and y data points using plot() method.
Save the .svg format file using savefig() method.
Example
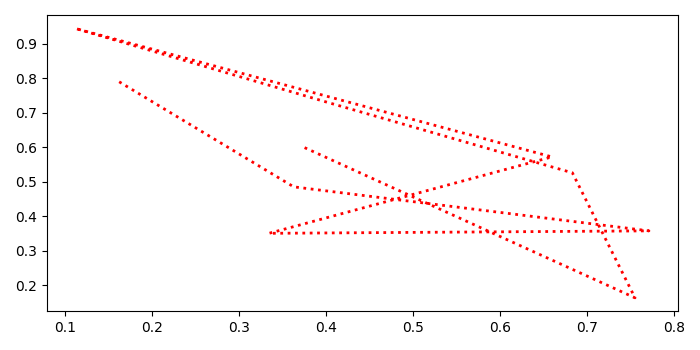
import numpy as np from matplotlib import pyplot as plt plt.rcParams["figure.figsize"] = [7.00, 3.50] plt.rcParams["figure.autolayout"] = True fig, ax = plt.subplots() x = np.random.rand(10) y = np.random.rand(10) ax.plot(x, y, ls='dotted', linewidth=2, color='red') plt.savefig("myimg.svg") Output
When we execute this code, it will create an SVG file called "myimg.svg" and save it in the current directory.

Updated on: 2021-05-12T12:22:14+05:30
13K+ Views

Advertisements