
 Data Structure
 Networking
 RDBMS
RDBMS Operating System
 Java
Java MS Excel
 iOS
iOS HTML
HTML CSS
CSS Android
 Python
 C Programming
 C++
C++ C#
C# MongoDB
 MySQL
MySQL Javascript
 PHP
PHP
- Selected Reading
- UPSC IAS Exams Notes
- Developer's Best Practices
- Questions and Answers
- Effective Resume Writing
- HR Interview Questions
- Computer Glossary
- Who is Who
Make a multiline plot from .CSV file in matplotlib
To make a multiline plot from .CSV file in matplotlib, we can take the following steps −
- Set the figure size and adjust the padding between and around the subplots.
- Create a list of columns to fetch the data from a .CSV file. Make sure the names match with the column names used in the .CSV file.
- Read the data from the .CSV file.
- Plot the lines using df.plot() method.
- To display the figure, use show() method.
Example
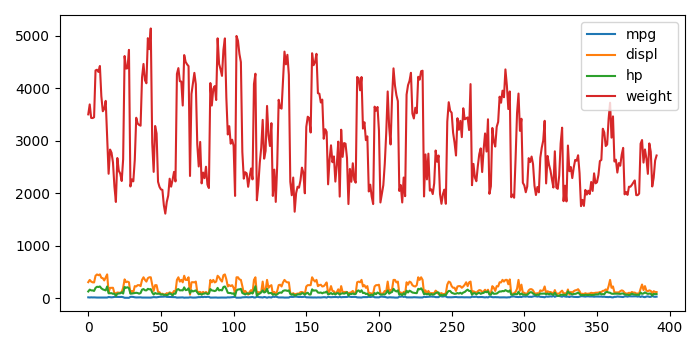
import pandas as pd from matplotlib import pyplot as plt # Set the figure size plt.rcParams["figure.figsize"] = [7.00, 3.50] plt.rcParams["figure.autolayout"] = True # Make a list of columns columns = ['mpg', 'displ', 'hp', 'weight'] # Read a CSV file df = pd.read_csv("auto-mpg.csv", usecols=columns) # Plot the lines df.plot() plt.show() Output
It will produce the following output


Updated on: 2021-09-22T08:41:31+05:30
13K+ Views

Advertisements