
 Data Structure
 Networking
 RDBMS
RDBMS Operating System
 Java
Java MS Excel
 iOS
iOS HTML
HTML CSS
CSS Android
 Python
 C Programming
 C++
C++ C#
C# MongoDB
 MySQL
MySQL Javascript
 PHP
PHP
- Selected Reading
- UPSC IAS Exams Notes
- Developer's Best Practices
- Questions and Answers
- Effective Resume Writing
- HR Interview Questions
- Computer Glossary
- Who is Who
Data analysis and Visualization with Python program
In this tutorial, we are going to learn about data analysis and visualization using modules like pandas and matplotlib in Python. Python is an excellent fit for the data analysis things. Install the modules pandas and matplotlib using the following commands.
pip install pandas
pip install matplotlib
You will get a success message after the completion of the installation process. We will first learn about the pandas and then will see matplotlib.
pandas
Pandas is an open-source library of Python which provides data analysis tools. We are going to see some useful methods from the pandas for data analysis.
Creating DataFrames
We need multiple rows to create a DataFrame. Let's see how to do it.
Example
# importing the pands package import pandas as pd # creating rows hafeez = ['Hafeez', 19] aslan = ['Aslan', 21] kareem = ['Kareem', 18] # pass those Series to the DataFrame # passing columns as well data_frame = pd.DataFrame([hafeez, aslan, kareem], columns = ['Name', 'Age']) # displaying the DataFrame print(data_frame)
Output
If you run the above program, you will get the following results.
Name Age 0 Hafeez 19 1 Aslan 21 2 Kareem 18
Importing Data Using pandas
Go to the link and download CSV file. The data in the CSV will be in rows with a comma(,) separated. Let's see how to import and use the data using pandas.
Example
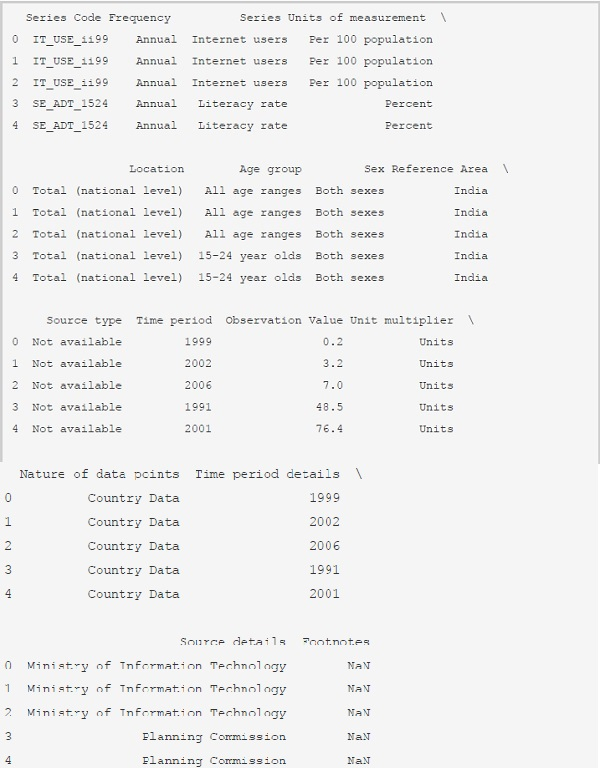
# importing pandas package import pandas as pd # importing the data using pd.read_csv() method data = pd.read_csv('CountryData.IND.csv') # displaying the first 5 rows using data.head() method print(data.head()) Output
If you run the above program, you will get the following results.
Let's see how many rows and columns are there using the shape variable.
Example
# importing pandas package import pandas as pd # importing the data using pd.read_csv() method data = pd.read_csv('CountryData.IND.csv') # no. of rows and columns print(data.shape) Output
If you run the above program, you will get the following results.
(29, 16)
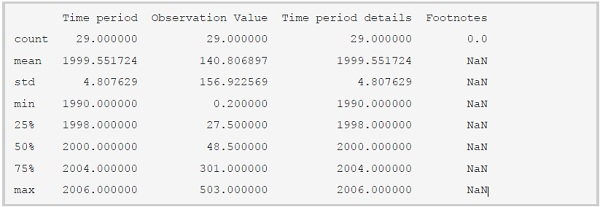
We have a method called describe() which computes various statistics excluding NaN. Let's see it once.
Example
# importing pandas package import pandas as pd # importing the data using pd.read_csv() method data = pd.read_csv('CountryData.IND.csv') # no. of rows and columns print(data.describe()) Output
If you run the above program, you will get the following results.
Data Plotting
We have package matplotlib to create graphs using the data. Let's see how to create various types of graphs using matplotlib.
Example
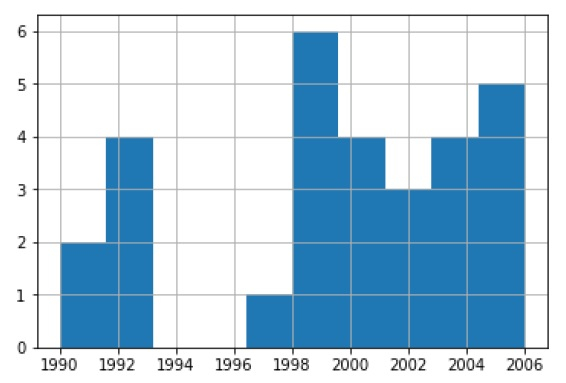
# importing the pyplot module to create graphs import matplotlib.pyplot as plot # importing the data using pd.read_csv() method data = pd.read_csv('CountryData.IND.csv') # creating a histogram of Time period data['Time period'].hist(bins = 10) Output
If you run the above program, you will get the following results.
<matplotlib.axes._subplots.AxesSubplot at 0x25e363ea8d0>
We can create different types of graphs using the matplotlib package.
Conclusion
If you have any doubts regarding the tutorial, mention them in the comment section.

379 Views
