Downloaded 14 times
![International Journal in Foundations of Computer Science & Technology (IJFCST), Vol.4, No.5, September 2014 WEB PERSONALIZATION USING CLUSTERING OF WEB USAGE DATA Bhawesh Kumar Thakur 1, Syed Qamar Abbas2 and Mohd. Rizwan Beg 3 1Department of Computer Science & Engineering, B.I.E.T., U.P.T.U, Lucknow, India 2A.I.M.T.,U.P.T.U Lucknow, India 3Department of Computer Science & Engineering, Integral University, Lucknow, India ABSTRACT The exponential growth in the number and the complexity of information resources and services on the Web has made log data an indispensable resource to characterize the users for Web-based environment. It creates information of related web data in the form of hierarchy structure through approximation. This hierarchy structure can be used as the input for a variety of data mining tasks such as clustering, association rule mining, sequence mining etc. In this paper, we present an approach for personalizing web user environment dynamically when he interacting with web by clustering of web usage data using concept hierarchy. The system is inferred from the web server’s access logs by means of data and web usage mining techniques to extract the information about users. The extracted knowledge is used for the purpose of offering a personalized view of the services to users. KEYWORDS Web Mining, Web Usage Data, Clustering, Personalization. 1. INTRODUCTION Data mining gives capabilities to analyzing large amount of data and extract information that are useful for statistical and business purposes as well. Now a day’s our capability of generating and collecting data have been increasing exponentially. Contributing factors include, the computerization of many business, scientific, and government transactions, and advances in data collection, wide spread use of bar codes, satellite remote sensing data etc. Besides this, heavy access of the World Wide Web as a knowledge repository provides a large amount of data and information. This extra ordinary growth in collected data has generated an immediate requirement for new automated platform that can intelligently help us in converting the huge collection of data into valuable information and knowledge. Data mining aims at discovering valuable information that is hidden in conventional databases. Data mining applied to the web has the potential to be quite beneficial. The emerging field of web mining aims at finding and extracting relevant information that is hidden in Web-related data. Etzioni (1996) is believed to be the inventor of ‘Web Mining’ and he described it as: “Web Mining is the use of data mining techniques to automatically discover and extract information from World Wide Web documents and services.” Web mining is the mining of data related to the World Wide Web. It is categorized into three active research areas according to what part of web data is mined, of which Usage mining, also known as web-log mining, which studies user access information from logged server data in order to extract interesting usage patterns [1]. DOI:10.5121/ijfcst.2014.4507 69](https://image.slidesharecdn.com/webpersonalizationusingclusteringofwebusagedata-141008021833-conversion-gate02/75/Web-personalization-using-clustering-of-web-usage-data-1-2048.jpg)
![International Journal in Foundations of Computer Science & Technology (IJFCST), Vol.4, No.5, September 2014 Web mining is commonly divided into the following three sub-areas: 1. Web Content Mining: It consists of a number of techniques for searching the Web for documents whose content meets a certain criterion. It is an Application of data mining techniques to unstructured or semi structured text. 2. Web Structure Mining: It tries to extract information from the hyperlink structure between different pages. It uses the hyperlink structure of the web as an (additional) information sources. 3. Web Usage Mining: Web Usage Mining is defined as “the application of data mining techniques to discover usage patterns from web data”. It is an analysis of user interaction with a web server. The commonly used Web mining technologies are user access pattern analysis, Web document clustering, classification and information filtering. There are some deficiencies such that most of Web search systems are just in a simple search model, focused on the retrieval efficiency and ignored the retrieval accuracy due to inherent subjectivity, inaccuracy and uncertainty of user queries. The soft decision-making is not available. The relevance of the documents is only a part of attributes and has not very clear boundaries. Clustering is the process of grouping the data into classes or clusters so that objects within a cluster have high similarity in comparison to one another, but are very dissimilar to objects in other clusters. Dissimilarities are assessed based on the attribute values describing the objects. Clustering has its roots in many areas including data mining, statistics, biology and machine learning. The entity in data mining could have large number of attributes. Clustering of said high dimensional data creates major difficulties, more than in supervised learning. In decision trees irrelevant attributes will not be selected for decision nodes. In clustering high dimensionality faces a different problem. First, the irrelevant attributes dilutes any indication on clustering nature. This could also possible with low dimensional space, the probability of occurrence and number of irrelevant attributes increases with dimension. The second problem is the dimensionality curse that is a lack of separation of data in a high dimensional space. Web mining is used to automatically discover and extract information from Web-based data sources such as documents, log, services, and user profiles.[8] A usage-based Web personalization system utilizes Web data in order to modify a Web site.[9] According to Personalization Consortium the main reason of using information technology to provide personalization are [10]: • By anticipating needs to cater the customer requirements in a better manner; • Make the interaction efficient and satisfying for both parties; • Build a relationship with customer that encourages them to return for consequent visits. Personalization is a process of collecting and storing information about website users, analyzing the information relatd to them, and, on the basis of analysis, giving the proper information to each visitor at the right time.[11] 2. PREPROCESSING OF WEB DATA In the WWW (World Wide Web) environment, a large amount of traffic can be generated between clients and web server. The traffic from a client to a server is a URL. The traffic from server to client is a named HTML file that will be interpreted and displayed on the client screen. The web usage log probably is not in a format that is usable by mining applications. As with the data may need to be reformatted and cleaned. Steps that are part of the preprocessing phase include cleansing, user identification, session identification, path completion, and formatting. 70](https://image.slidesharecdn.com/webpersonalizationusingclusteringofwebusagedata-141008021833-conversion-gate02/75/Web-personalization-using-clustering-of-web-usage-data-2-2048.jpg)
![International Journal in Foundations of Computer Science & Technology (IJFCST), Vol.4, No.5, September 2014 • Let P be a set of literals, called pages or clicks, and U be a set of users. A Log is a set of triplets {(u1,p1,t1)…(un,pn,tn)} where ui U, pi P, and ti is a time stamp. Standard log data consist of the following:-Source site, destination site, and time stamp. A common technique for a server site to divide the log records into sessions. A session is a set of page references from one source site during one logical period. Historically, a user logging into a computer, performing work, and then logging off the login would identify a session and log off represent the logical start and end of the session. • Data Cleaning To clean a server log to remove irrelevant items is very important for Web log analysis. The discovered information are only useful if the data represented in the server log gives a correct scenario of the user accesses to the Web site. The HTTP protocol maintains an individual connection for each file requested from the Web server. • User Identification Next, unique users must be identified. This is a very complex task because of the existence of caches, firewalls, and proxy servers. The Web Usage Mining methods that rely on user co-operation or by the automatic identification of web user are the ways to deal with this problem. • Session Identification For logs that cover long duration of time, it is most probable that users will visit the Web site multiple times. The objectives of session identification are to break the web page visits of each user into individual sessions. The simplest method for this is through a timeout, where if the time between page requests crossed a certain threshold, it is supposed that the user is starting a new session. Many commercial products use 15-30 minutes as a default timeout. • Path Completion Another problem in reliably identifying unique user sessions is determining if there are vital accesses that are not recorded in the web access log. This problem is referred to as path completion. Methods similar to those used for user identification can be used for path completion. • Formatting Once the appropriate pre-processing steps have been applied to the server log, a final preparation module can be used to properly format the sessions or transactions for the type of data mining to be accomplished. Let P = (p1,p2…..pu) is the sequence of Web pages accessed from a certain IP between t1 and tu. Then , a user session v(t1,tf),tf tu, is defined as: v(t1,tf)=(p1,p2,….pf) : (Δt=tj-ti-1 δ, 1<j f) ∧ (f = u∨tf+1-tf>δ), where δ is a predefined time threshold [3]. There are many problems associated with the pre-processing activities, and most of these problems centre around the correct identification of the actual user. User identification is complicated by the use of proxy servers, client side caching, and corporate firewalls. Cookies can be used to assist in identifying a single user regardless of machine used to access the web. 3. CLUSTERING HIGH DIMENSIONAL WEB USAGE DATA Hundreds of properties are there in data mining objects. A terrific complexity is faced in high dimensional spaces clustering which is much more than predictive learning. For node splitting, however in decision trees, unnecessary properties would not be selected and those unnecessary properties would not show any impact on Naïve Bayes. A twofold problem is introduced through high dimensionality in clustering. Firstly, if there is any desire on clustering tendency, unnecessary properties occurrence removes it.under whatever definition of similarity,.However, if 71](https://image.slidesharecdn.com/webpersonalizationusingclusteringofwebusagedata-141008021833-conversion-gate02/75/Web-personalization-using-clustering-of-web-usage-data-3-2048.jpg)
![International Journal in Foundations of Computer Science & Technology (IJFCST), Vol.4, No.5, September 2014 there are no amount of clusters present then it is a useless process to conduct a search for clusters. The low dimensional data also follows the same process, Unnecessary properties always rises in dimension with the propability of its number and occurrence. Secondly, dimensionality curse that is a loose way of speaking about a lack of data separation in high dimensional space. Scientifically, nearest neighbour query becomes unbalanced: the distance to the bulk of points is almost similar to the distance of nearest neighbor. For the dimensions higher than fifteen, this impact starts showing its brutal effect. Therefore, related to the theory of distance, creation of clusters is becoming unsure in such conditions. • Dimensionality Reduction Most of the clustering algorithms based on spatial datasets indices which helps in rapid search of the nearest neighbours. As a result, indices provides fine proxies related to dimensionality curse performance impact. Indices whose dimensions ranges under sixteen work successfully, these indices are used in clustering algorithms. For a dimension d > 20 their performance degrades to the level of sequential search (though newer indices achieve significantly higher limits). Hence, possibly it states that more than sixteen properties data is high dimensional. Web clustering totally depends on the contents of the site resulting two hundred to one thousand properties (pages/contents) for reserved Web sites. Dimensions in genomic and biology figures without any problem goes beyond two thousand to five thousand properties. Finally, thousands of properties are dealt in data mining and information recovery. Two approaches are used to handle high dimensionality: (1) Attributes transformations and (2) Domain decomposition. 4. CLUSTERING OF WEB USAGE DATA USING CONCEPT HIERARCHY Clustering of data in a large dimension space is of great interest in many data mining applications. In this, I present a method for personalizing web user environment using clustering of web usage data in a high dimensional space based. In this approach, the relationship present in the web usage data are mapped into a fuzzy proximity relation of user transactions. For this, we cluster the user transactions using the concept hierarchy of web usage data and similarity relation of user transactions. • A user transaction is a sequence of URLS. Let the users’ transaction be: = {T1, T2, T3…Tm} • Let U be the set of Unique URLS appearing in the log data for all transactions U = {URL1, URL2, URL3…, URLn} Here, each Ti is a non-empty subset of U, which is a set of unique URLs appearing in the pre-processed 72 log. 4.1. Concept hierarchy of web usage data Concept hierarchy plays an important role in knowledge discovery process as it specifies background and domain knowledge and helps in better mining of data. In proposed approach, clusters of user transaction are formed from pre-processed log of web usage data, which can be put in a hierarchy. • A concept hierarchy is a poset (partially ordered set) (H, < ) where H is a finite set of concept and < is a partial order on H. [4]](https://image.slidesharecdn.com/webpersonalizationusingclusteringofwebusagedata-141008021833-conversion-gate02/75/Web-personalization-using-clustering-of-web-usage-data-4-2048.jpg)
![International Journal in Foundations of Computer Science & Technology (IJFCST), Vol.4, No.5, September 2014 4.2. Clustering user transactions Clustering of user transactions tend to establish user transactions into groups having similar characteristics that exhibit similar patterns. In this method, transactions related to user are mapped into a multi-dimensional space as vectors of URL. Normally clustering technique partition this space into groups of URL that are nearer to each other based on a distance measure. With reference to web based transactions, each cluster represents a set of transactions that are similar based on co-occurrence patterns of URL references [5]. Such knowledge is especially useful in order to perform market segmentation in E-Commerce application or provide personalized web content to the users. • A pair (A, B) is a (formal) concept of (D, T, R) if and only if A⊆D, B⊆T, A’=B∧B’=A Where, A’ = {t∈T | (d,t)∈R for all d∈D } B’ = {d∈D | (d,t)∈R for all t∈T }[6] • A proximity relation is a mapping S: D × D → [0, 1] such that for x, y, z D, the following rules hold: S (x, x) = 1 (reflexivity) S (x, y) = S(y, x) (symmetry) A fuzzy relation that is reflexive and symmetric is called fuzzy-similarity relation [2]. • - Similarity:- If S is a proximity relation on D, then given an [0,1], two elements x, z D are -similar (denoted by x S z) if and only if S (x, y) >= , definition ( Similarity) are said to -proximate (denoted by x S+z) if and only if either x S z or there exist a sequence y1,y2,y3,….yn D such that x S y1, y1 S y2 , y2 S y3………., yn S z • Indiscernibility:- If S: D ×D→ [0, 1] is a proximity relation, then S + fulfill the property of reflexivity and symmetry. Based on 73 + is an equivalence relation. From proximity relation concept, S Similarity condition, the clusters (transactions) will merges, and it appears as it is due to transitivity. Hence, S+ is an equivalence relation. Let the children of a transaction T be denoted as child (T). The similarity of two transactions Ti and Tj is defined as: - [4] Sim(Ti, Tj) = Child (Ti) Child (Tj) / Child(Ti) Child( Tj ) Let = {T1, T2, T3…Tm} be the user transactions and U = {URL1, URL2, URL3…URLn} be the set of unique URLs in all the transactions here Ti U for I =1 to m. For all Ti, Tj , I define a fuzzy relation R on as R ( Ti, Tj ) = Sim ( Ti, Tj ) From the concept of Indiscernibility, it can be seen that the similarity of two transactions Ti and Tj is a number between 0 and 1.When the similarity of two transactions Ti and Tj is 0, then Ti and Tj are completely dissimilar. On the other hand, if the similarity is 1, then the two transactions are completely similar. The measure of similarity gives information about the users’ browsing pattern. Actually, the browsing of web by any two users may not be exactly similar but may have common interesting sites. Based on the said definition, a similarity matrix can be calculated and used as the base for](https://image.slidesharecdn.com/webpersonalizationusingclusteringofwebusagedata-141008021833-conversion-gate02/75/Web-personalization-using-clustering-of-web-usage-data-5-2048.jpg)
![International Journal in Foundations of Computer Science & Technology (IJFCST), Vol.4, No.5, September 2014 clustering. In the context of clustering user transactions, the huge numbers of dimensions are the URLs present in the access logs. We consider the fuzzy relation to decide the amount of similarity between the user transactions. For all Ti,Tj , I define a fuzzy relation R on as:- R (Ti, Tj) = Sim (Ti, Tj) Relation R formed by the similarity of user transaction = {T1, T2, T3…Tm} is a fuzzy proximity relation and is given by R: Where ij = Sim (Ti, Tj) Now, for any given value >=0, R+ is an equivalence relation. The corresponding partition represents transaction clusters. These partitions represent the transaction Clusters. The user specified value is an important factor based on which the performance of cluster depends. A domain expert can choose the value of [0,1] based on her/his experience. Algorithm -1 represents the overall approach used for clustering 74 Table 1. Algorithm-1 for cluster generation based on concept hierarchy using fuzzy similarity INPUT: 1. = {T1, T2, T3…Tm} // Set of transactions for unique user 2. U = {URL1, URL2, URL3…URLn} // set of unique URLs appearing in the preprocessed log. 3. Value of (by domain expert) OUT PUT: 1. Number of clusters 2. Clusters (Set of Transactions) Step-1: Find the children (all URLs) in a single transaction T as Child (T) Step-2: Find the similarity of two transactions. The similarity of two transactions Ti and Tj is defined as: - Sim(Ti,Tj)=│Child(Ti)Child(Tj)││Child(Ti)Child(Tj)│ Step-3: Compute similarity matrix for all Ti and Tj , where each value in matrix ij = Sim (Ti, Tj). Proximity relation is defined as Sim (Ti,Tj) [0,1] Sim (Ti,Ti) = 1 (Reflexivity) (Ti,Tj) = Sim (Tj,Ti) ( Symmetry) Value of similarity measure always lies between 0 and 1 (fuzzy similarity) Step-4 : Compute - Similarity. For a given value (provided by domain expert) ,here [0,1], two elements Ti, Tz are -similar if Sim (Ti, Tj) >= , definition ( Similarity) are said to -proximate if there exist a sequence y1,y2,y3,….yn such that Ti Sim y1, y1 Sim y2 , y2 Sim y3………., yn Sim Tz. (Transitivity) Step-6: Proximity relation between Ti and Tj fullfil the following properties 1. Reflexivity 2. Symmetry 3. Transitivity Hence , Sim (Ti ,Tj ) proves the Equivalence Relation. This relation generates the equivalence classes. For given value >=0, the corresponding partition (equivalence class) represent transaction clusters](https://image.slidesharecdn.com/webpersonalizationusingclusteringofwebusagedata-141008021833-conversion-gate02/75/Web-personalization-using-clustering-of-web-usage-data-6-2048.jpg)
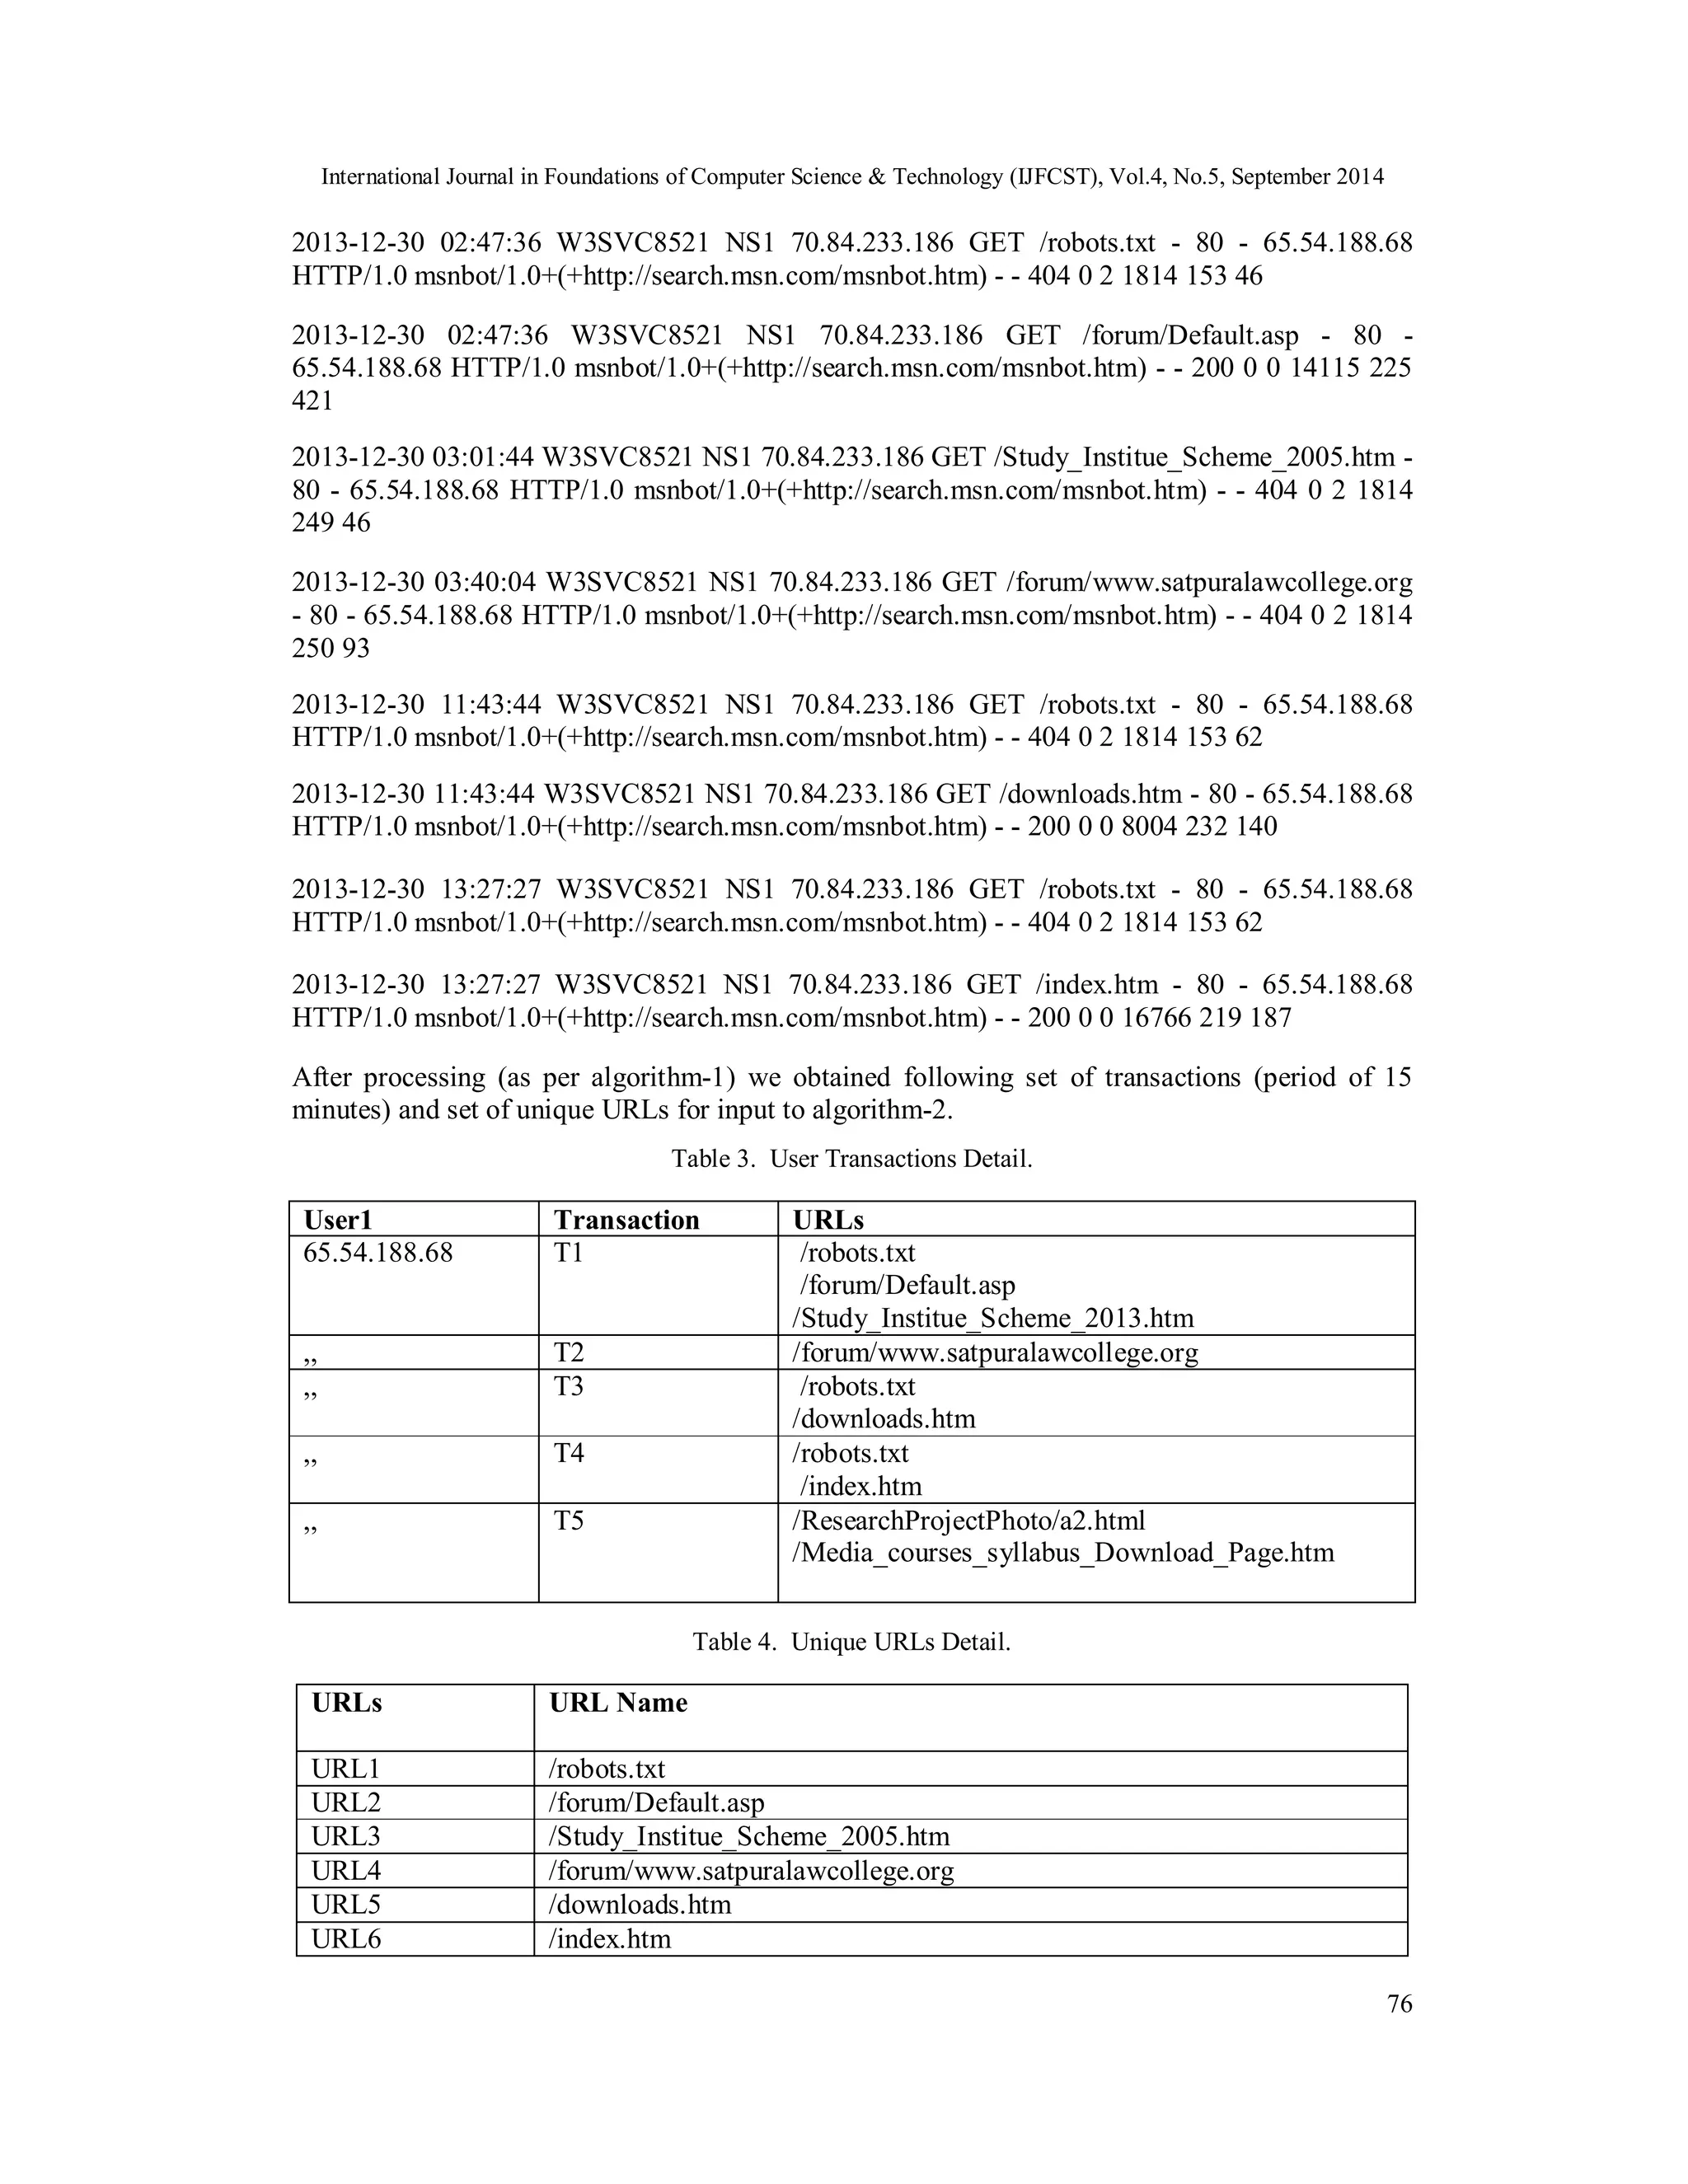
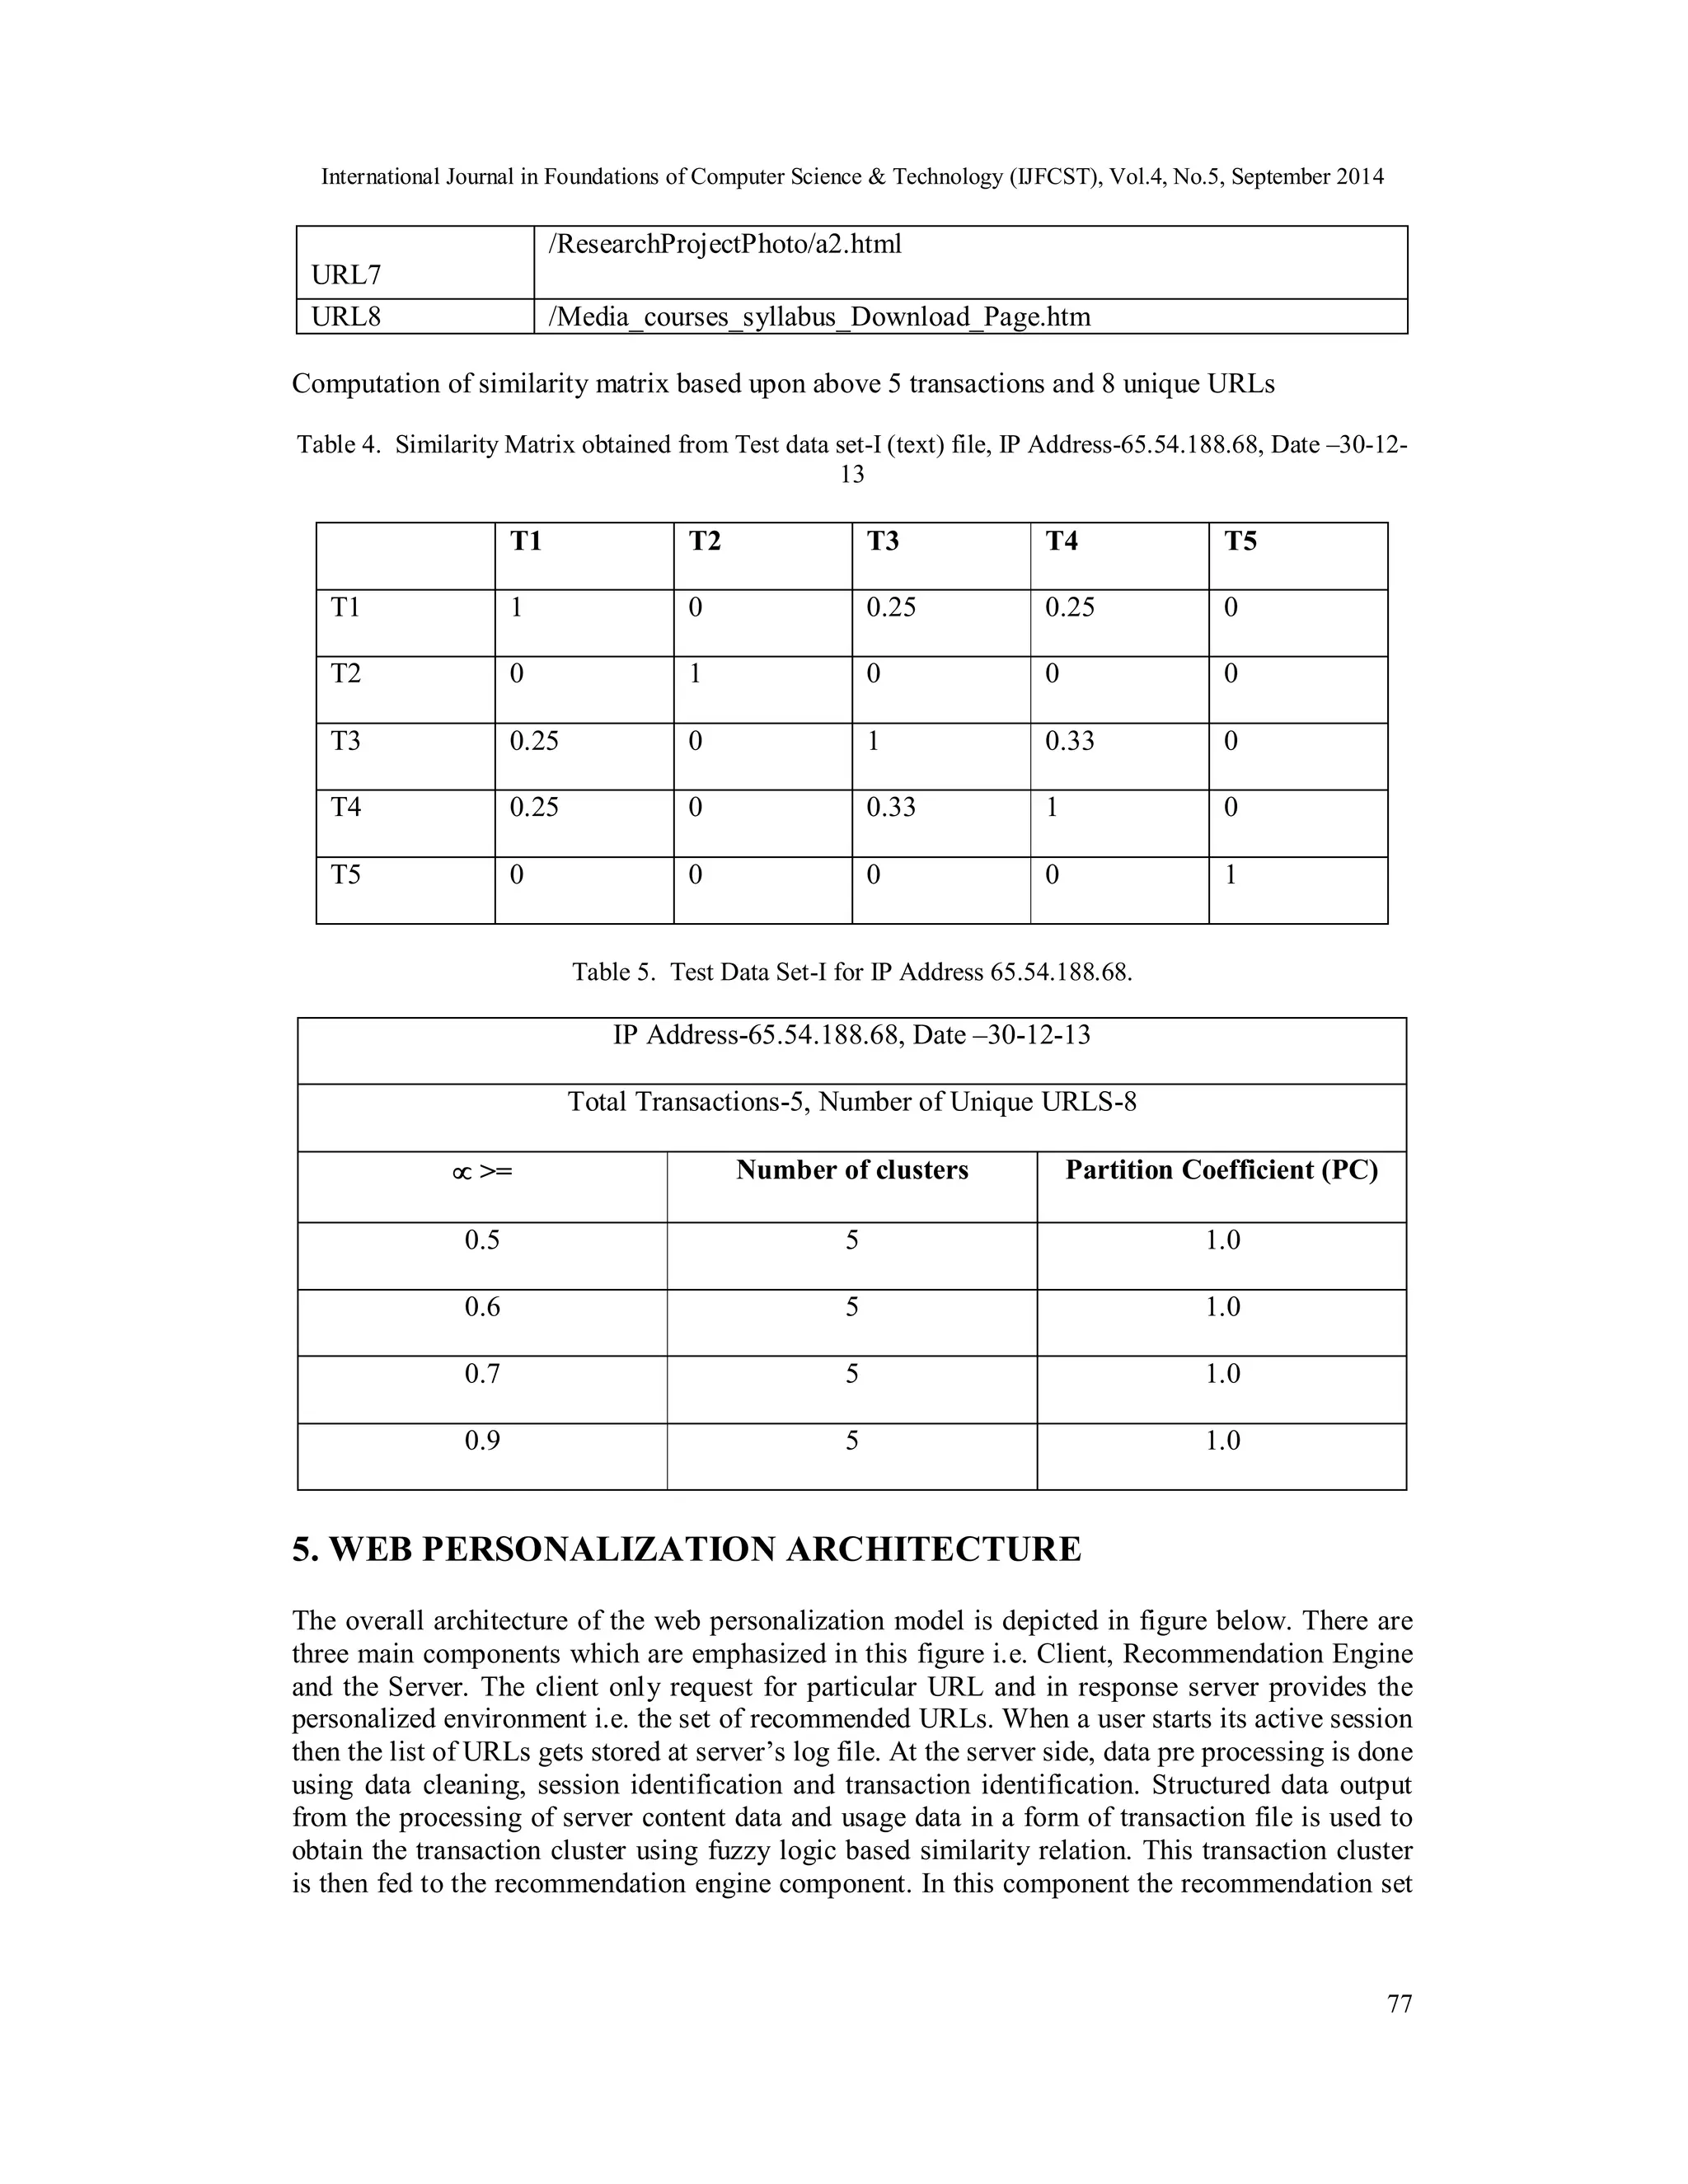
![International Journal in Foundations of Computer Science & Technology (IJFCST), Vol.4, No.5, September 2014 4.3. Experimental Results & Analysis for Clustering of High Dimensional Data We assessed the effectiveness of presented new clustering approach by experimenting with real data sets. The data sets came from MCU Web-site’s server log file. We show similarity matrix related to one data set and their clusters and partition coefficients in table-I and table-II. The log data from accesses to the server during a period of 30 days is used for the purpose of generation of user sessions profiles. In this model clustering quality is purely dependent on user specific value [0,1]. Cluster members vary accordingly variation in the value of [0,1]. Validity of cluster goodness produced by this model is highly subjective matter depends upon domain expert.Algorithm-2 gives an approach to check cluster validity. We evaluate cluster goodness on different value of on different data sets (six data sets) using Partition coefficient, which is simple method for evaluating cluster goodness and applicable on high dimensional data (Web Data). The objective is to seek clustering schemes where most of the vectors of the dataset exhibit high degree of similarity in one cluster. We note, here, that a fuzzy clustering is defined by a matrix U =[uij] where uij denotes the degree of similarity of the vector xi in the j cluster. Partition Coefficient (Bezdek proposed in Bezdeck et al.(1984) the partition coefficient, which is defined as[7] The PC index values range in [1/nc, 1], where nc is the number of clusters. The closer to unity the index the “crisper” the clustering is. In case that all membership values to a fuzzy partition are equal, that is, uij=1/nc, the PC obtains its lower value. Thus, the closer the value of PC is to 1/nc, the fuzzier the clustering is. Furthermore, a value close to 1/nc indicates that there is no clustering tendency in the considered dataset. 75 Table 2. Cluster validity Algorithm INPUT: Nc – Number of clusters N-Total number of transactions in all clusters OUTPUT: PC-Partition coefficient index value ALGORITHM: For i =1 to N do For j = 1 to nc U = 2 4.4. Snapshot of Web Log data of MCU Server: 2013-12-30 02:47:36 #Fields: date time s-sitename s-computername s-ip cs-method cs-uri-stem cs-uri-query s-port cs-username c-ip cs-version cs(User-Agent) cs(Cookie) cs(Referer) sc-status sc-substatus sc-win32- status sc-bytes cs-bytes time-taken ij ij denotes the degree of similarity of the vector xi in the jth cluster end for j end for i PC = U/N](https://image.slidesharecdn.com/webpersonalizationusingclusteringofwebusagedata-141008021833-conversion-gate02/75/Web-personalization-using-clustering-of-web-usage-data-7-2048.jpg)
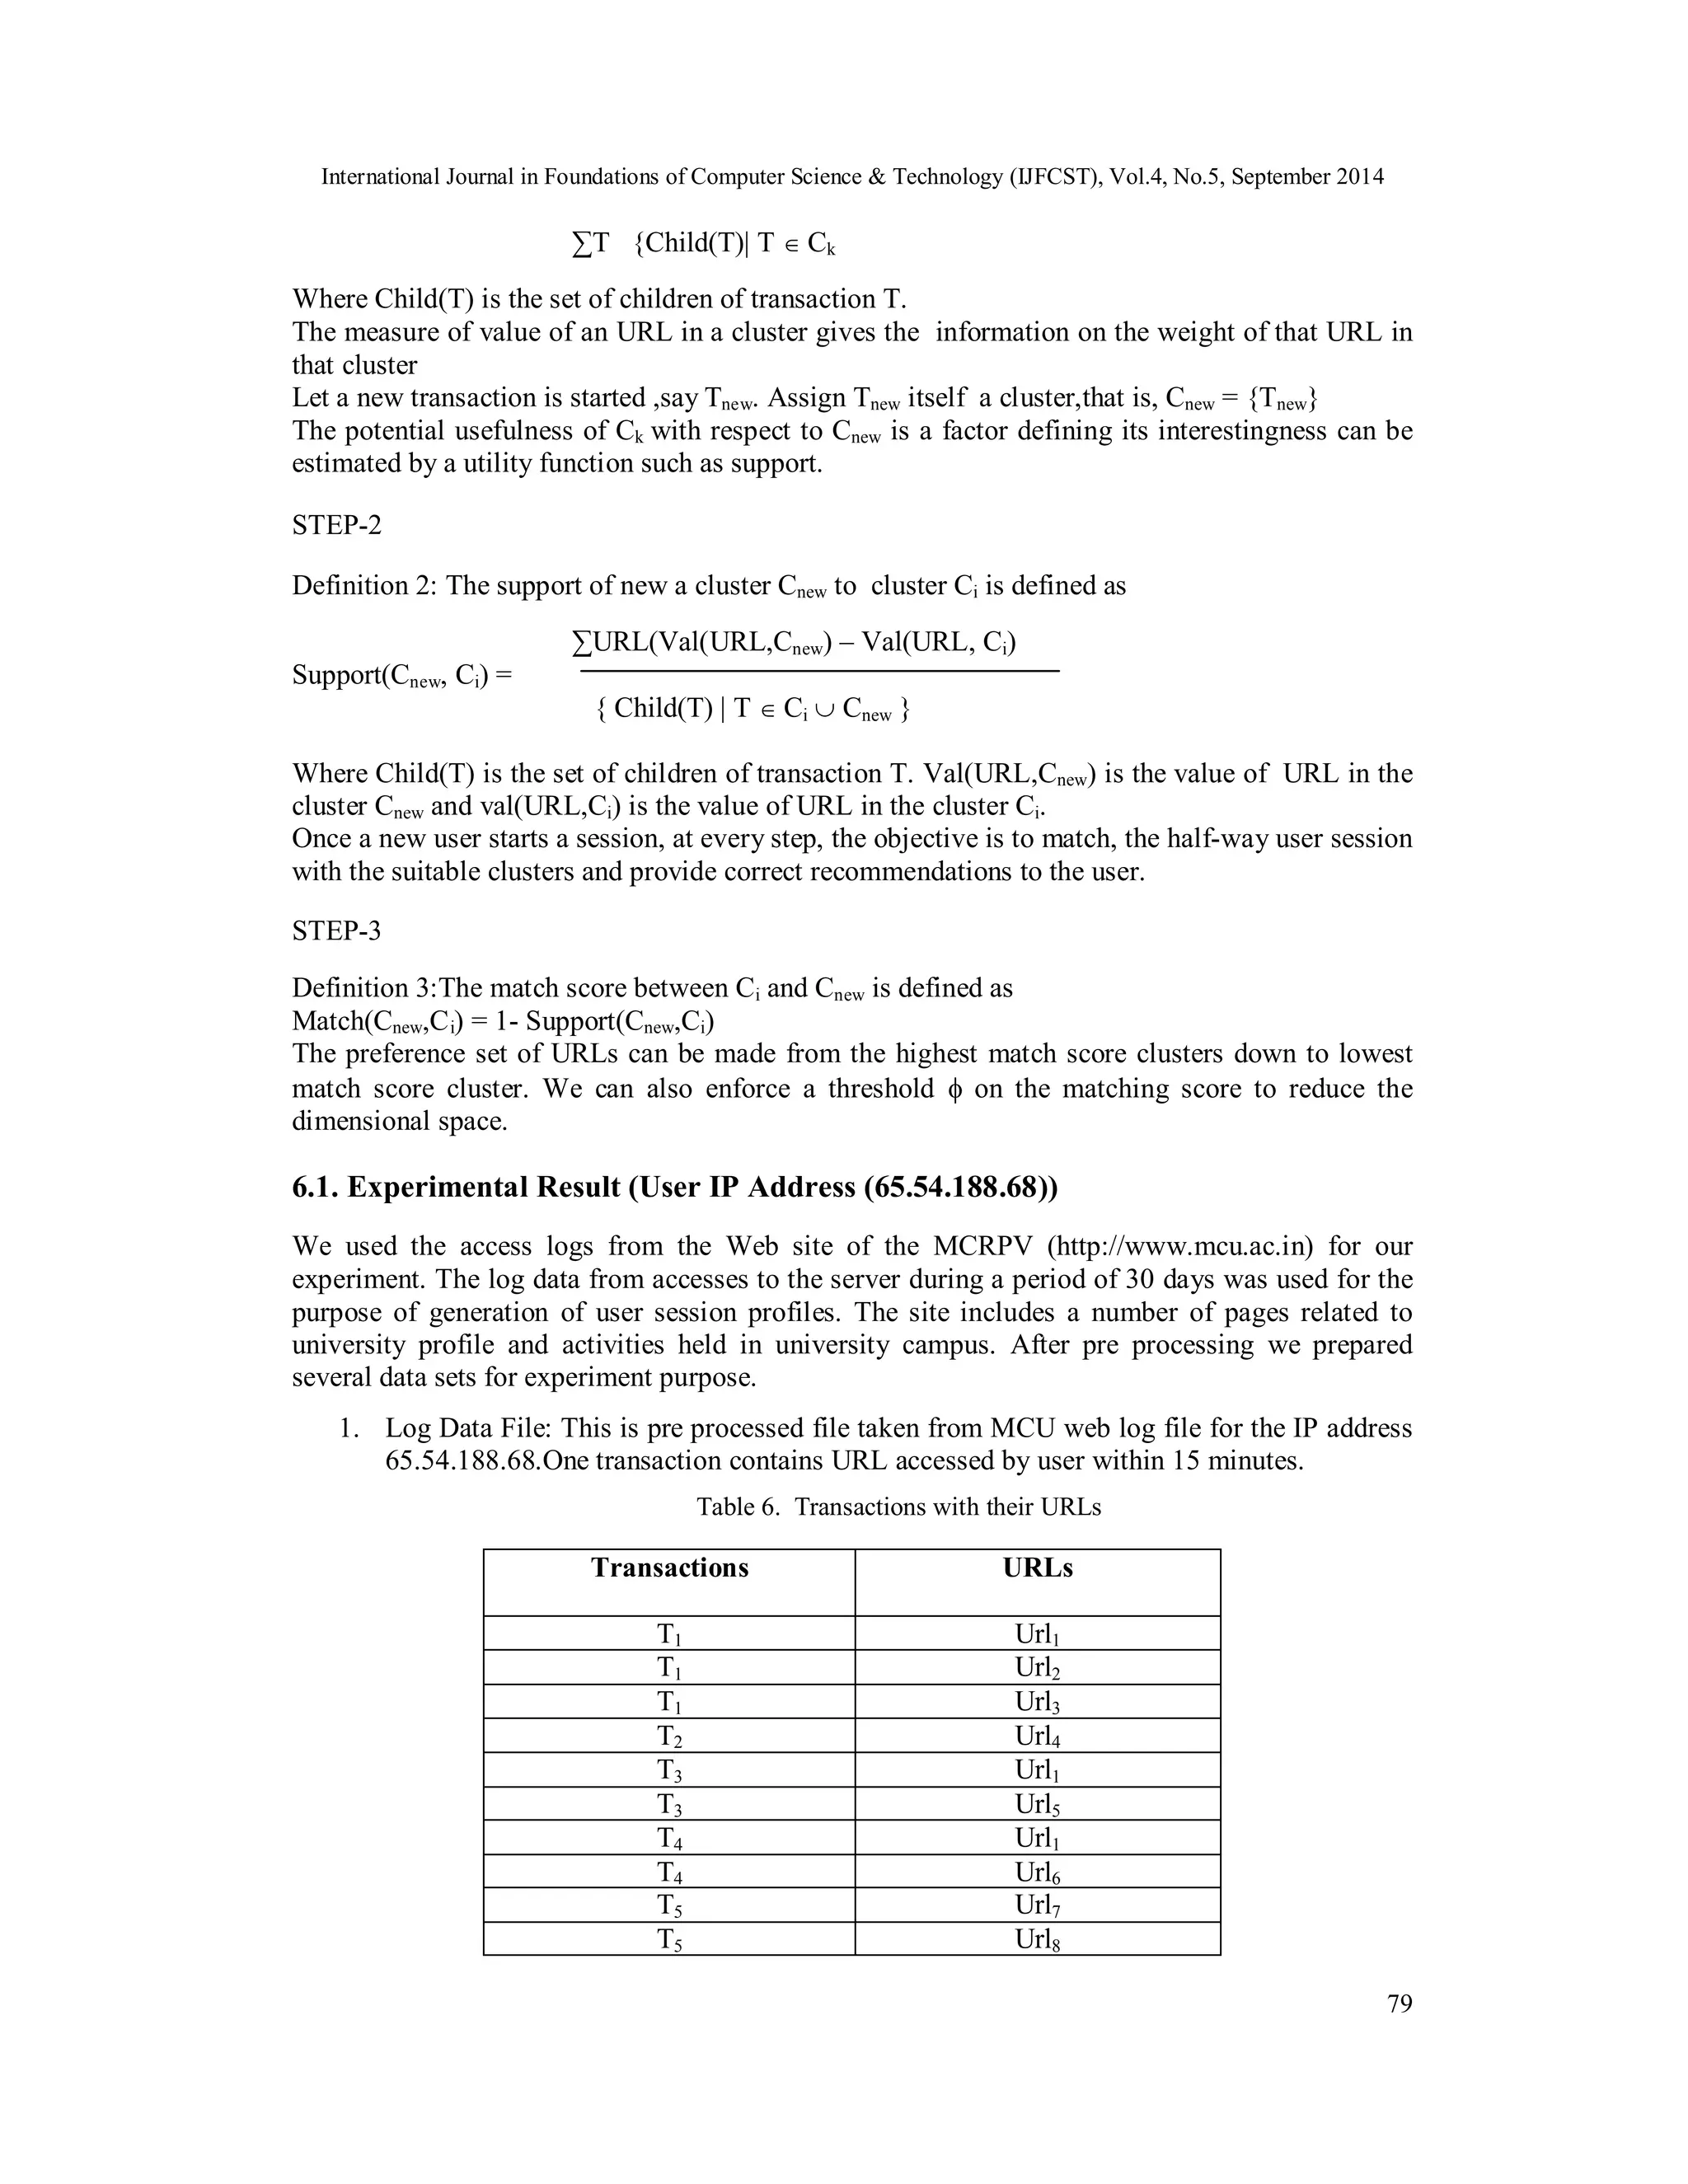
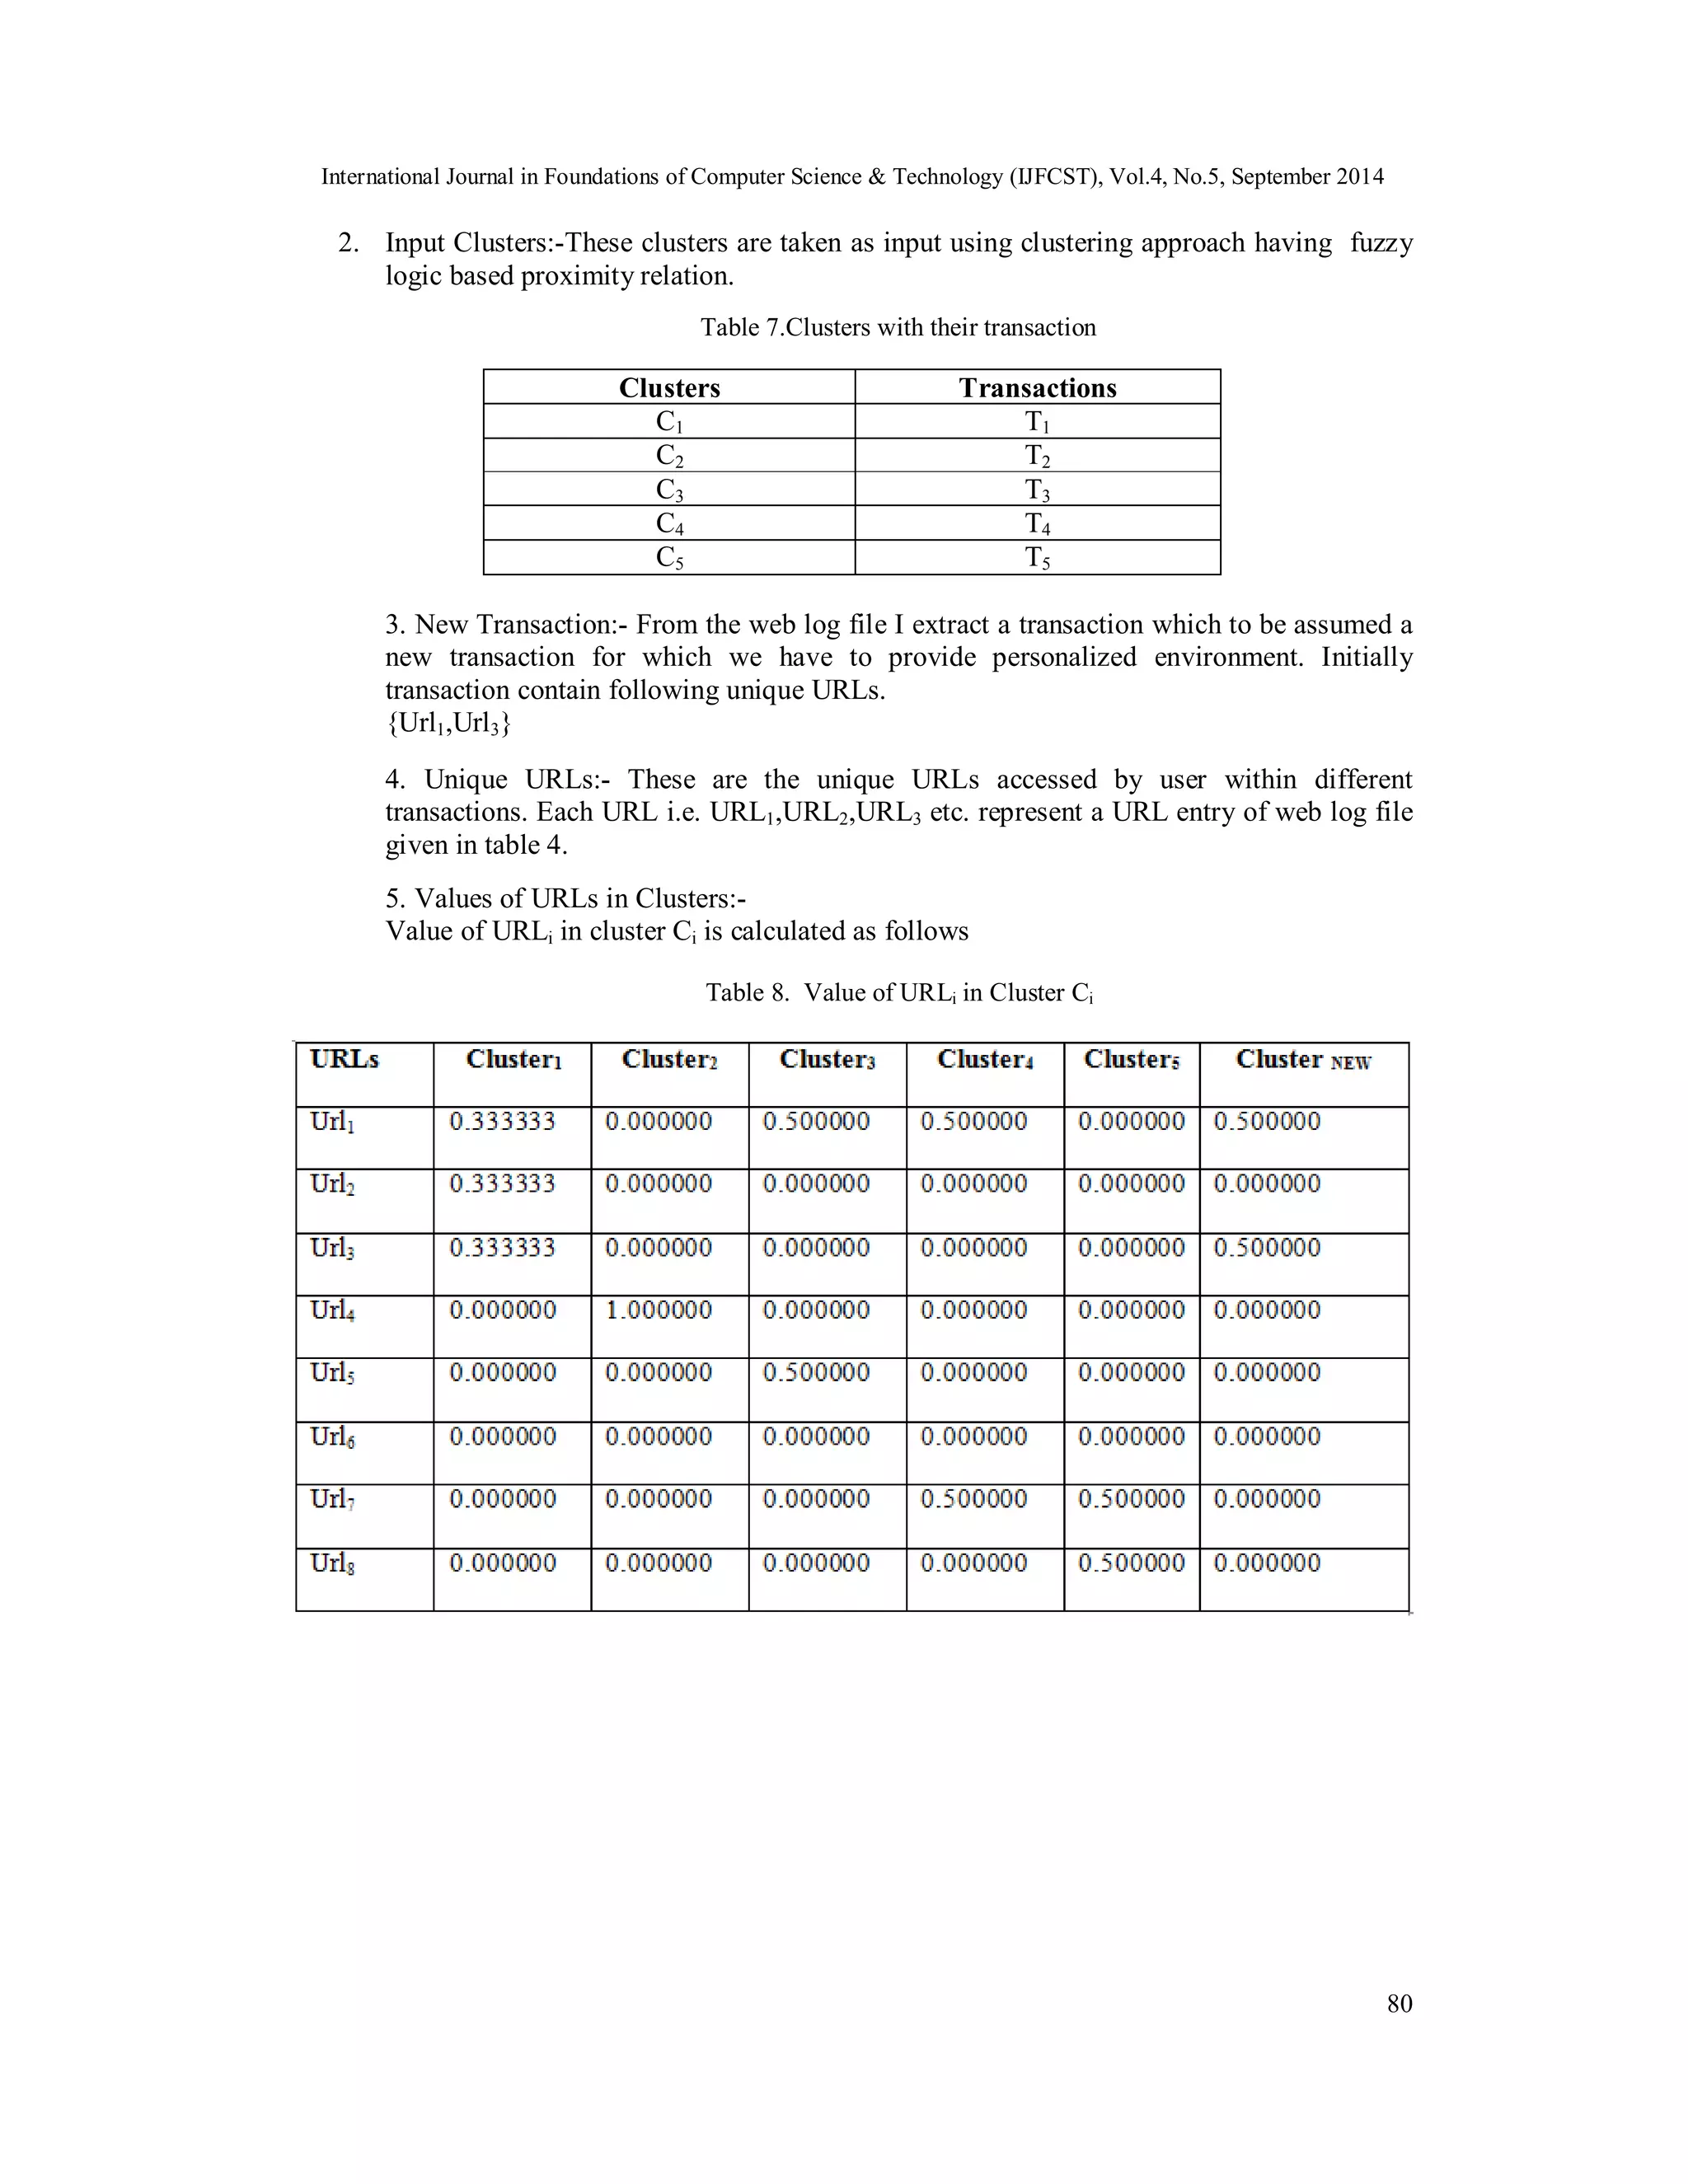
![International Journal in Foundations of Computer Science & Technology (IJFCST), Vol.4, No.5, September 2014 is generated using its logic. The result of this component provides the set of recommendations that will be used to personalize the user interface to the server. 78 Figure 1. Architecture for Web Personalization 6. RECOMMENDATION ALGORITHM For our approach, we use transaction clusters which are obtained from a fuzzy logic based method. Transaction clustering will result in a set C = {c1, c2, …, ck} of clusters, where each Ci is a subset of T, i.e., a set of user transactions. Each cluster represents a group of users with "common" access patterns. Generally transaction clusters are not an effective way of capturing a combined view of common user profiles. Each transaction cluster may contain thousands of transactions involving hundreds of URL. We present a method to personalize the user session by providing a set of URL links dynamically from the highest match score clusters down to lowest match score cluster. Let A = {T1,T2,T3,……Tm} be the set of user transactions and U = {URL1,URL2,URL3,….URLn} be the set of unique URLs in all the transactions here Ti U for I =1 to m.For all Ti,Tj A. Let C1,C2, …., Cm be the transaction clusters obtained from user transaction A with the help of fuzzy logic based similarity relation. STEP-1 For the given input i.e user transactions, accessed URLs and clusters, calculate value of URLi in Cluster Ck. The value of URLi in Cluster Ck is defined as. Definition 1: The proportion of number of occurrence of URLi across transactions in the cluster Ck to the total number of transactions in the cluster is known as the Value of URLi in cluster Ck.[12] {T|URLi Child(T),T Ck} Val(URLi,Ck) =](https://image.slidesharecdn.com/webpersonalizationusingclusteringofwebusagedata-141008021833-conversion-gate02/75/Web-personalization-using-clustering-of-web-usage-data-10-2048.jpg)
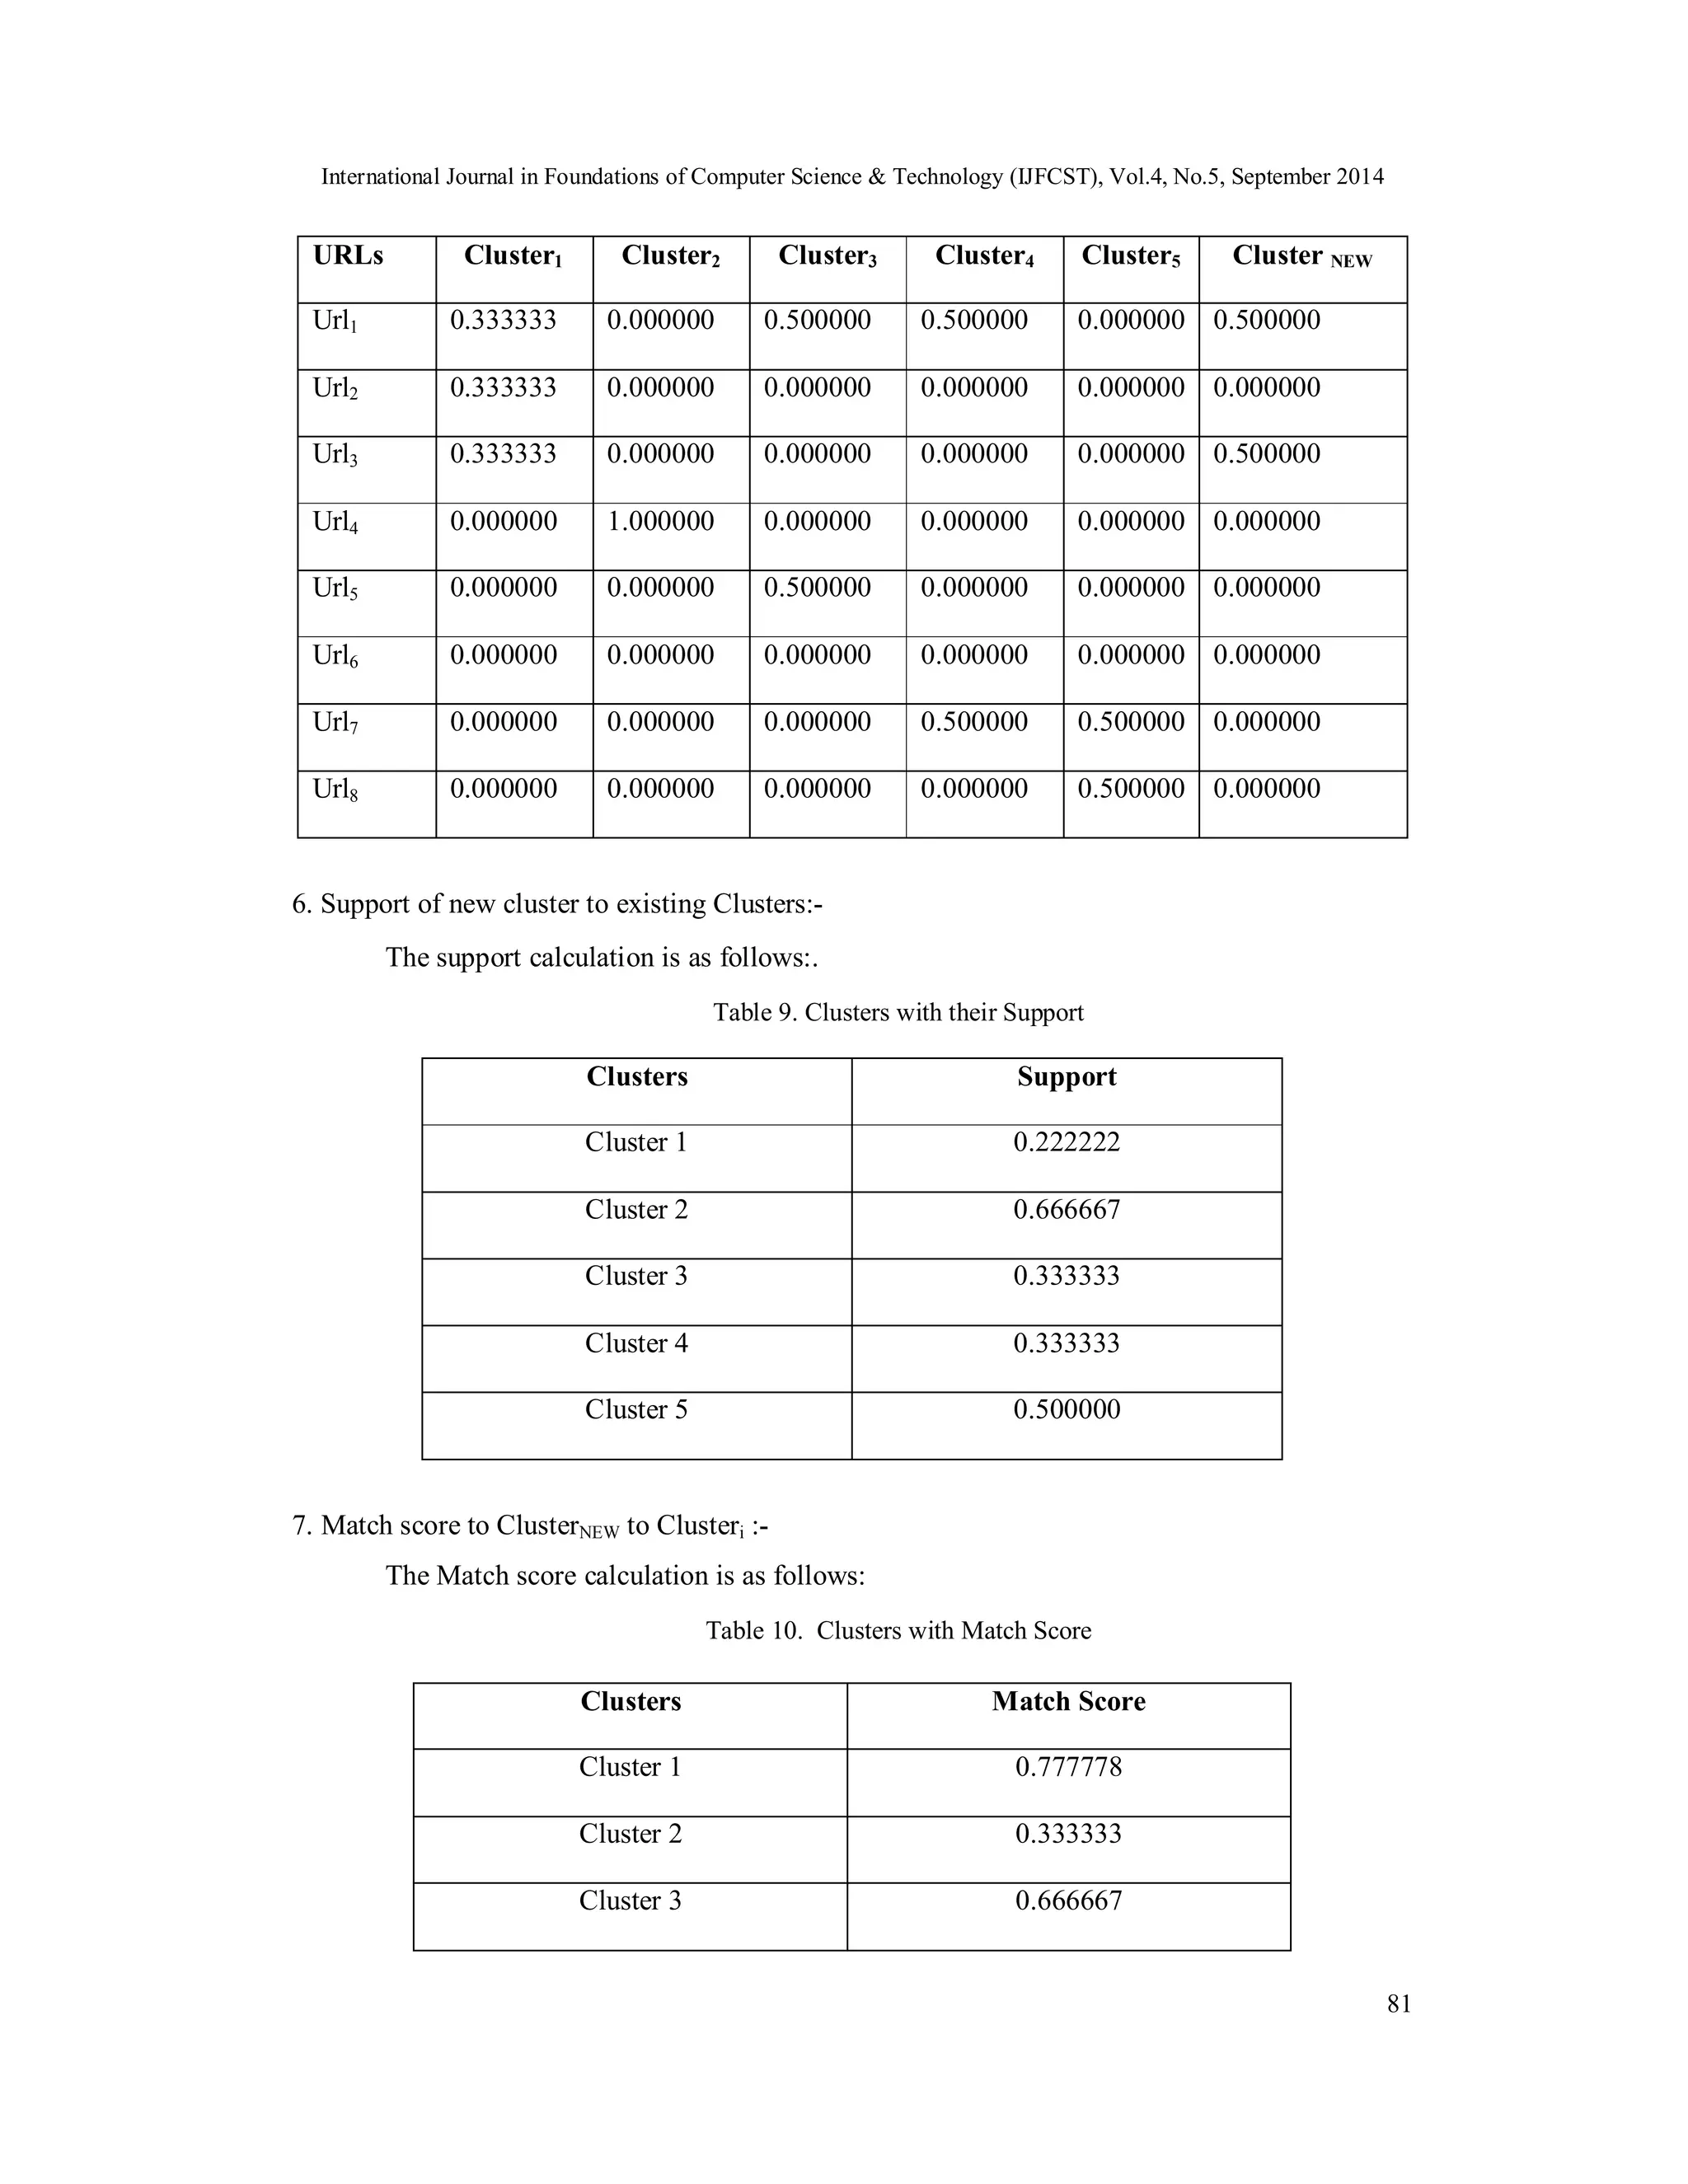
![International Journal in Foundations of Computer Science & Technology (IJFCST), Vol.4, No.5, September 2014 82 Cluster 4 0.666667 Cluster 5 0.500000 Here, highest Match Score corresponds to Cluster1. Hence, user 65.54.188.68 will be provided Cluster 1 as preference set. i.e. URLs of transactions belongs to cluster1 will be suggested as preference links for providing the personalized environment. 6.2 Evaluation of Recommendation Effectiveness In order to evaluate the recommendation effectiveness for given model, We measured the performance using three different standard measures, namely, precision, coverage, and the F1 measure.[13] These measures are adaptations of the standard measures, precision and recall, often used in information retrieval. Table 11. Measures values for Data Sets Data Set Precision Coverage F1 Measure Data Set 1 IP Address: 65.54.188.68 0.33 1.0 0.4962 Data Set 2 IP Address: 59.94.43.47 0.5714 1.0 0.7261146 Data Set 3 IP Address:70.84.233.186 0.4705 1.0 0.6394558 Data Set 4 IP Address:61.0.56.2 0.5625 0.9 0.690411 Data Set 5 IP Address:67.180.89.140 0.63636 1.0 0.773 In the context of personalization, precision is used to identify the degree to which accurate recommendations can be produced by the recommendation engine, while coverage identifies the ability of the recommendation engine to produce all of the URLs that are likely to be visited by the user. A low precision in this context will likely result in irritated visitors who are not interested in the recommendation list, while low coverage will show the inability of the site to generate relevant recommendations at the moment the user interact with the site. Personalization systems are often evaluated based on two statistical measures, namely precision and coverage. In our case of personalization approach, the proposed model is capable of producing recommendation sets with high coverage and high F1 measure with moderate precision. 7. CONCLUSIONS In this paper, we proposed a method to construct clusters based on the concept hierarchy and - similarity. The new model to cluster the web user transactions based on the concept hierarchy of web usage data and fuzzy proximity relations of user transactions was tested for its effectiveness. The fuzzy concept ensemble to identify amount of similarities between user transaction clusters. The user specified value is an important factor based on which the performance of cluster depends. A domain expert can choose the value of [0,1] based on her/his experience. That is, the approach makes use of domain knowledge for forming clusters and it is very helpful especially for e-commerce application that uses these user transaction clusters to make personalized environment for the Web users.](https://image.slidesharecdn.com/webpersonalizationusingclusteringofwebusagedata-141008021833-conversion-gate02/75/Web-personalization-using-clustering-of-web-usage-data-14-2048.jpg)
![International Journal in Foundations of Computer Science & Technology (IJFCST), Vol.4, No.5, September 2014 Employing Web usage mining techniques for personalization is directly related to the discovery of effective profiles that can successfully capture relevant user navigational patterns. In this paper, we also proposed an approach for automatic discovery of user interest domain. A web site should permit users to make their choices in natural way. This is possible by giving broad coverage and understandable choices, so that the user can formulate an easy choice that best suited to their needs. The proposed model is capable of producing recommendation sets with high coverage and high F1 measure with moderate precision. REFERENCES [1] Lin HuaXu, Hong Liu. Web User Clustering Analysis based on KMeans Algorithm, 2010 83 International Conference on Information, Networking and Automation (ICINA). [2] Abdolreza Mirzaei and Mohammad Rahmati A Novel Hierarchical-Clustering-Combination Scheme Based on Fuzzy-Similarity Relations, IEEE Transactions On Fuzzy Systems, VOL. 18, NO. 1, FEBRUARY 2010. [3] Dimitrios Pierrakos and Georgios Paliouras, Personalizing Web Directories with the Aid of Web Usage Data, IEEE Transactions On Knowledge And Data Engineering, Vol. 22, NO. 9, SEPTEMBER 2010. [4] Quan, Thanh Tho, Hui, Siu Cheug and Cao, Tru Hoang. A Fuzzy FCA-based Approach to Conceptual Clustering for Automatic Generation of Concept Hierarchy on Uncertainty Data, V. Sn´a¡sel, R. B¡elohl´avek (Eds.): CLA 2004, pp. 1–12, ISBN 80-248-0597-9.V¡SB – Technical University of Ostrava, Dept. of Computer Science, 2004. [5] B.Mobasher, R.Colley and J.Srivastava. Automatic personalization based on web usage mining, Commun. ACM 43,8 (2000) 142-151. [6] Yun Zhang, Boqin Feng, Yewei Xue, A New Search Results Clustering Algorithm based on Formal Concept Analysis, Fifth IEEE International Conference on Fuzzy Systems and Knowledge Discovery, 2008 [7] Halkidi , Maria ,Batistakis, yannis ,et.al., On Clustering Validation Techniques, Journal of Intelligent Information Systems, 17:2/3, 107– 145, 2001 [2] Gizem, Aksahya & Ayese, Ozcan (2009) Coomunications & Networks, Network Books, ABC Publishers. [8] Dragos Arotariteia, Sushmita Mitra. “Web mining: a survey in the fuzzy framework” ELSEVIER, Fuzzy Sets and Systems 148 (2004) [9] Magdalini Eirinaki And Michalis Vazirgiannis .”Web Mining for Web Personalization” ACM Transactions on Internet Technology, Vol. 3, No. 1, February 2003 [10] The Personalization Consortium http://www.personalization.org/personalization.html [11] Web site personalization http://www 128.ibm.com/developerworks/websphere/library /techarticles/hipods/personalize.html [12] B.Mobasher, R.Colley and J.Srivastava. “Automatic personalization based on web usage mining” Commun. ACM 43,8 (2000) [13] Bamshad Mobasher, Honghua Dai, Tao Luo and Miki Nakagawa “Discovery and Evaluation of Aggregate Usage Profiles for Web Personalization” School of Computer Science, Telecommunications, and Information Systems DePaual University, Chicago, Illinois, USA. http://ai.stanford.edu/users/ronnyk/WEBKDD-DMKD/Mobasher.pd Authors Bhawesh Kuamr Thakur received the M.Tech degree in CSE from the M.C. University, Bhopal, India. He is currently working toward the PhD degree in computer science at the Department Of Computer Science & Engineering, Integral University, Lucknow, India. He is working as a faculty member in the Bansal Institute of Engineering & Technology, Lucknow, an UPTU, Lucknow affiliated Engineering College. His research interests lie in the areas of Web mining and Web personalization.](https://image.slidesharecdn.com/webpersonalizationusingclusteringofwebusagedata-141008021833-conversion-gate02/75/Web-personalization-using-clustering-of-web-usage-data-15-2048.jpg)

The document discusses an approach to web personalization through clustering of web usage data by employing concept hierarchies. It explores the significance of web mining, specifically usage mining, in understanding user interactions with web environments to offer tailored services. The process involves preprocessing web data, addressing high dimensionality challenges, and implementing clustering techniques to enhance user experience on websites.