![Matt Bailey SiteLogic [email_address] Fun with Stats The Joy of Analytics](https://image.slidesharecdn.com/web-analytics-course-8326/75/Web-Analytics-Course-1-2048.jpg)


![Matt Bailey [email_address] www.SiteLogic.com](https://image.slidesharecdn.com/web-analytics-course-8326/75/Web-Analytics-Course-88-2048.jpg)

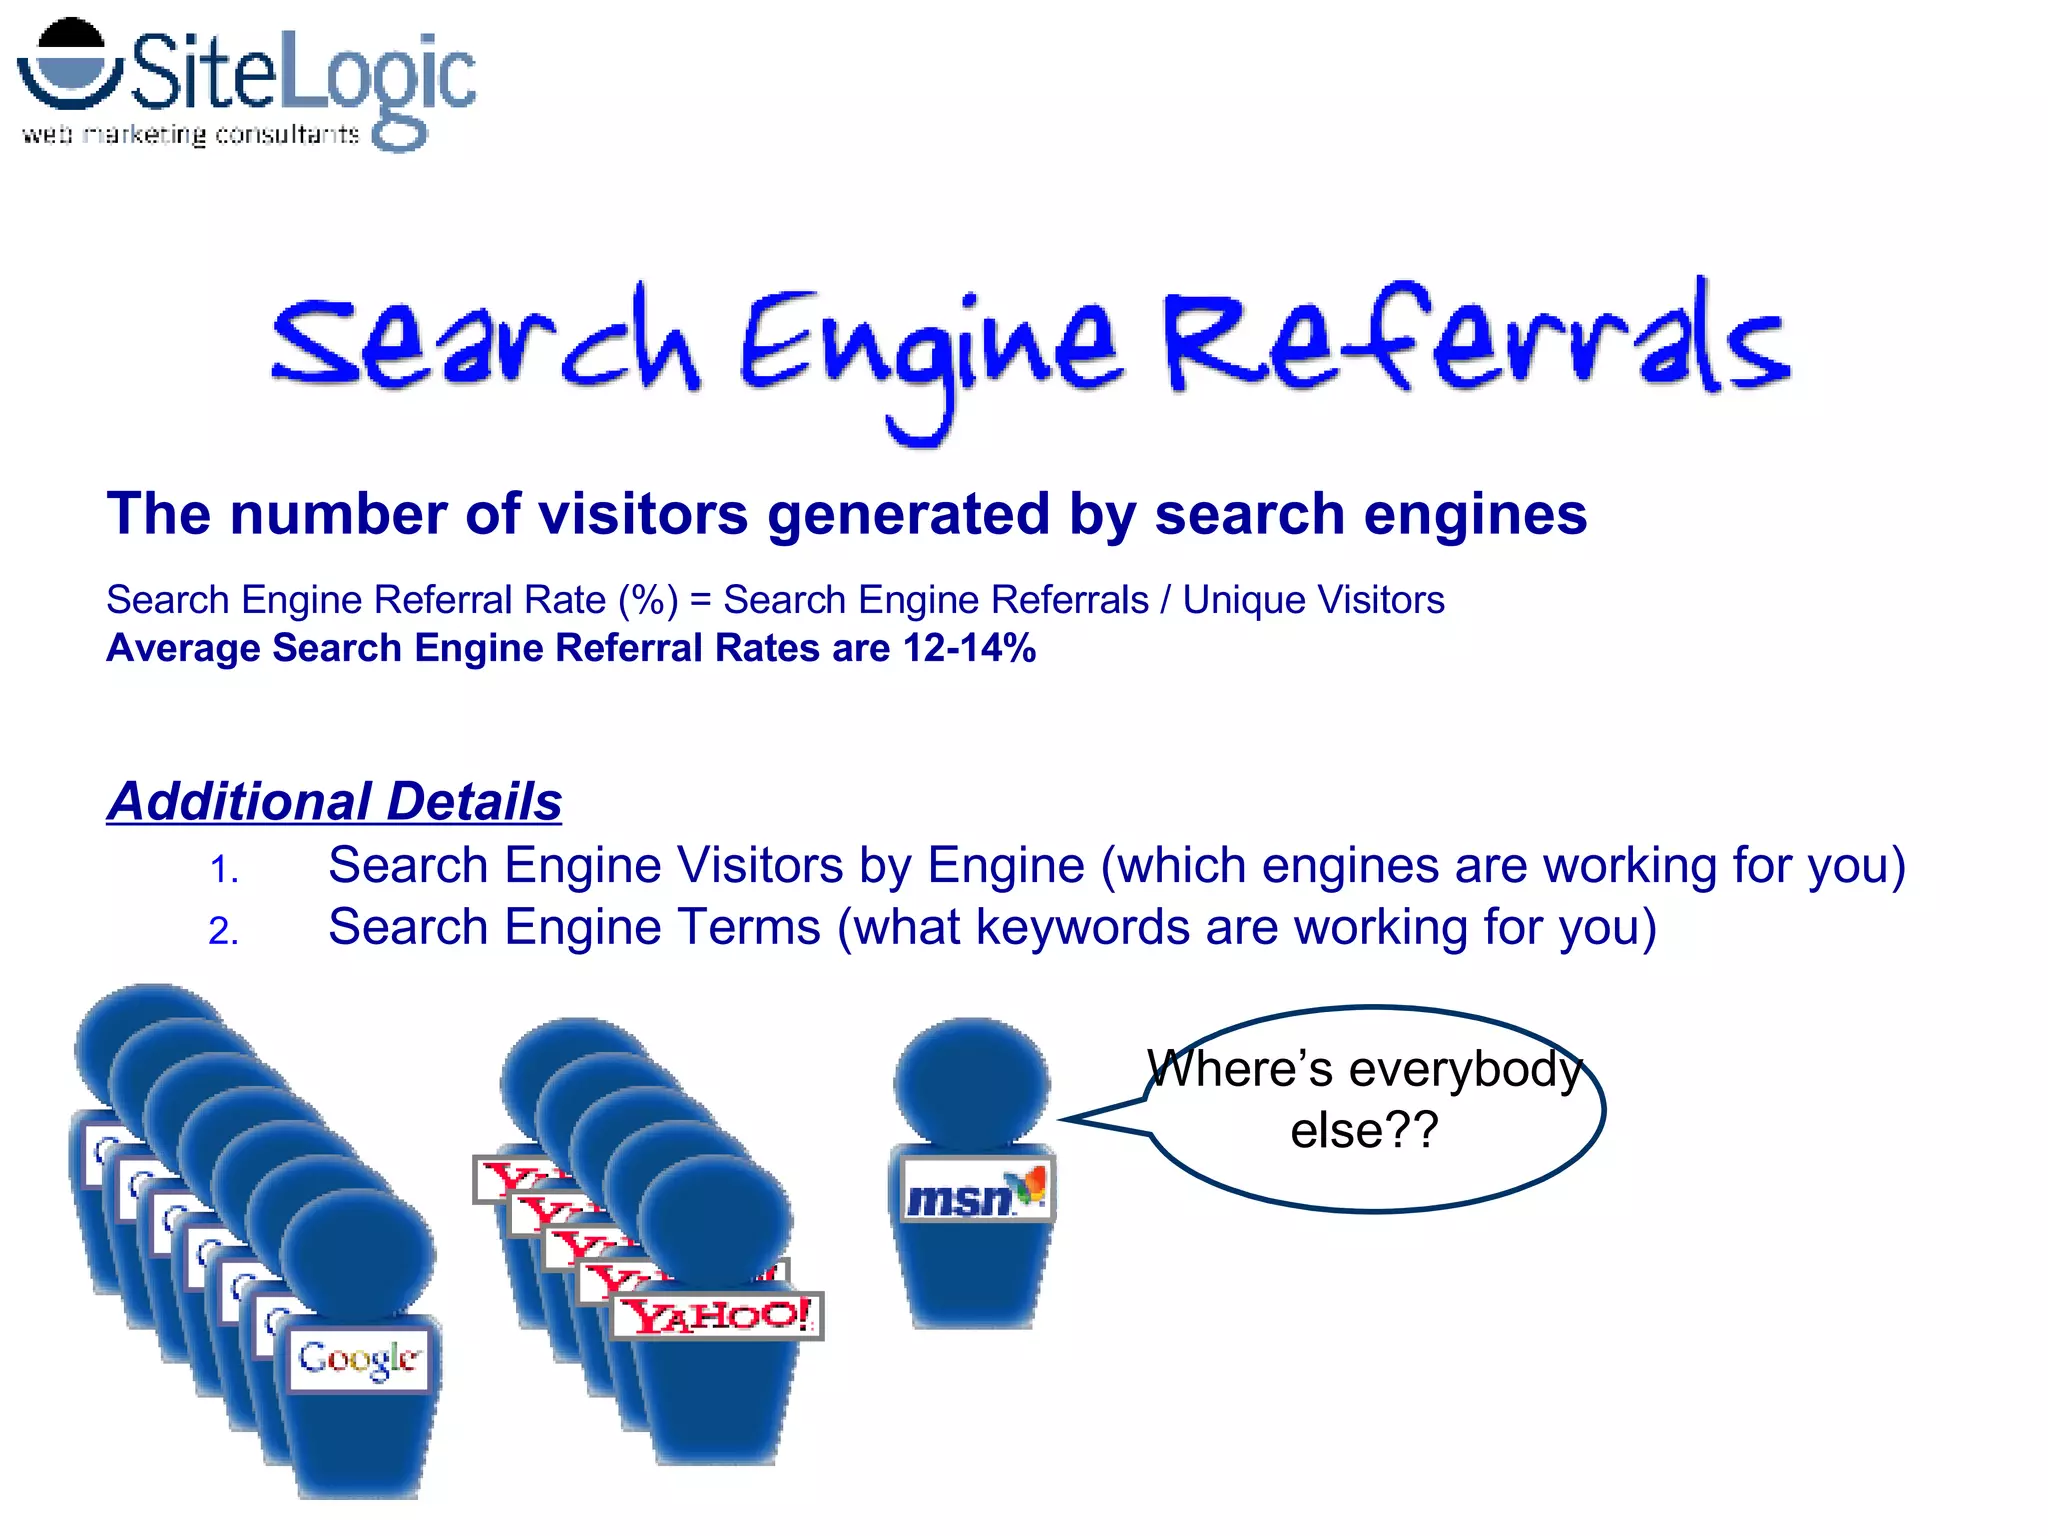
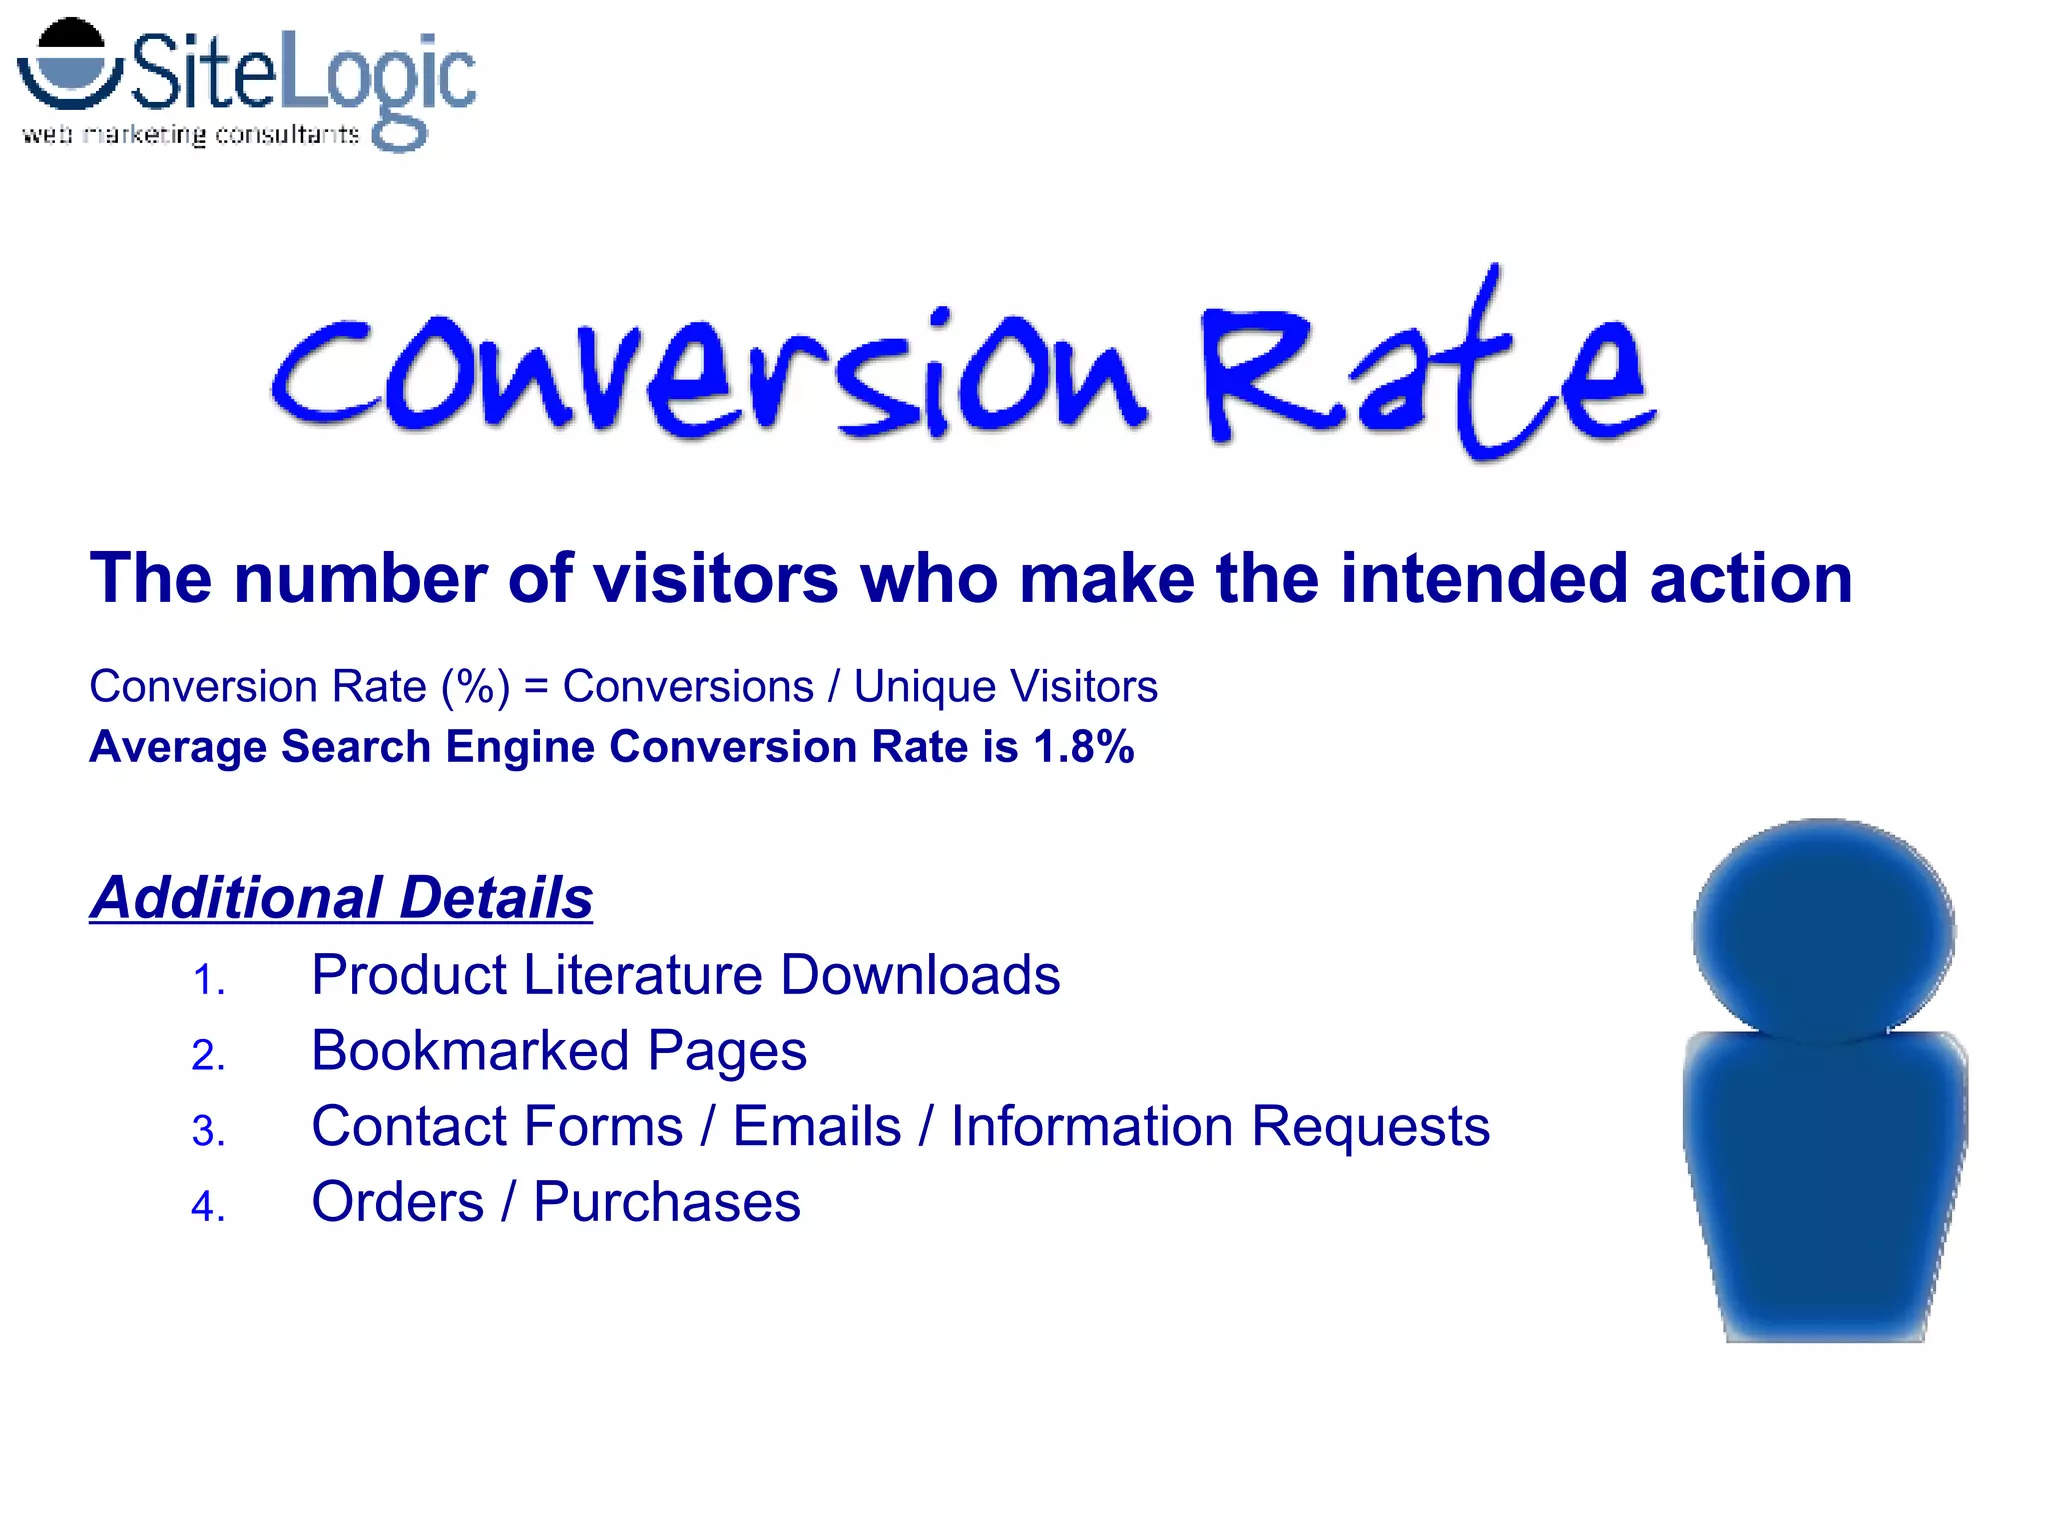
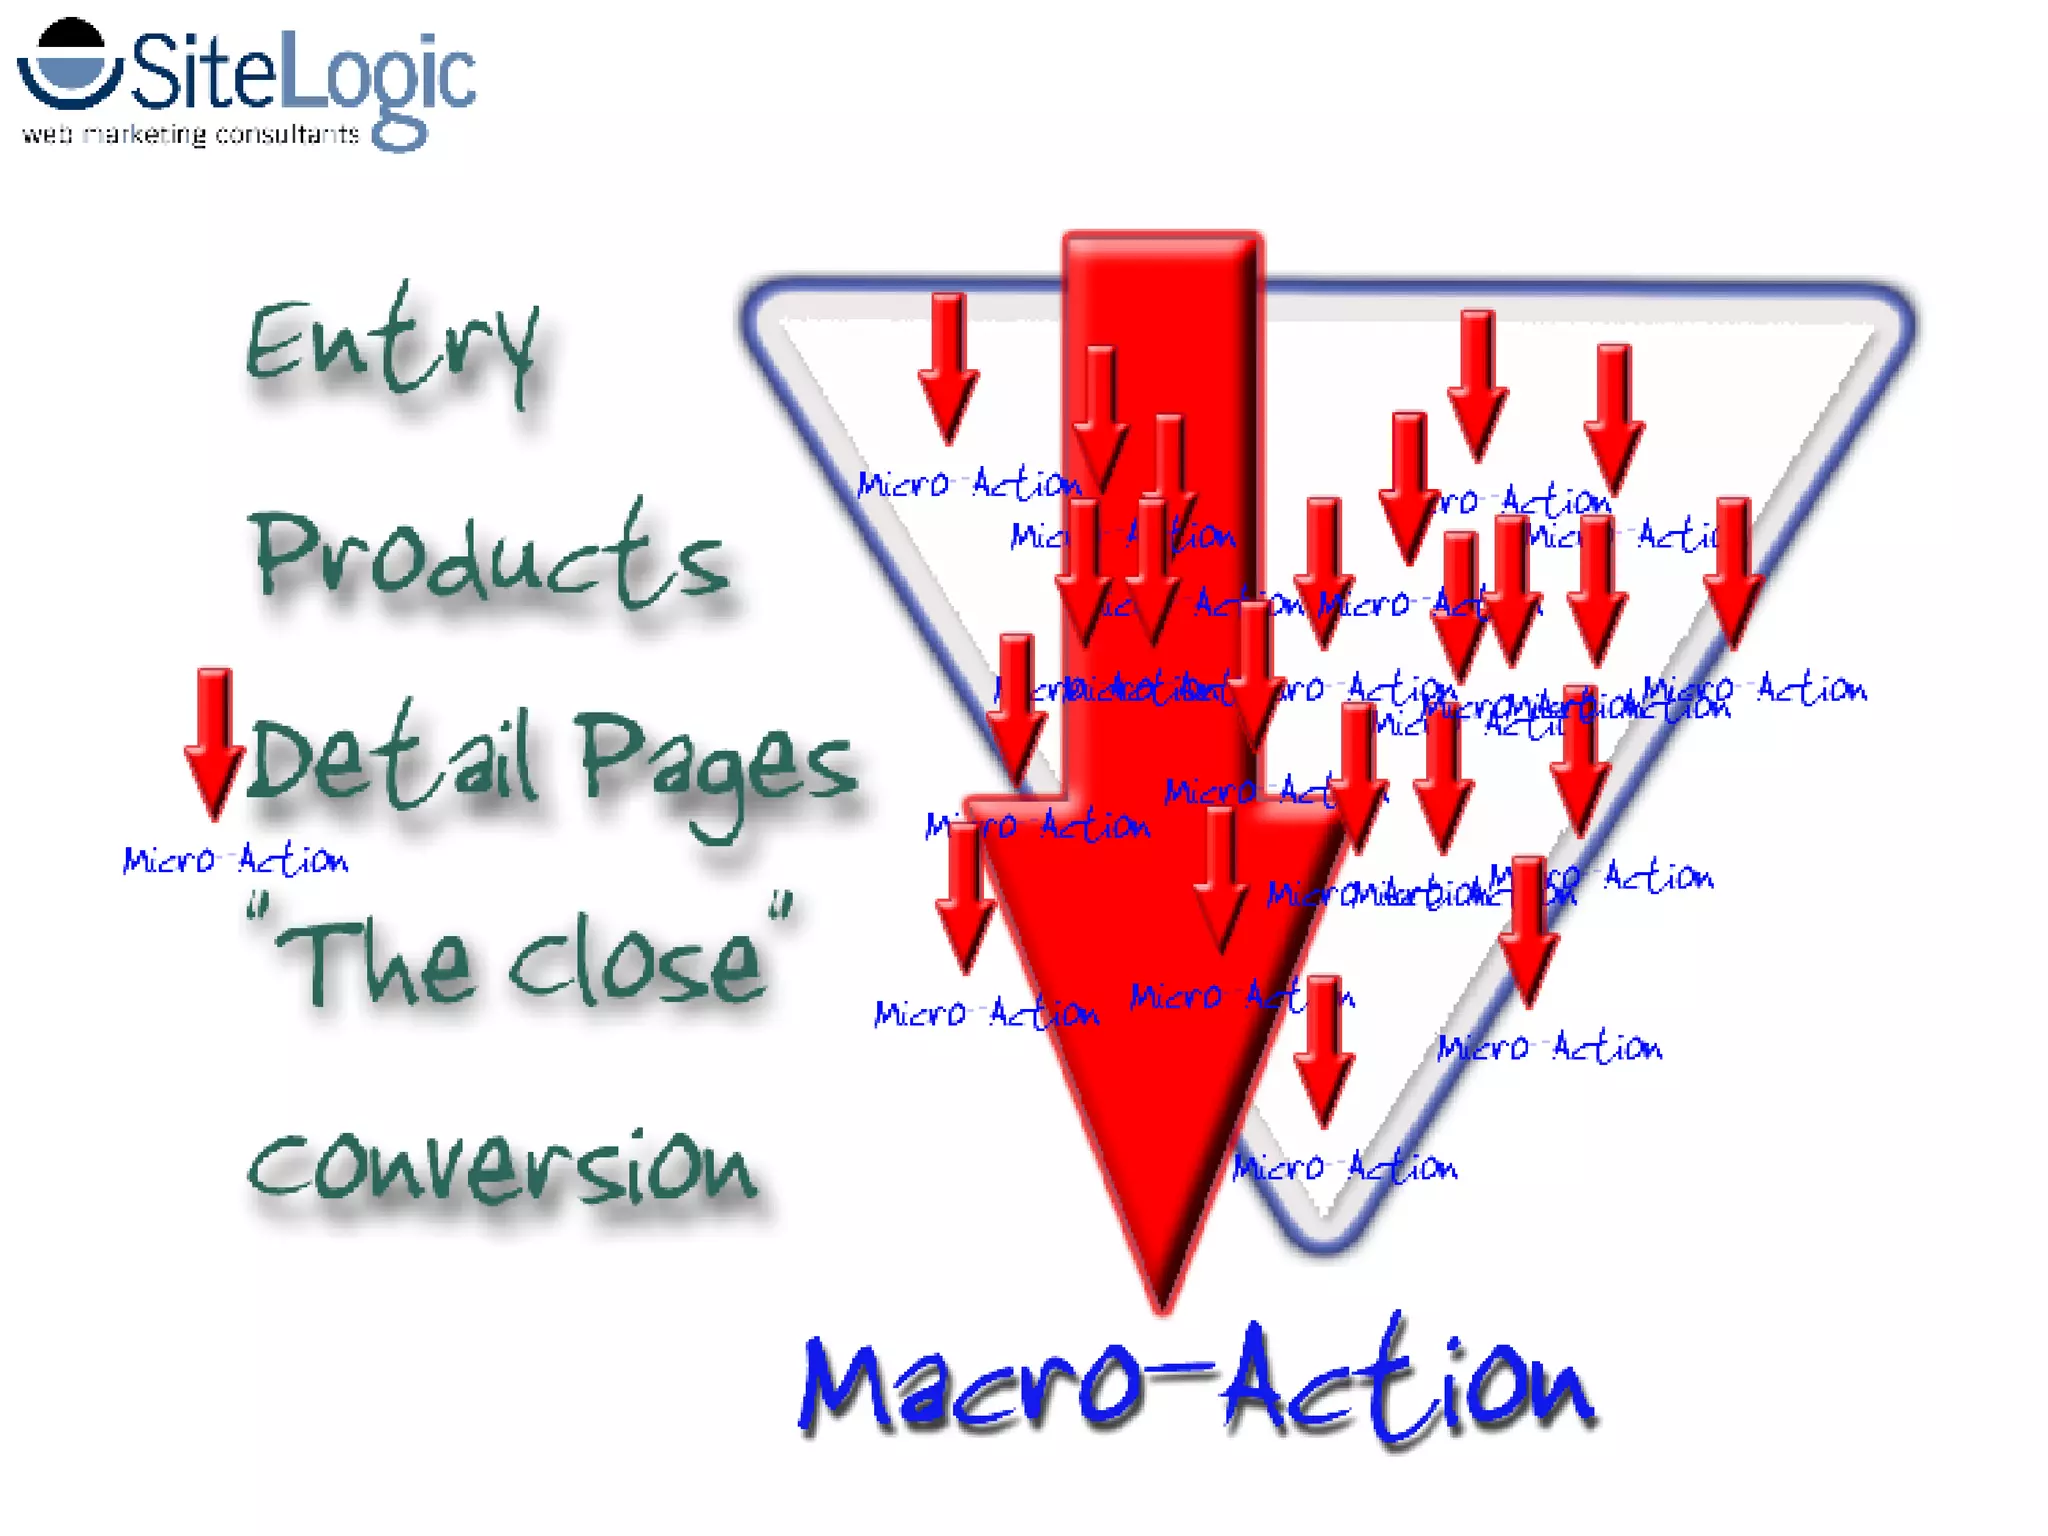
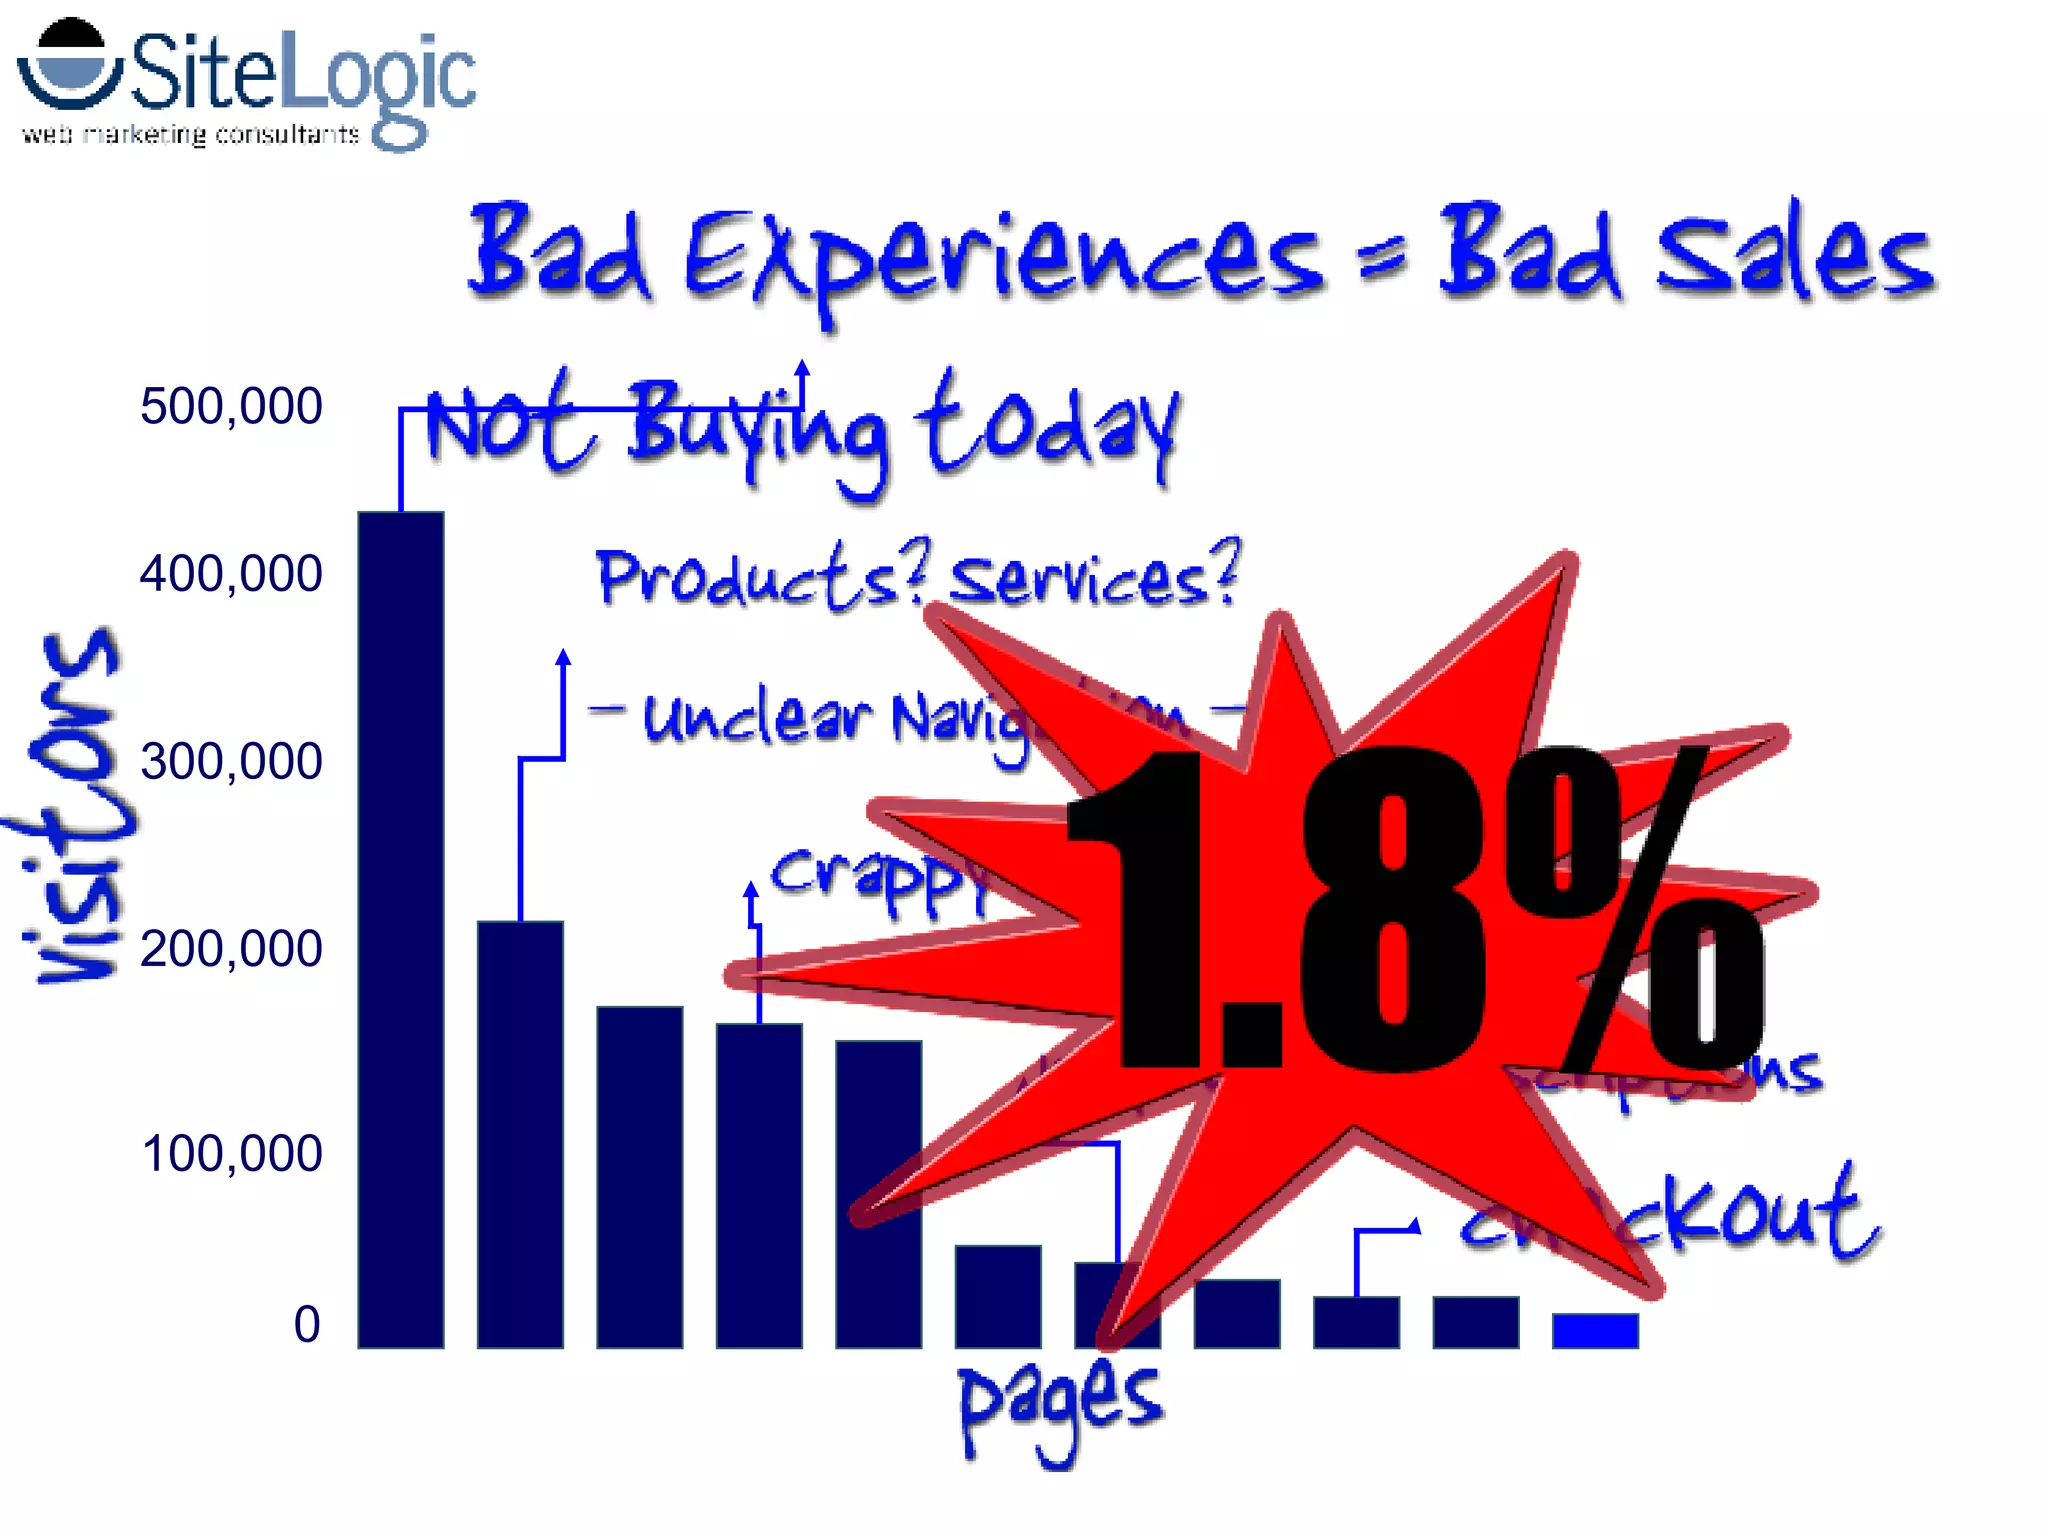
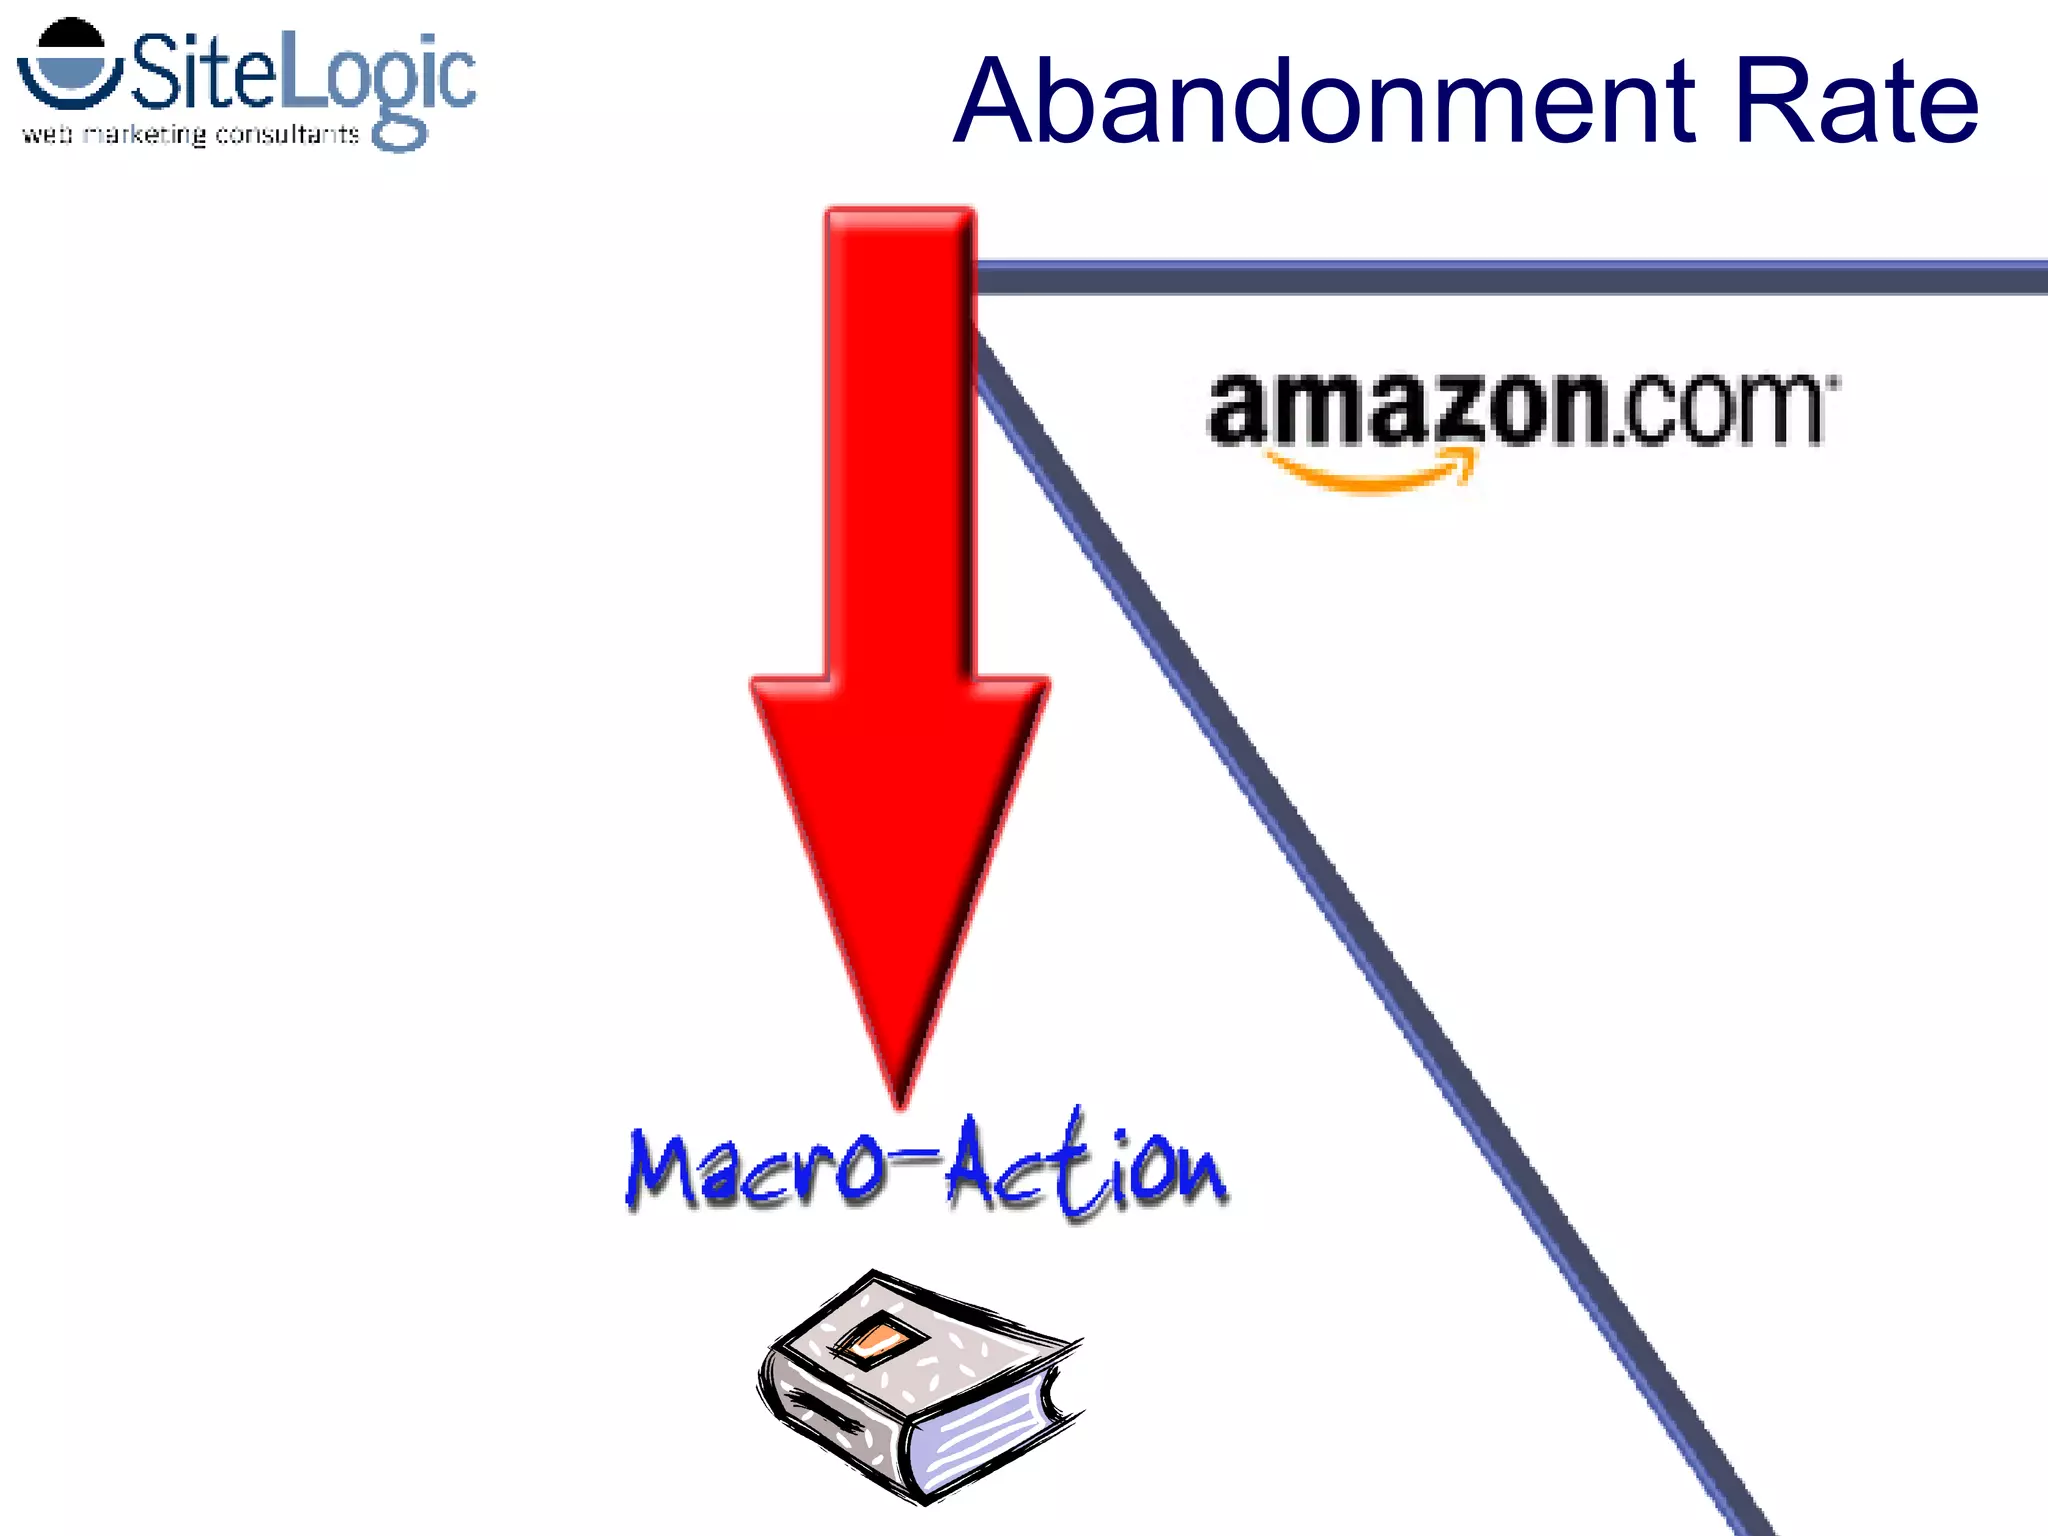
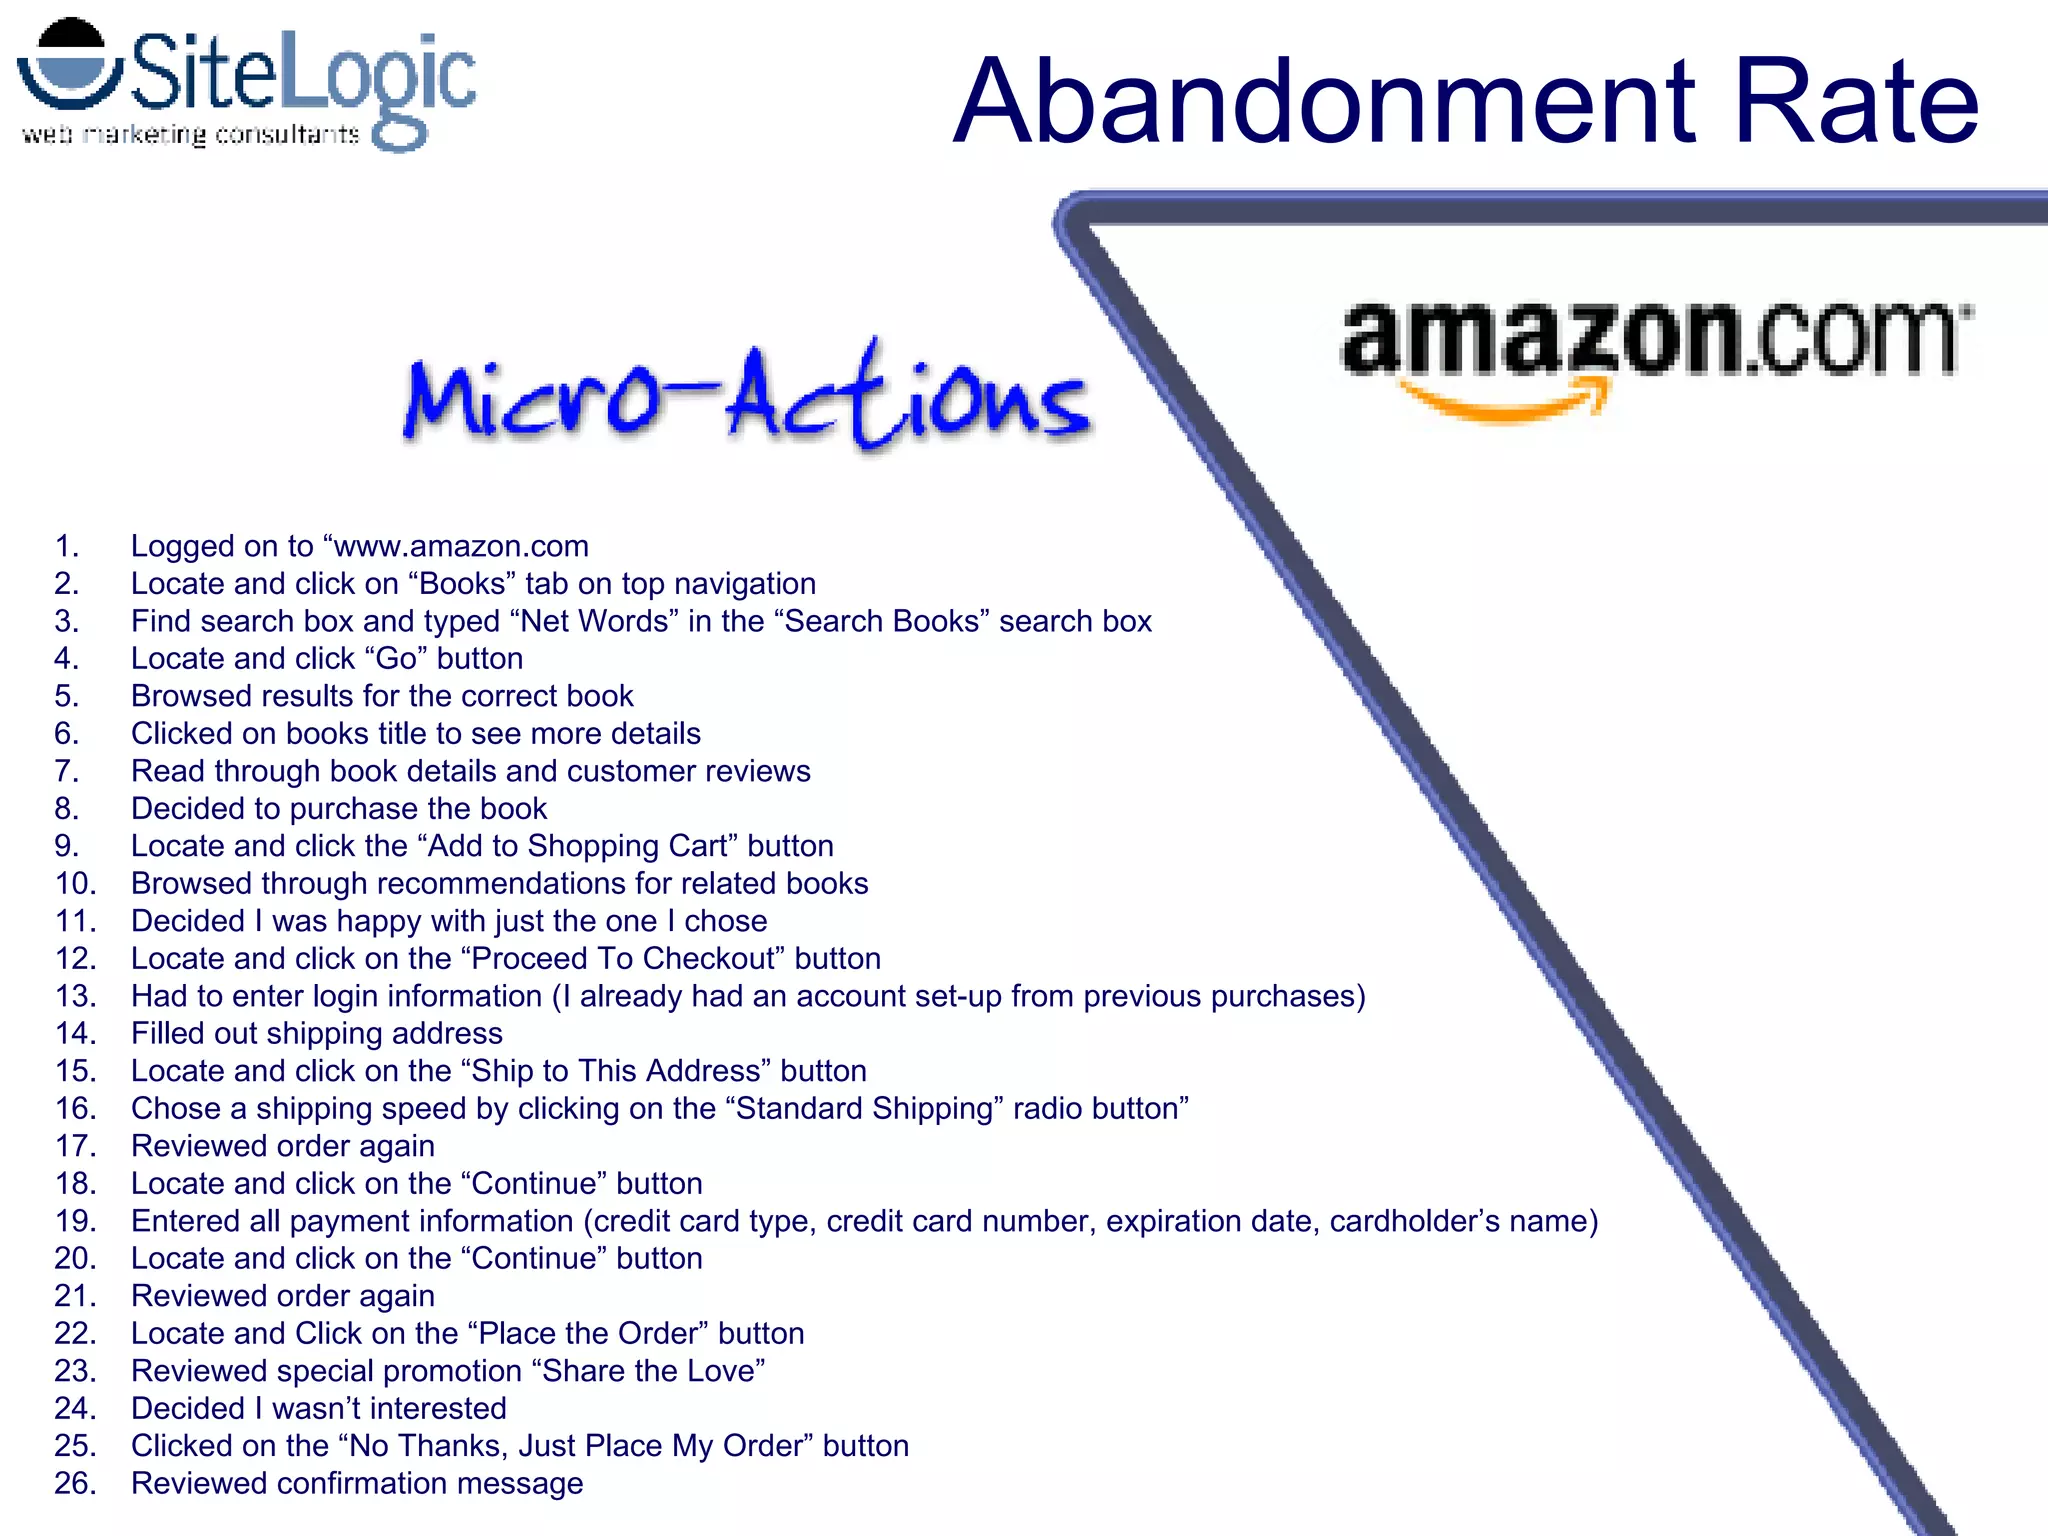
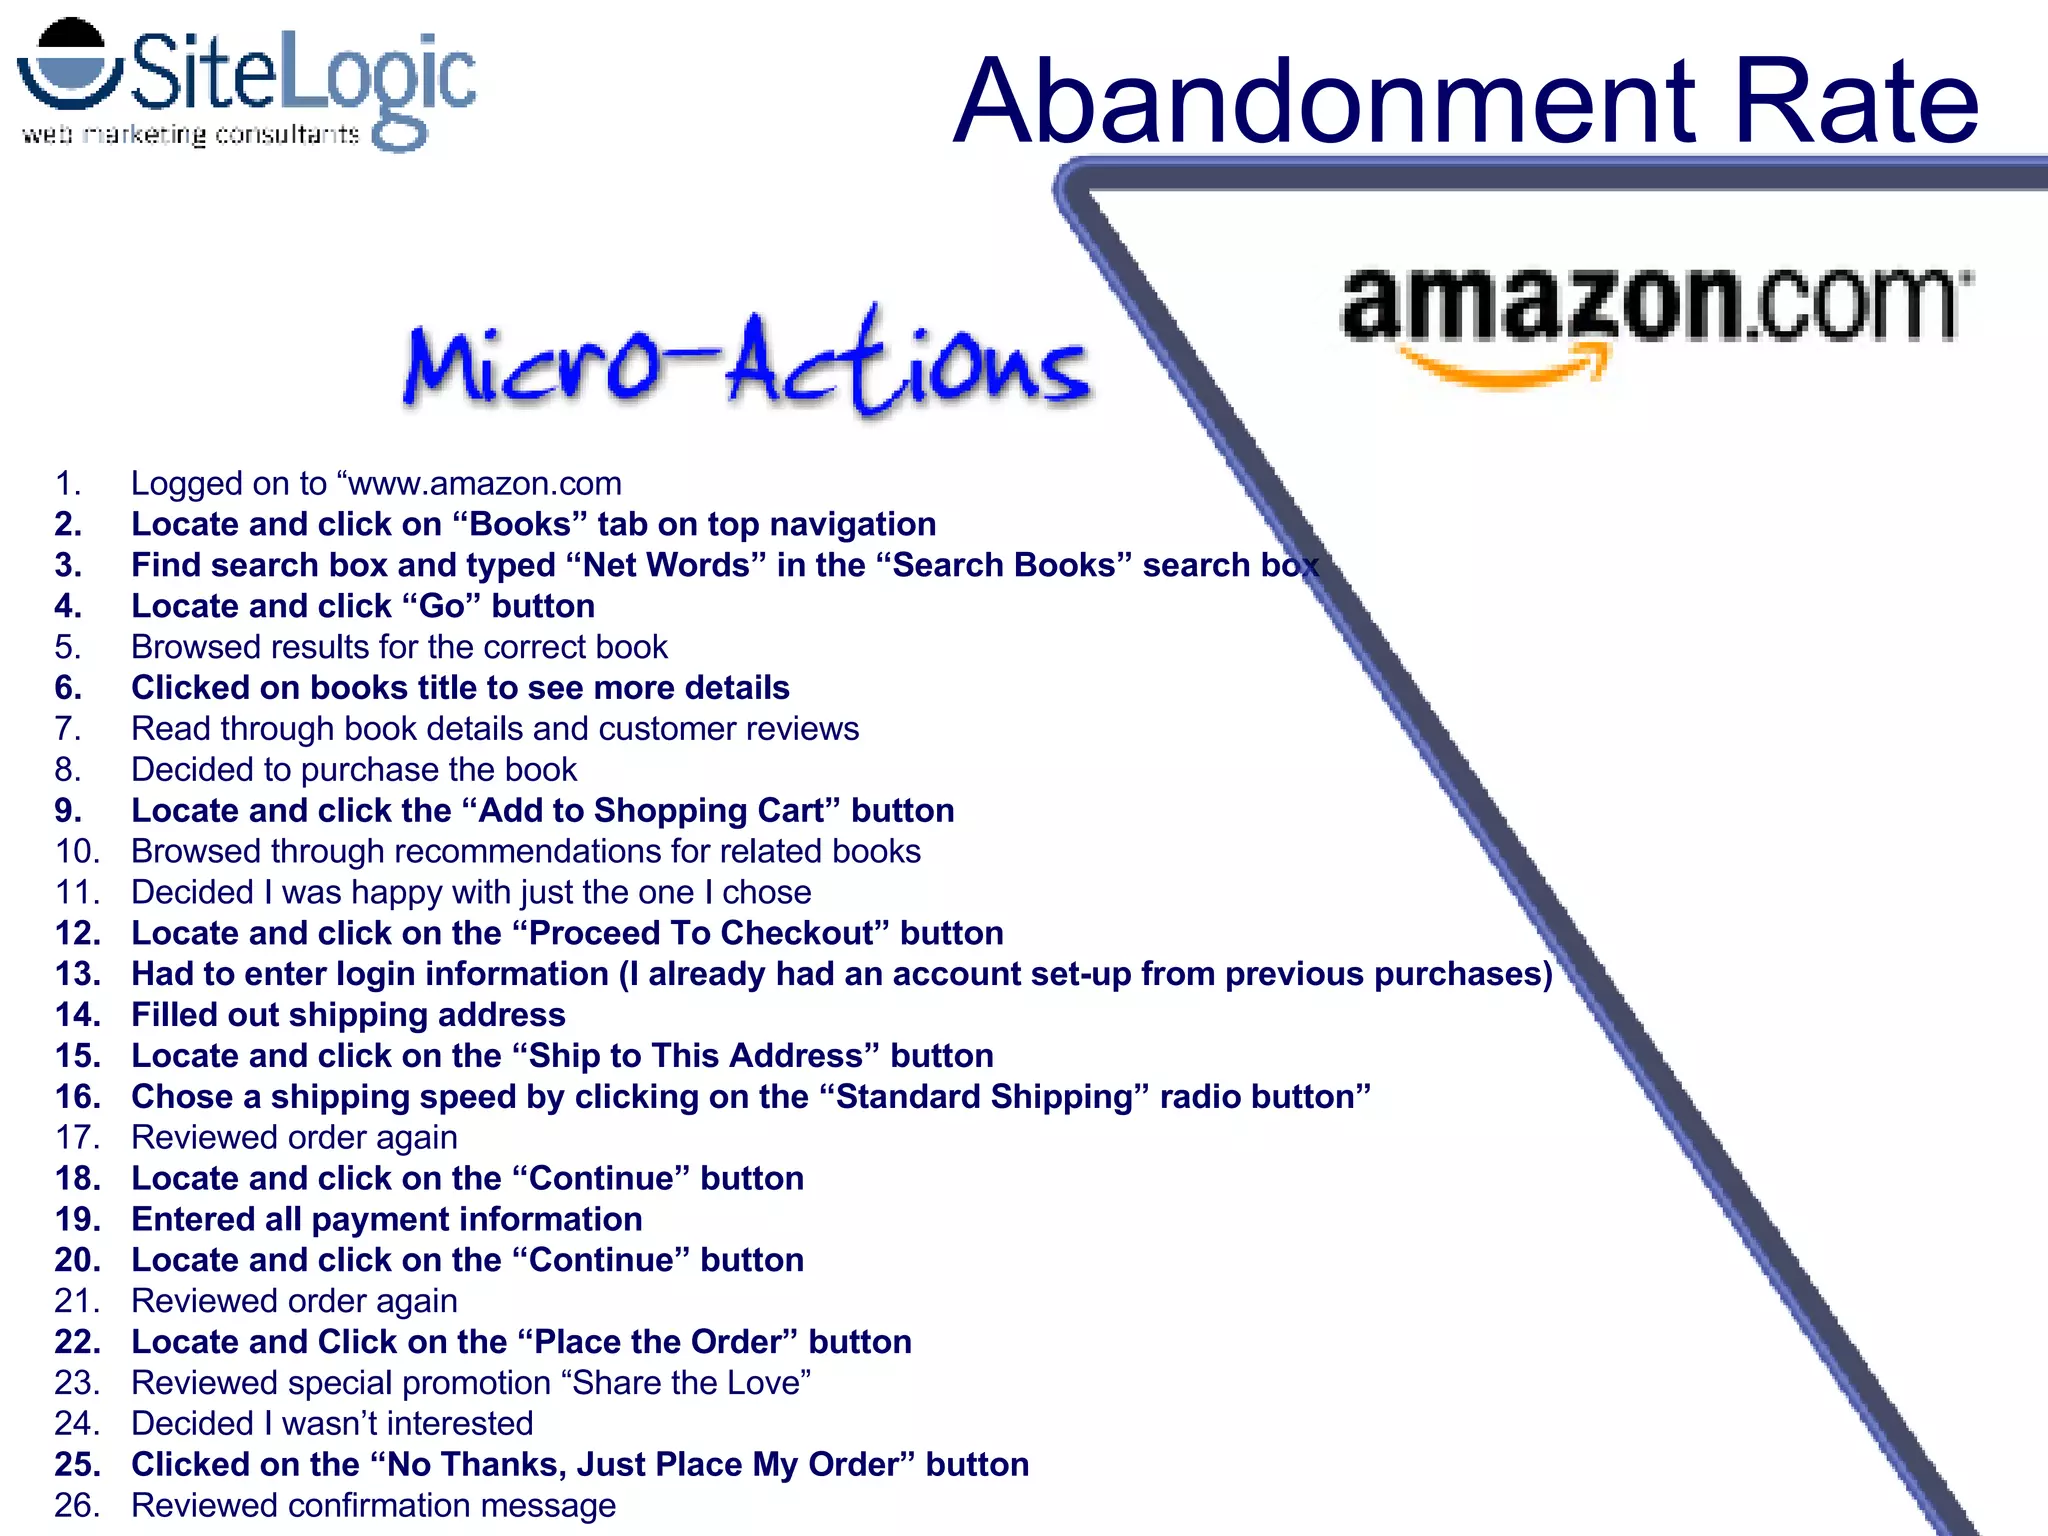
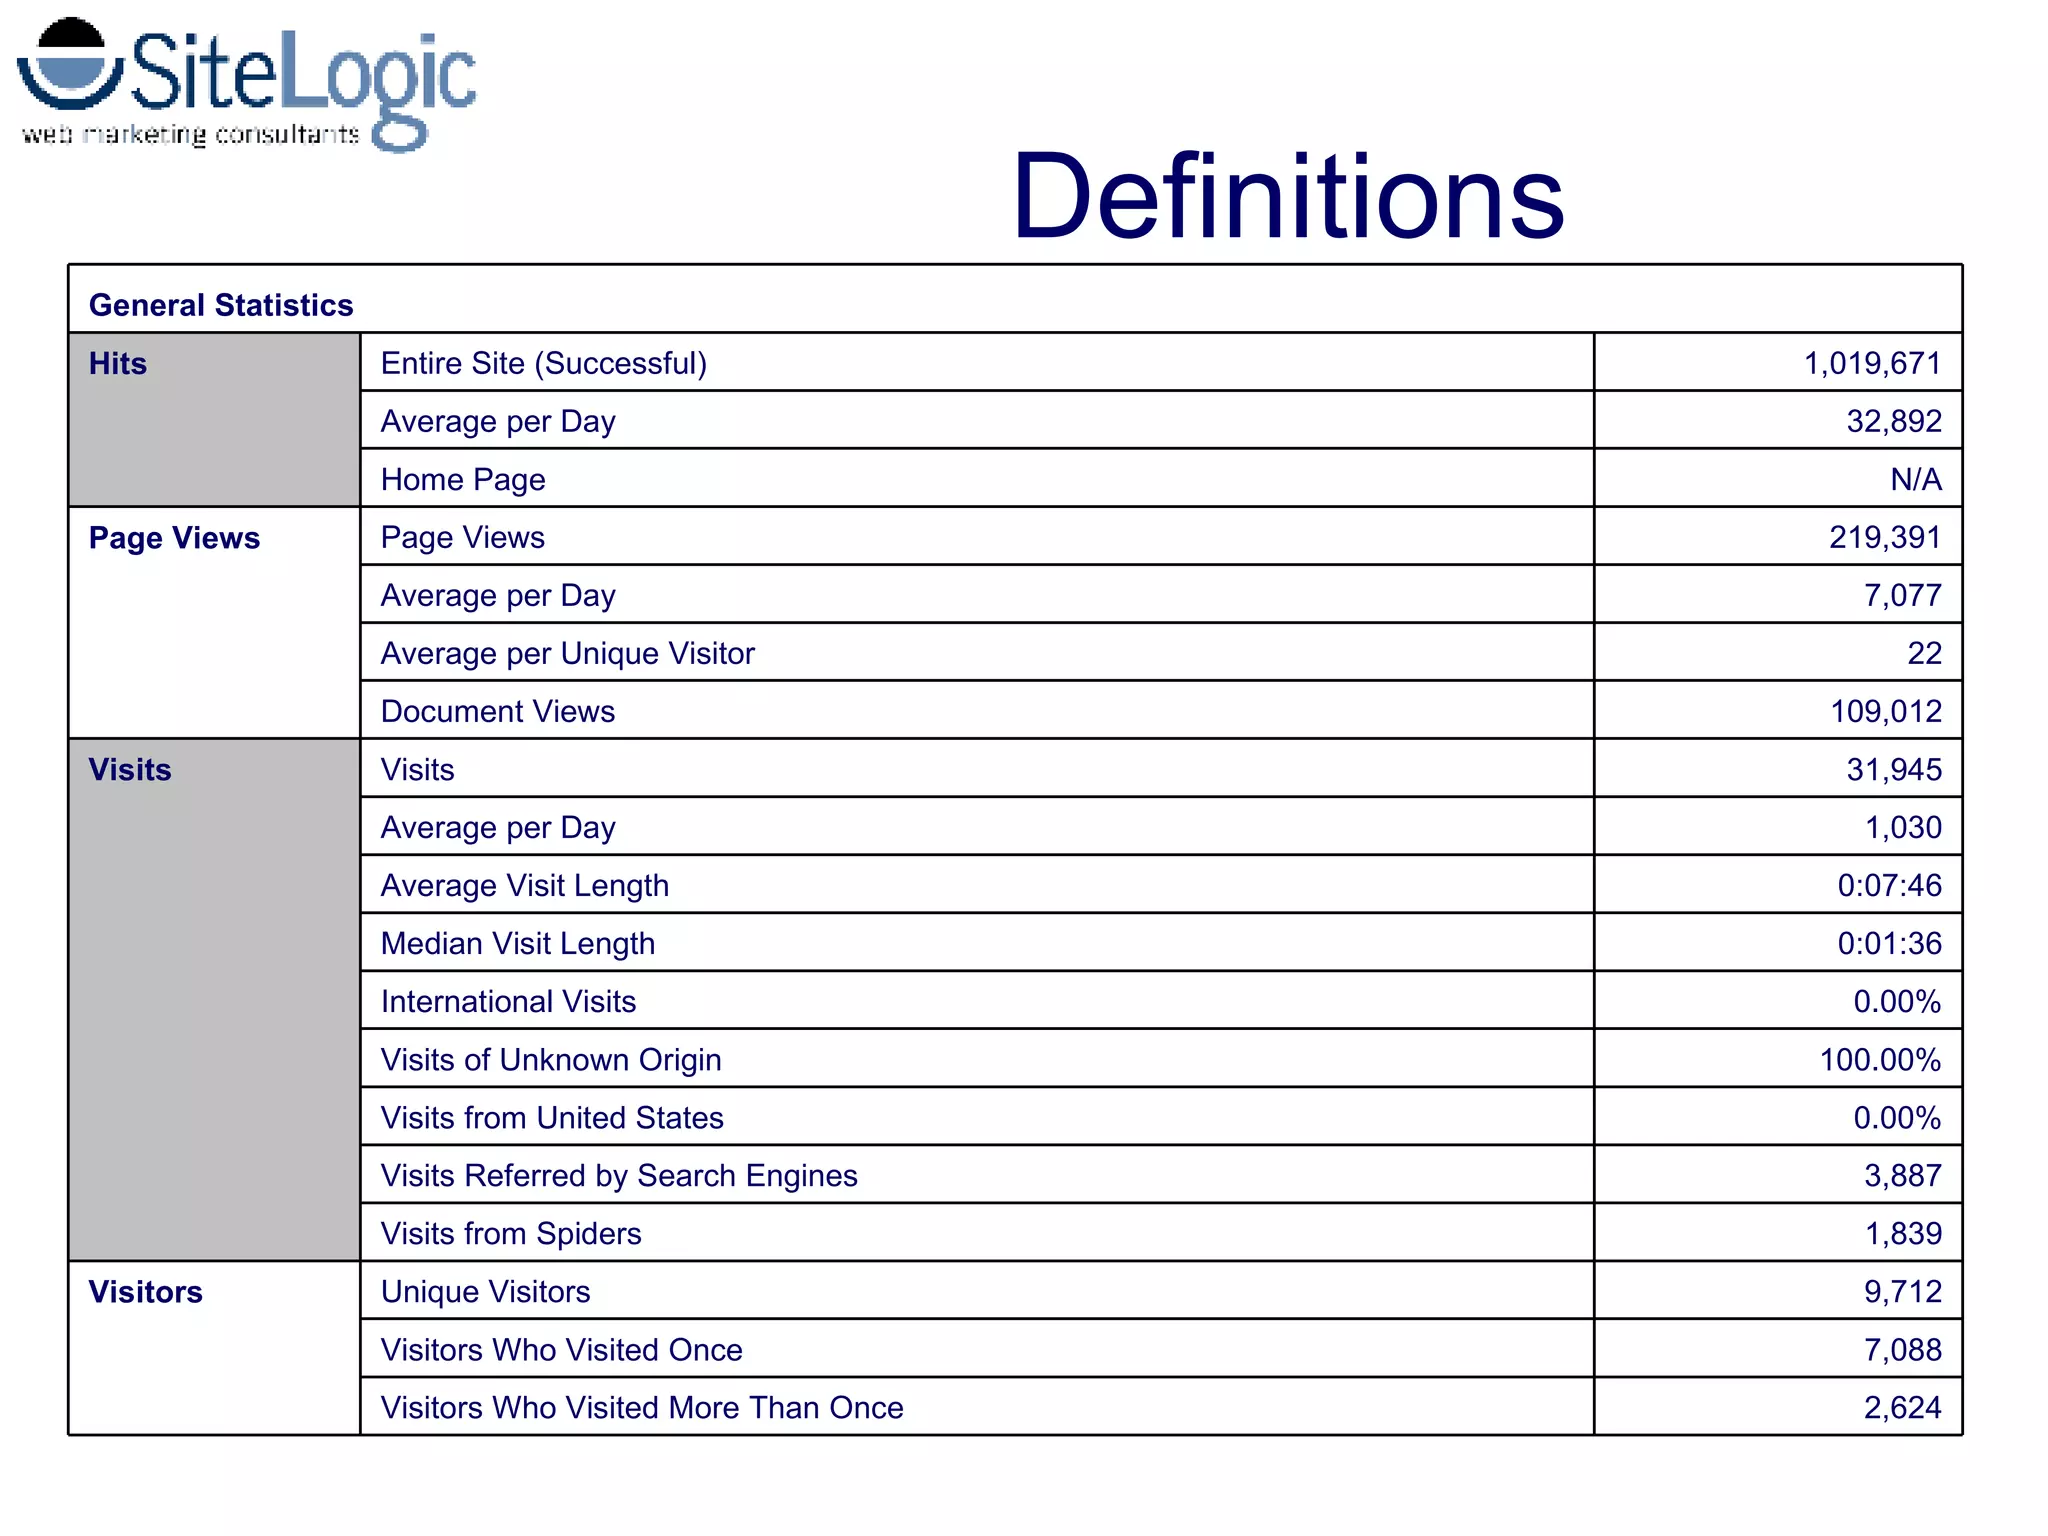
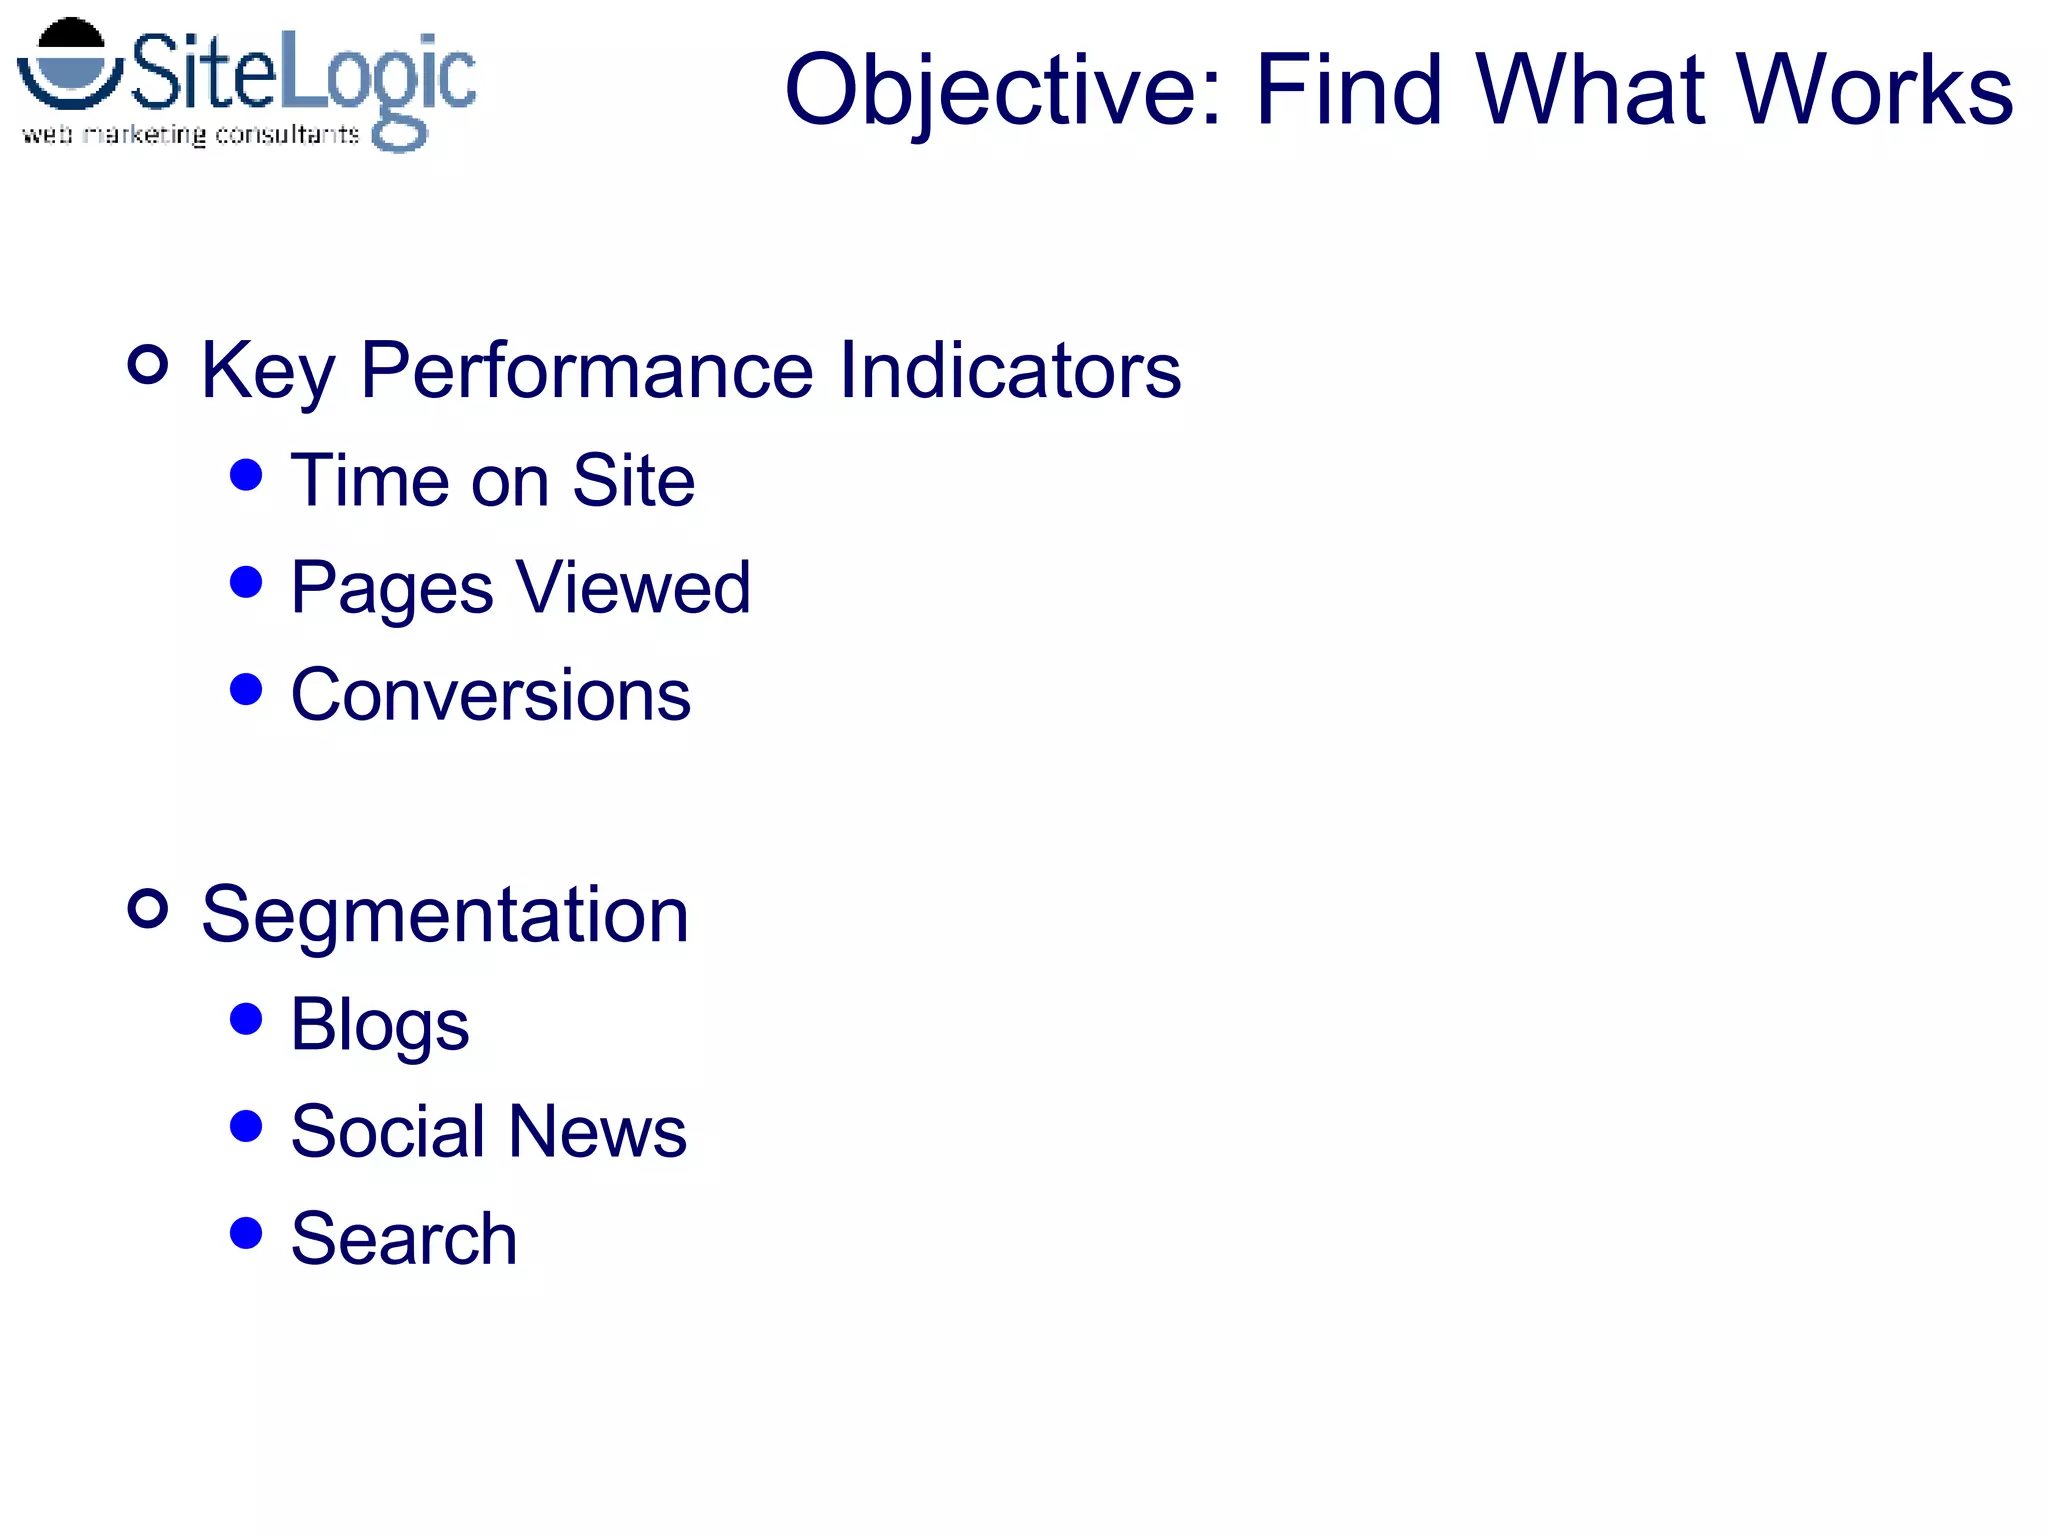
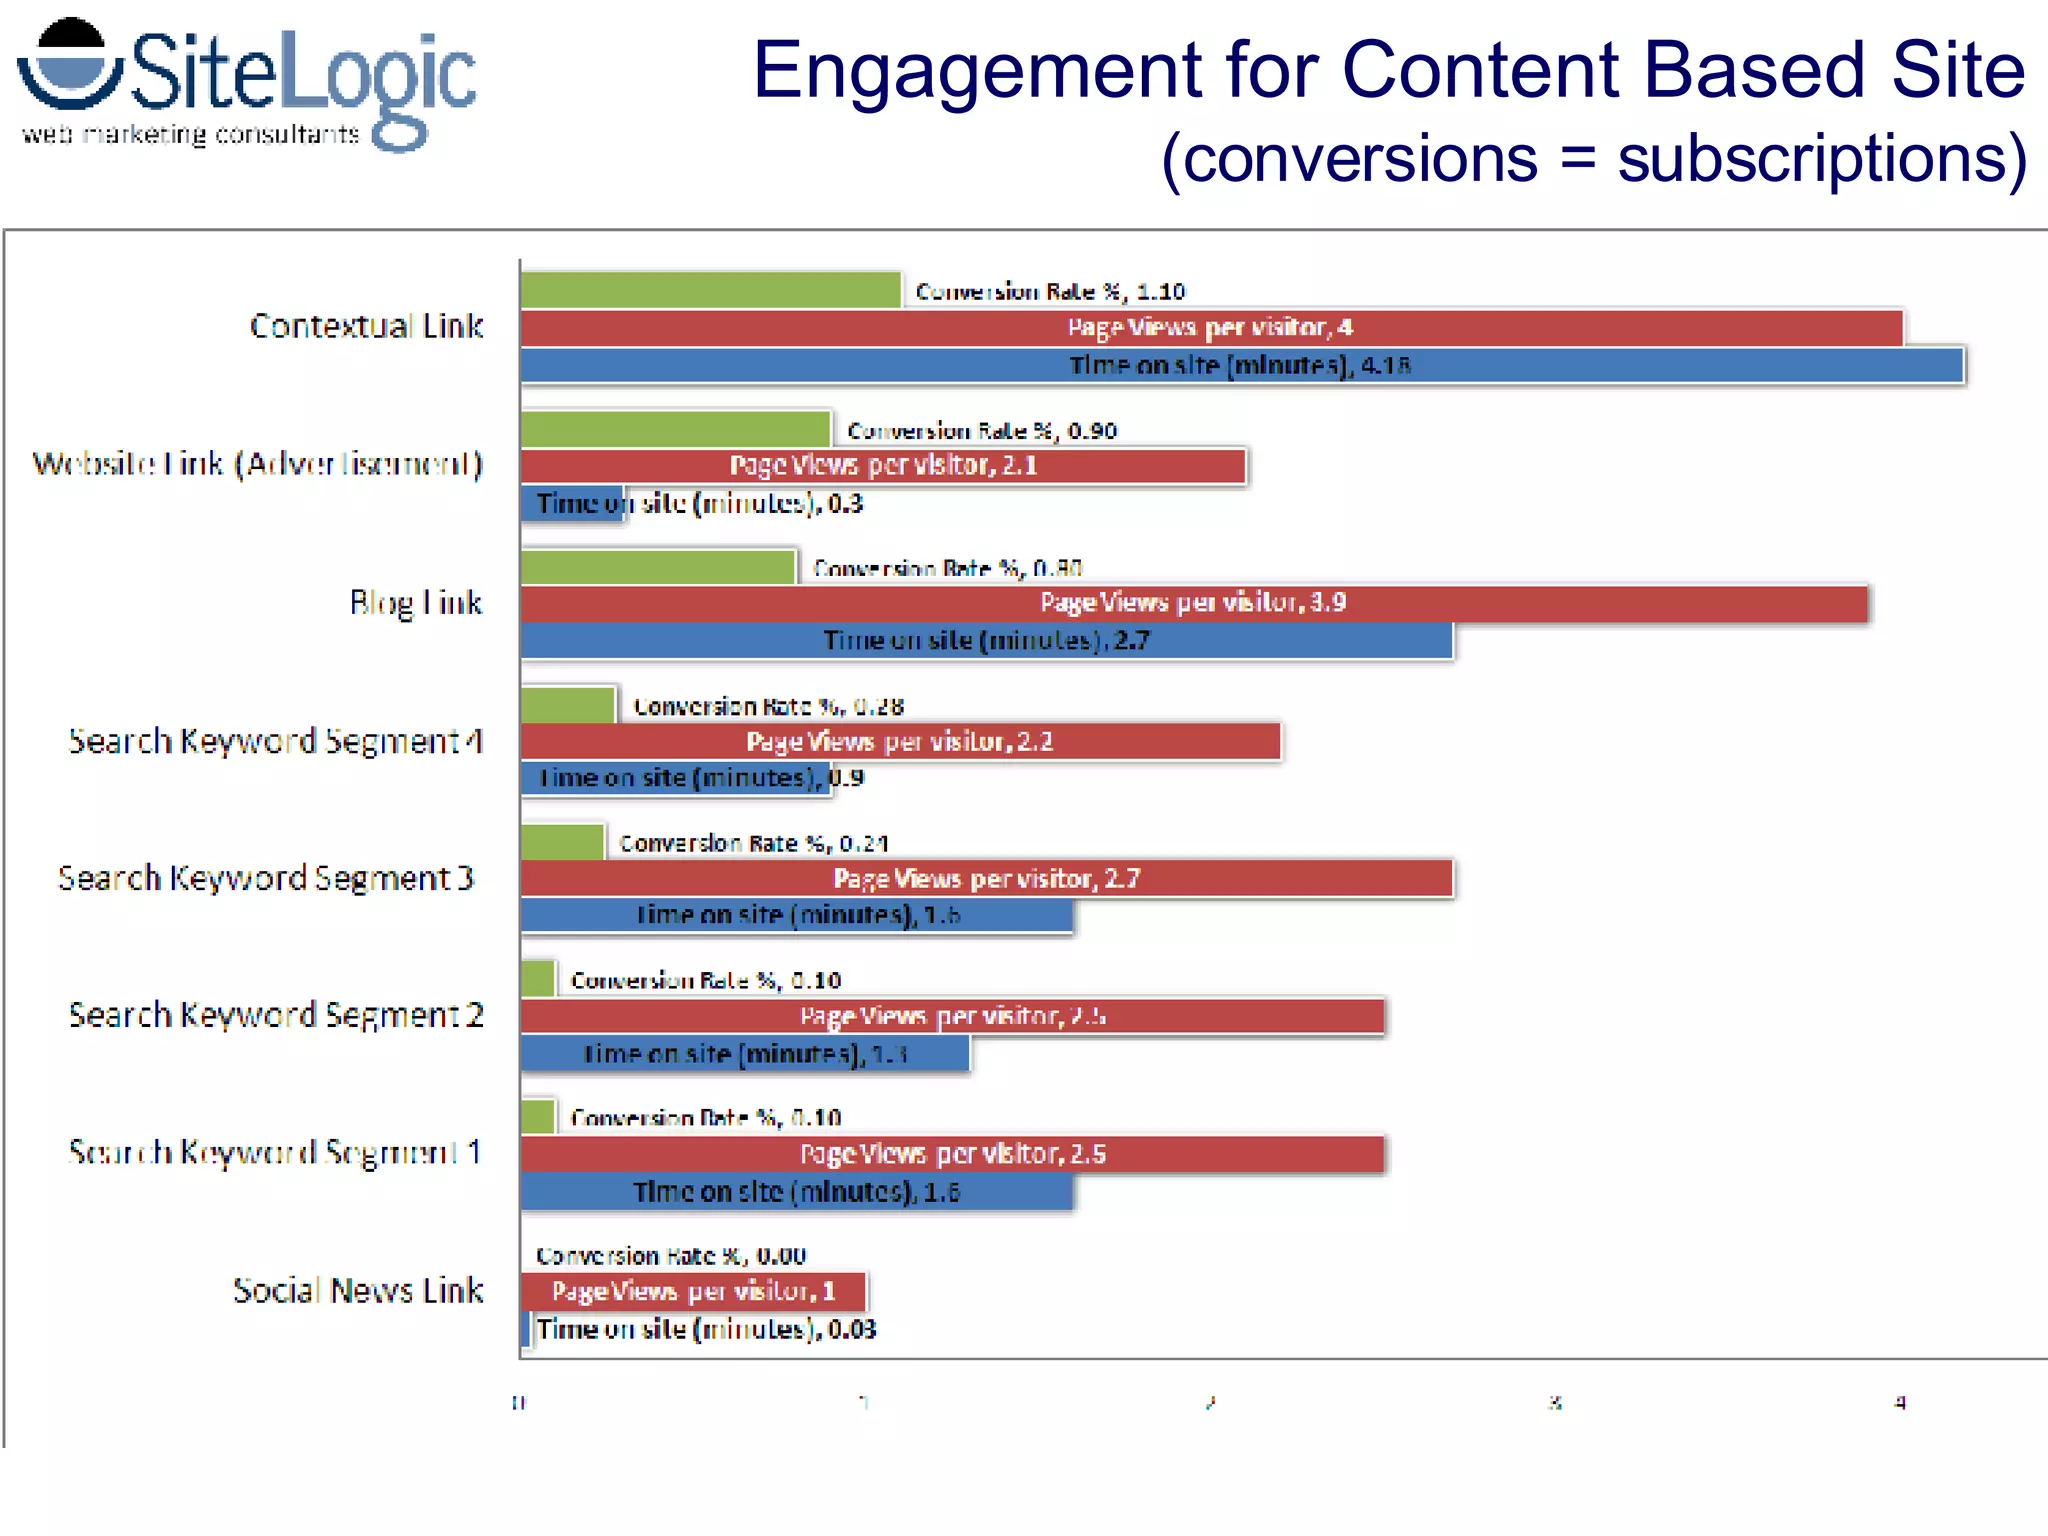
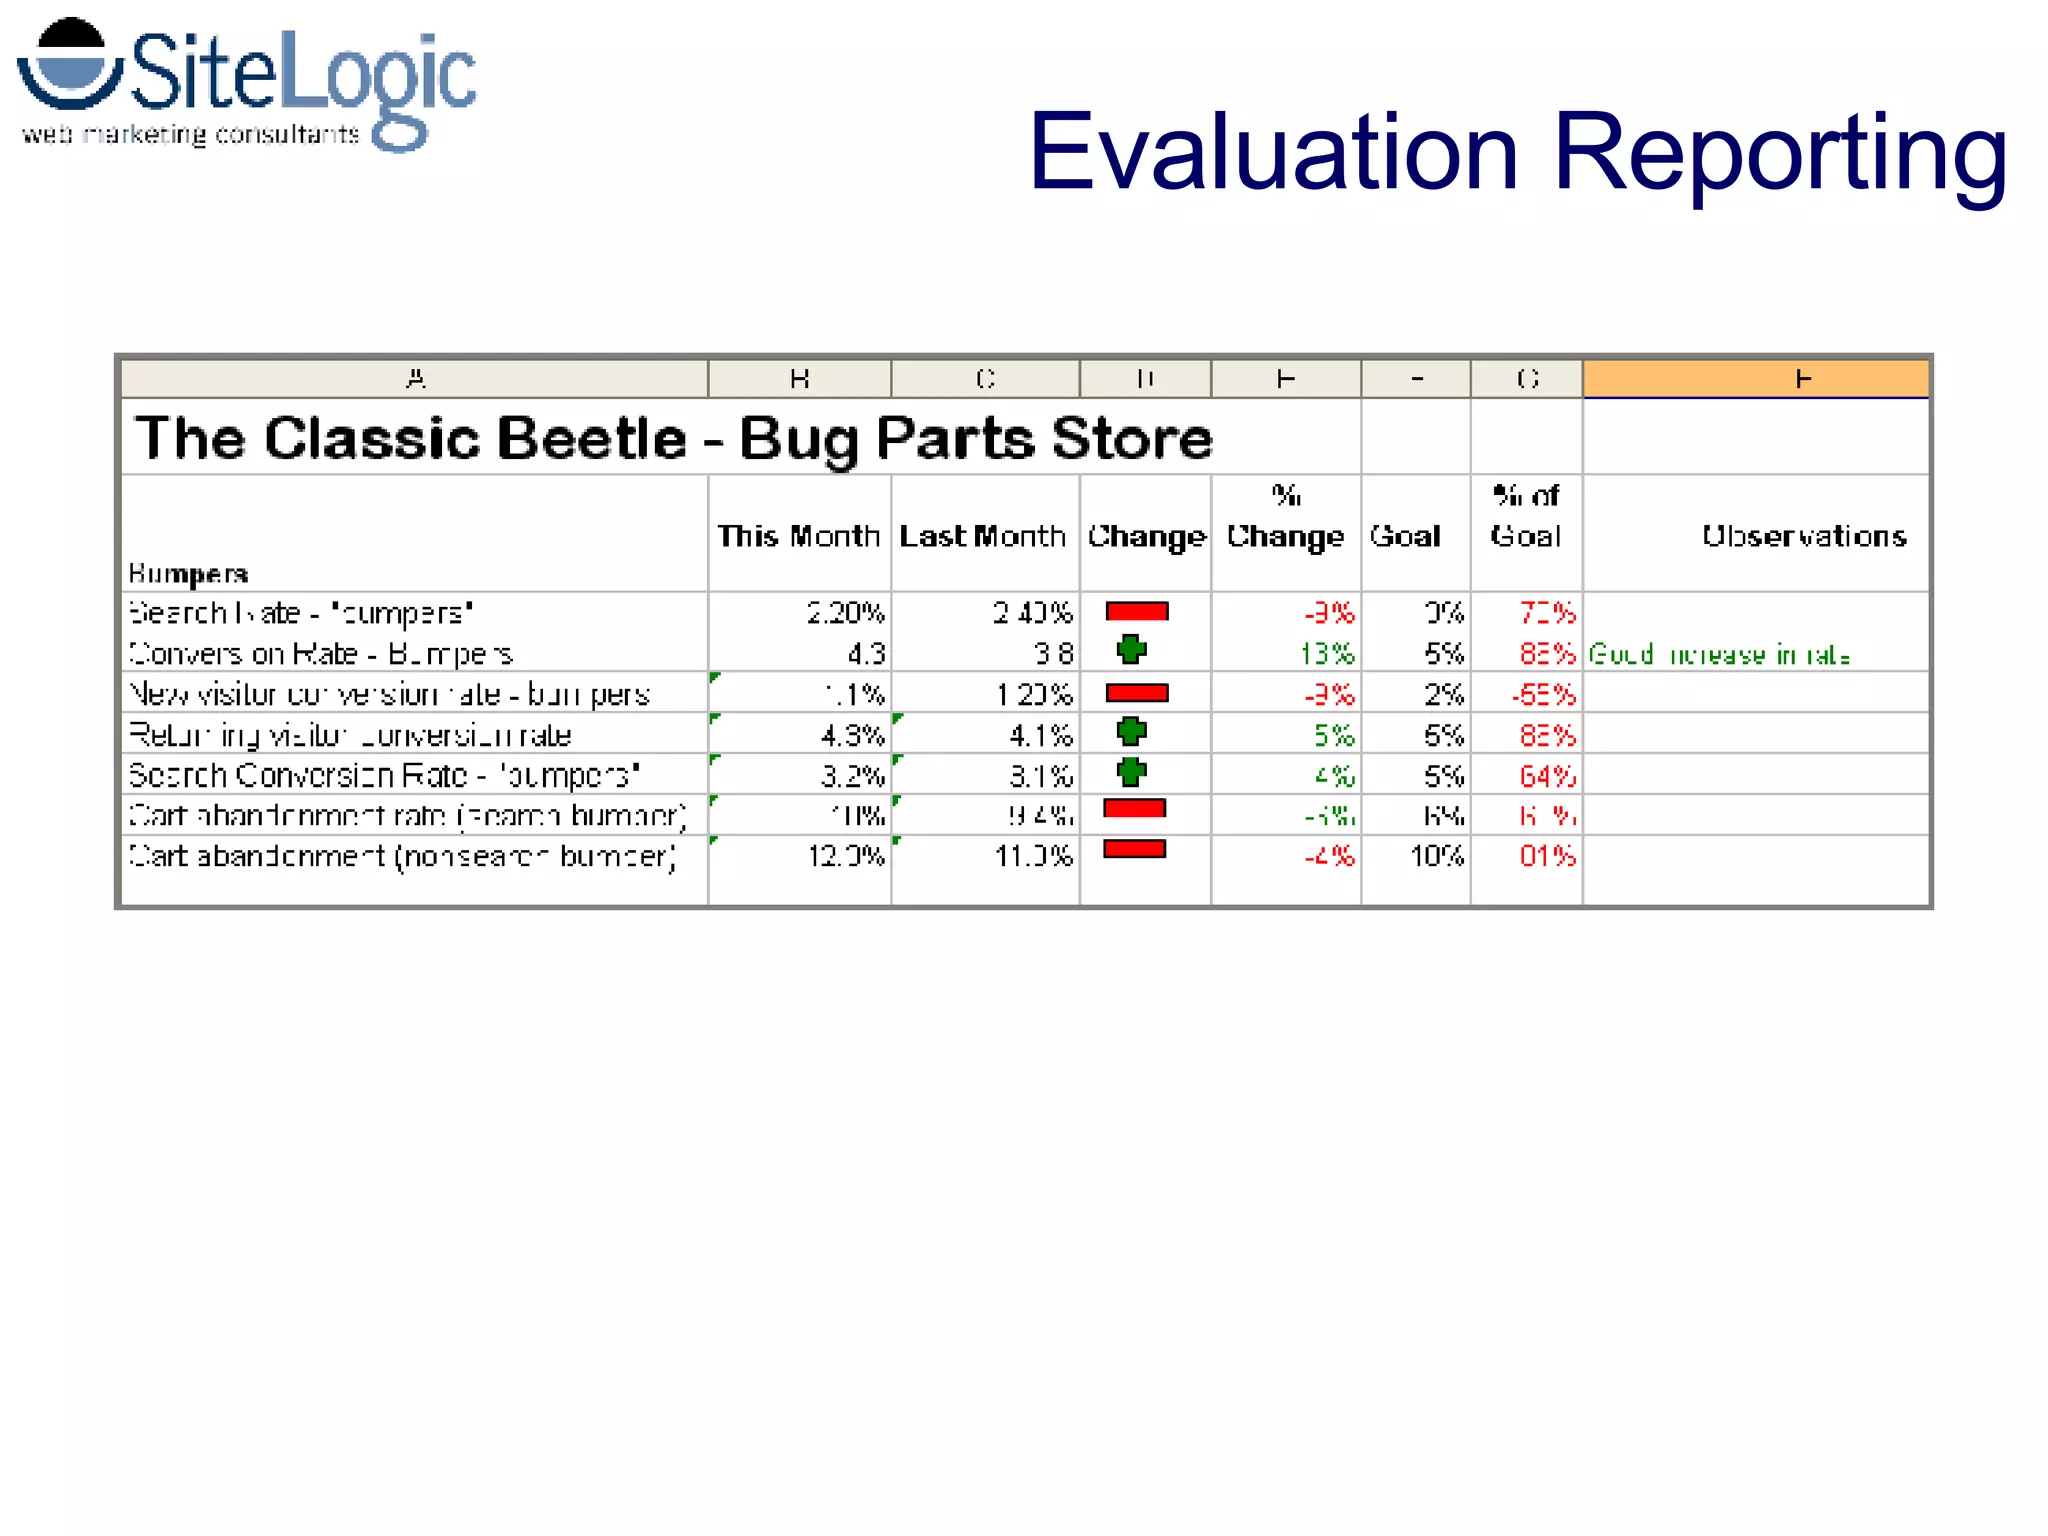
The document discusses website analytics, emphasizing the importance of tracking metrics such as visitor sessions, conversion rates, and abandonment rates. It presents various definitions and concepts related to web analytics, aiming to help users understand and evaluate their site's performance. Additionally, it highlights the significance of setting clear goals and using key performance indicators to drive business decisions and improve site effectiveness.