


![Correlation mpg cyl disp wt mpg 1.0000000 -0.8521620 -0.8475514 -0.8676594 cyl -0.8521620 1.0000000 0.9020329 0.7824958 disp -0.8475514 0.9020329 1.0000000 0.8879799 wt -0.8676594 0.7824958 0.8879799 1.0000000 cor(mtcars[, c("mpg", "cyl", "disp", "wt")]) mpg cyl disp wt Mazda RX4 21.0 6 160.0 2.620 Mazda RX4 Wag 21.0 6 160.0 2.875 Datsun 710 22.8 4 108.0 2.320 Hornet 4 Drive 21.4 6 258.0 3.215 Hornet Sportabout 18.7 8 360.0 3.440 Valiant 18.1 6 225.0 3.460 Duster 360 14.3 8 360.0 3.570 Merc 240D 24.4 4 146.7 3.190 Merc 230 22.8 4 140.8 3.150](https://image.slidesharecdn.com/190310-hadoop-user-group-aadamov-190319205207/75/Understanding-your-Data-Data-Analytics-Lifecycle-and-Machine-Learning-45-2048.jpg)
![Summary Function summary(mtcars[, c("mpg", "cyl", "disp", "wt")]) mpg cyl disp wt Min. :10.40 Min. :4.000 Min. : 71.1 Min. :1.513 1st Qu.:15.43 1st Qu.:4.000 1st Qu.:120.8 1st Qu.:2.581 Median :19.20 Median :6.000 Median :196.3 Median :3.325 Mean :20.09 Mean :6.188 Mean :230.7 Mean :3.217 3rd Qu.:22.80 3rd Qu.:8.000 3rd Qu.:326.0 3rd Qu.:3.610 Max. :33.90 Max. :8.000 Max. :472.0 Max. :5.424](https://image.slidesharecdn.com/190310-hadoop-user-group-aadamov-190319205207/75/Understanding-your-Data-Data-Analytics-Lifecycle-and-Machine-Learning-46-2048.jpg)

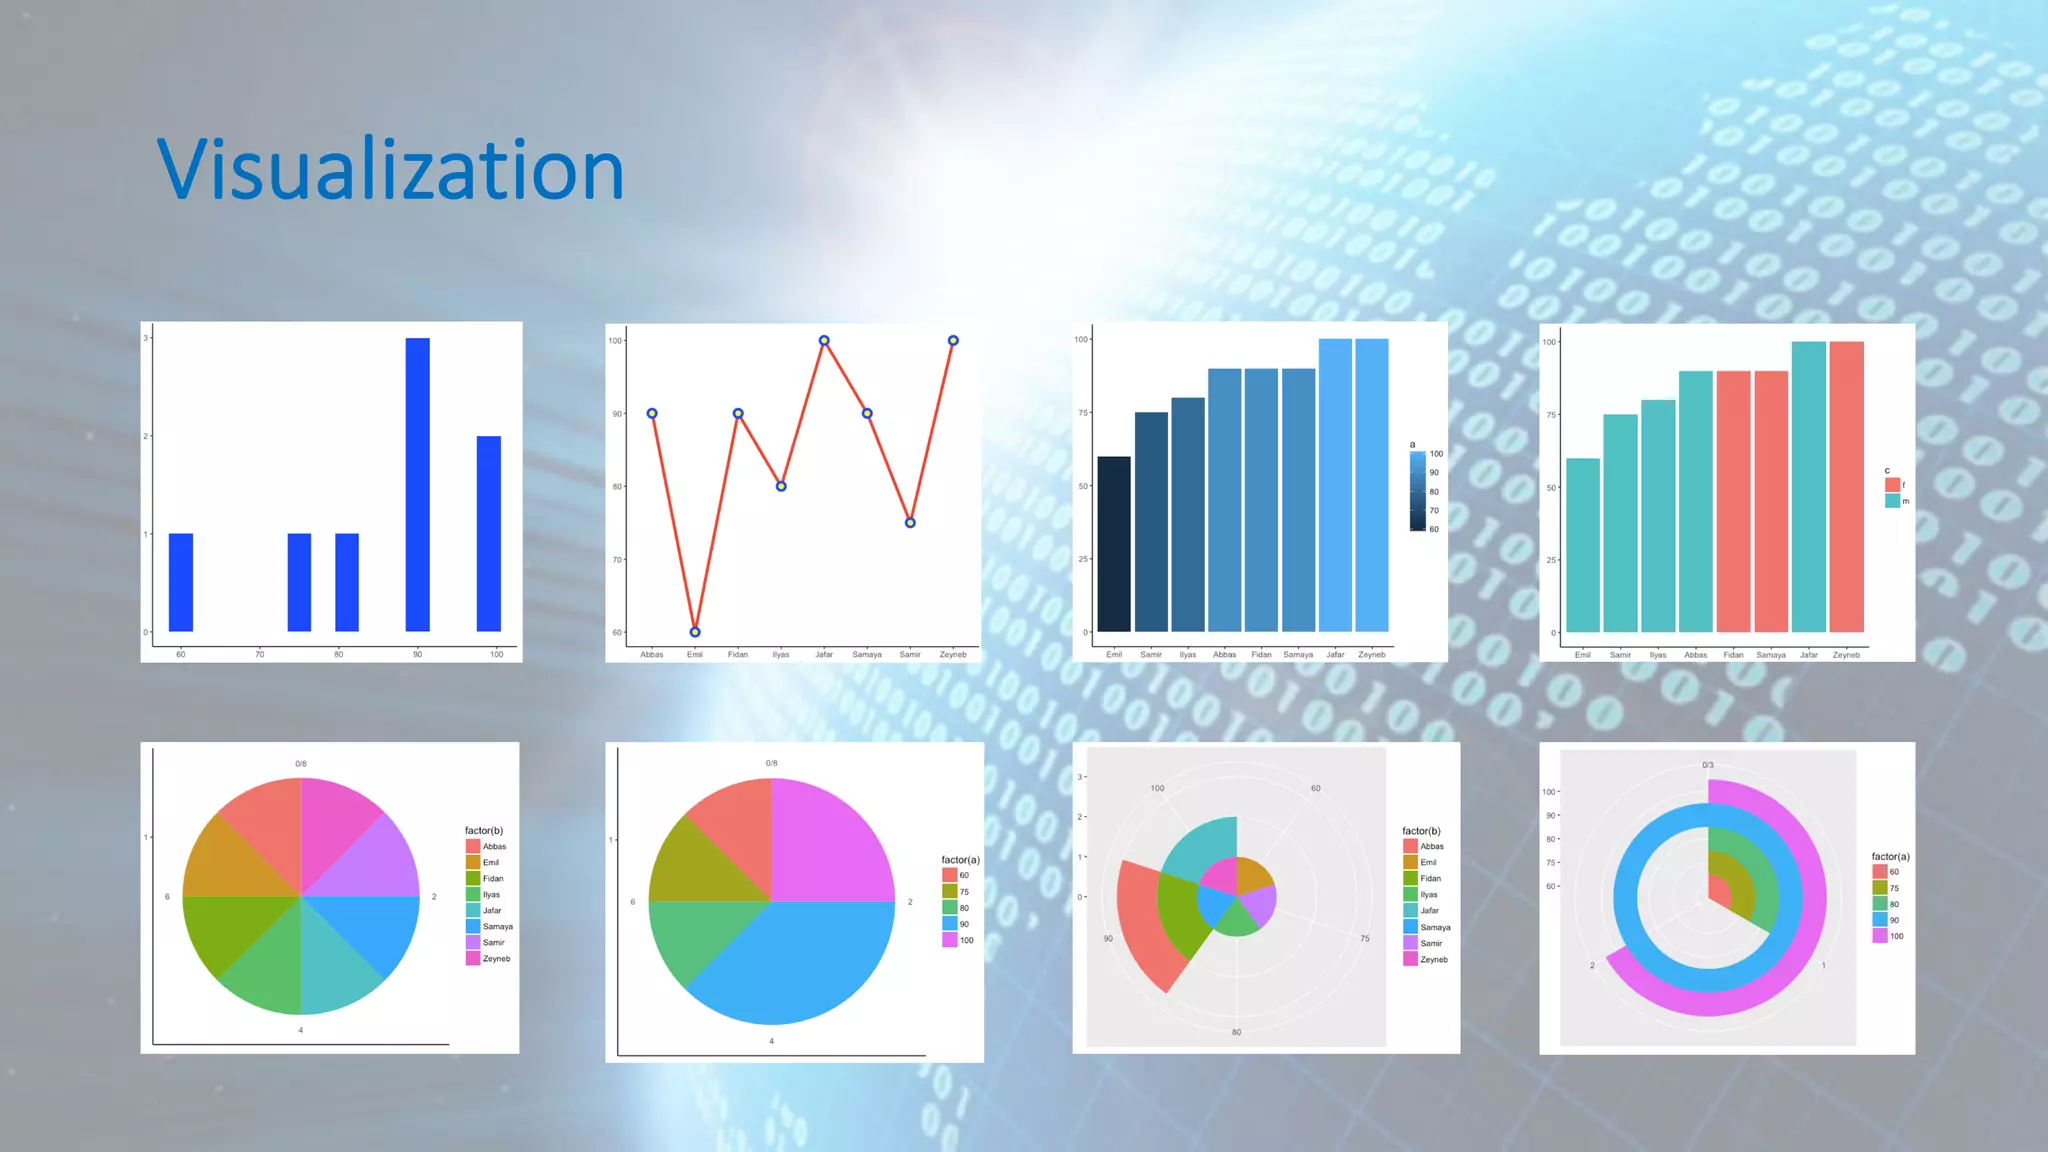

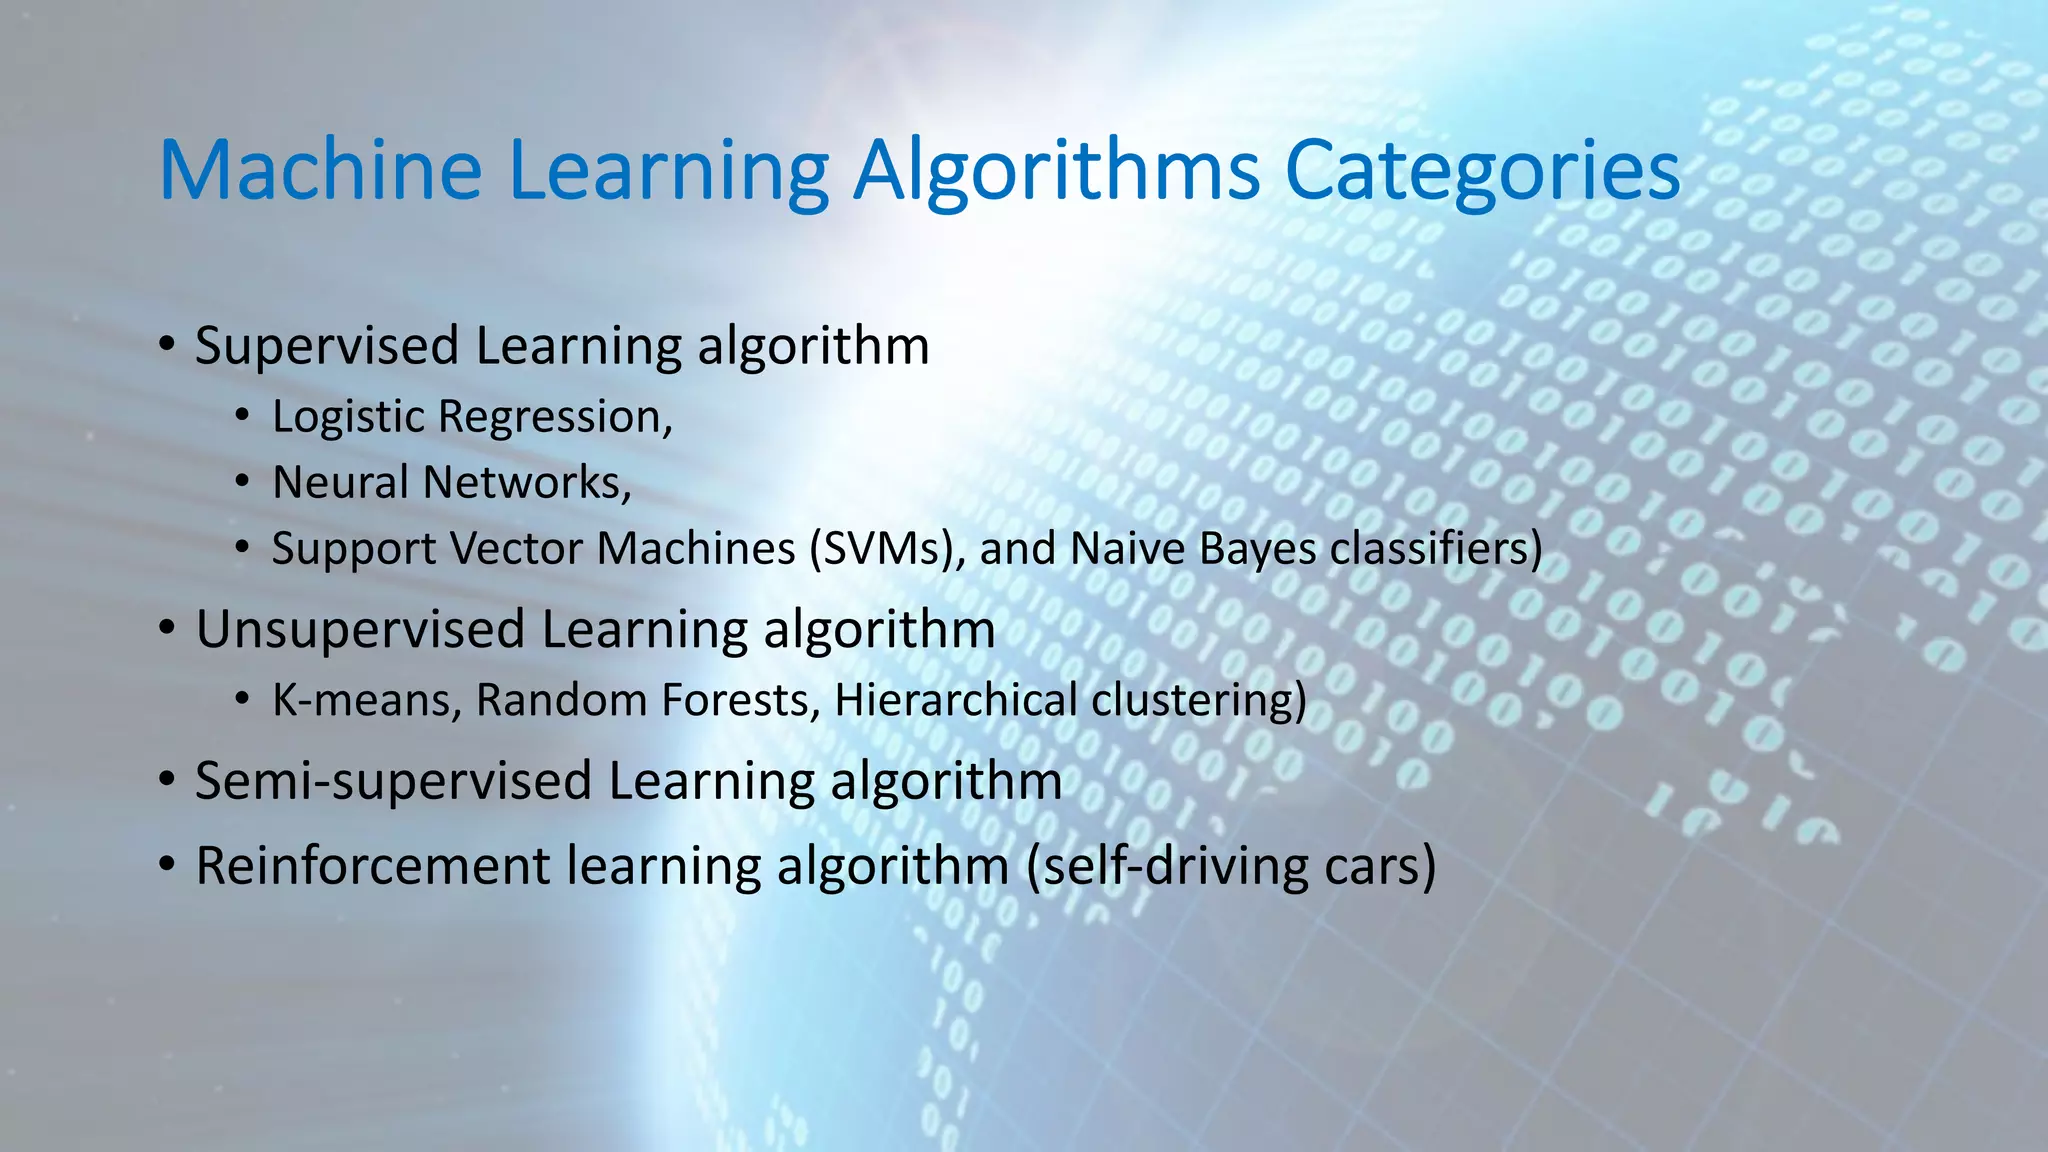

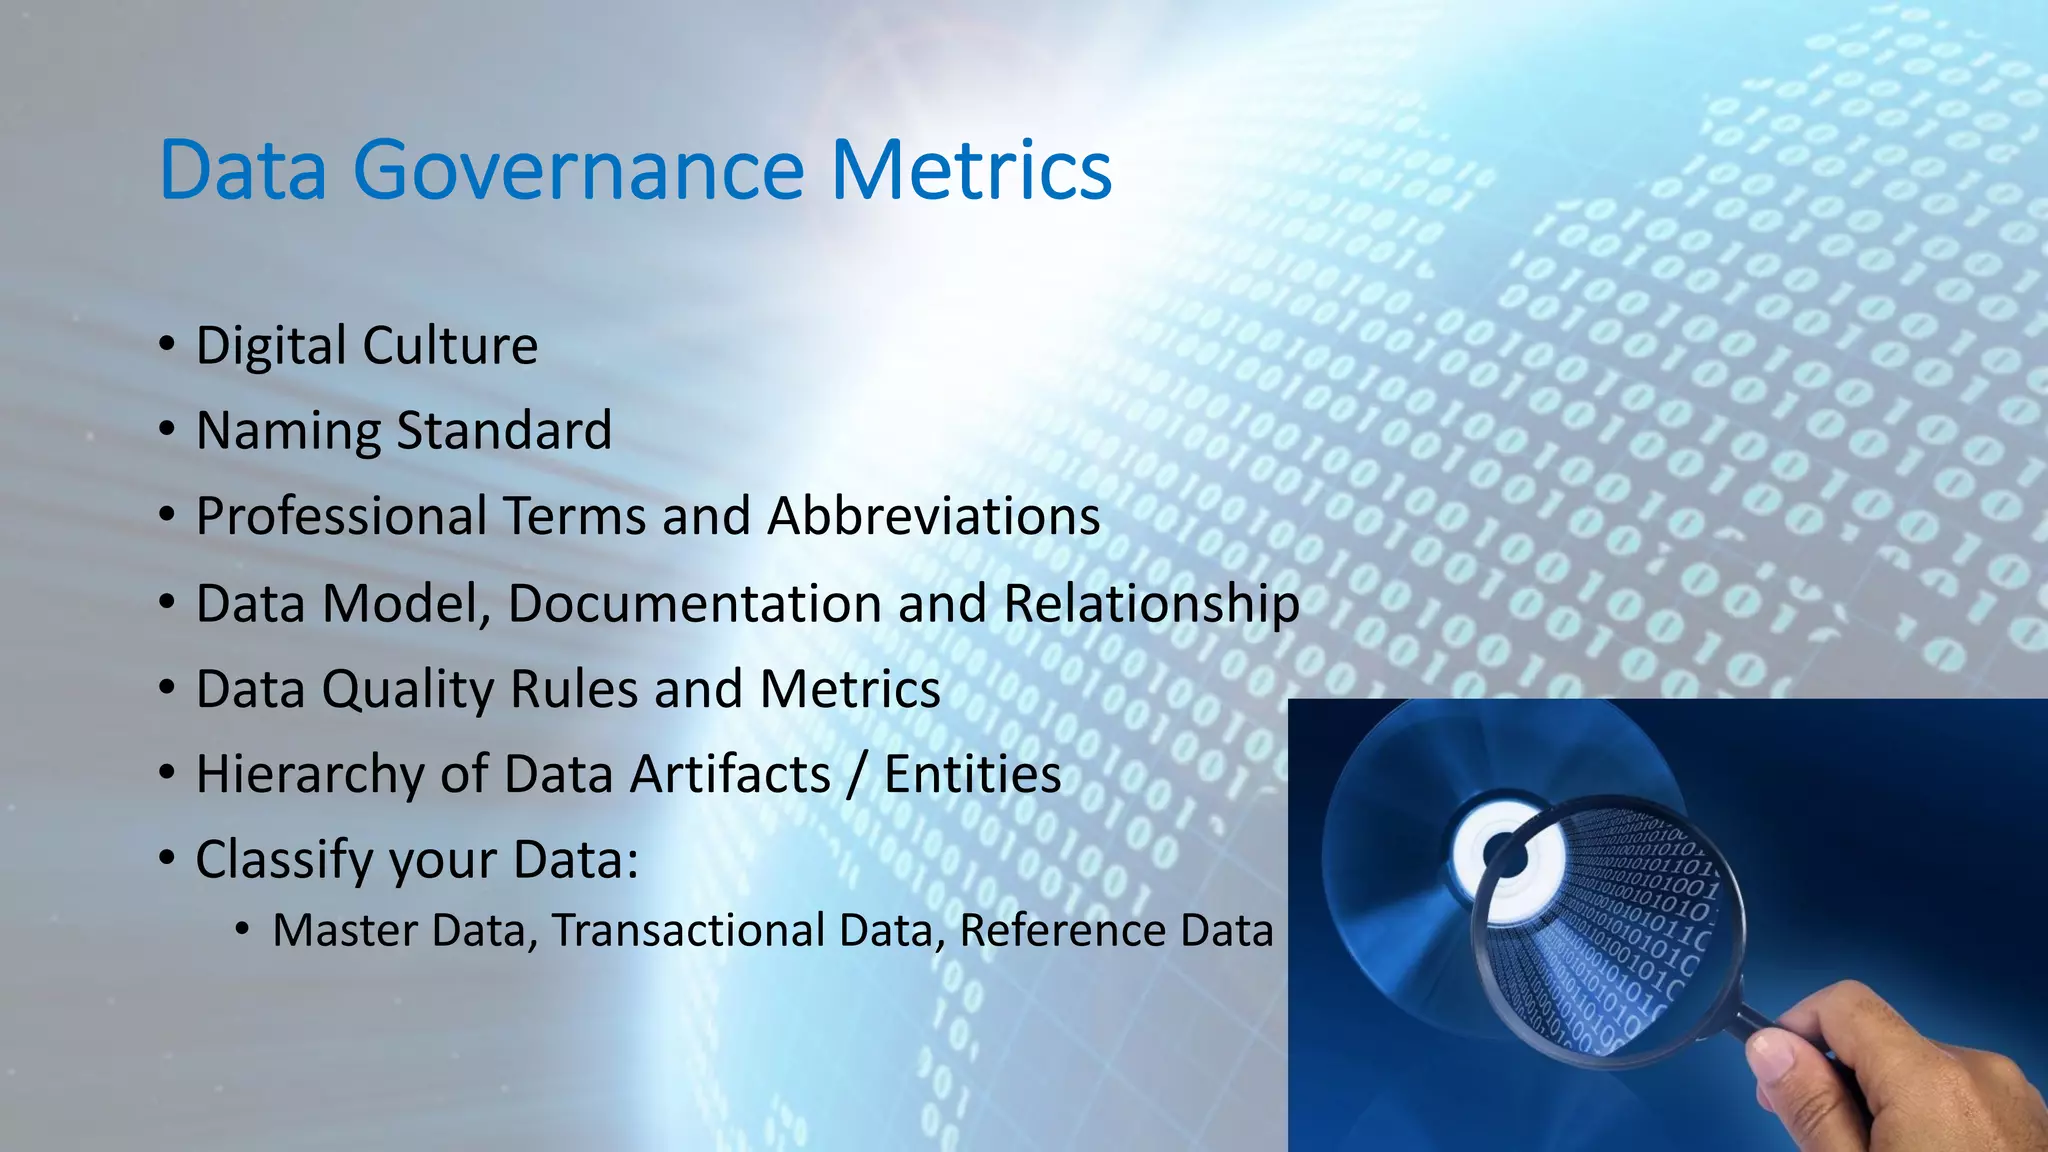


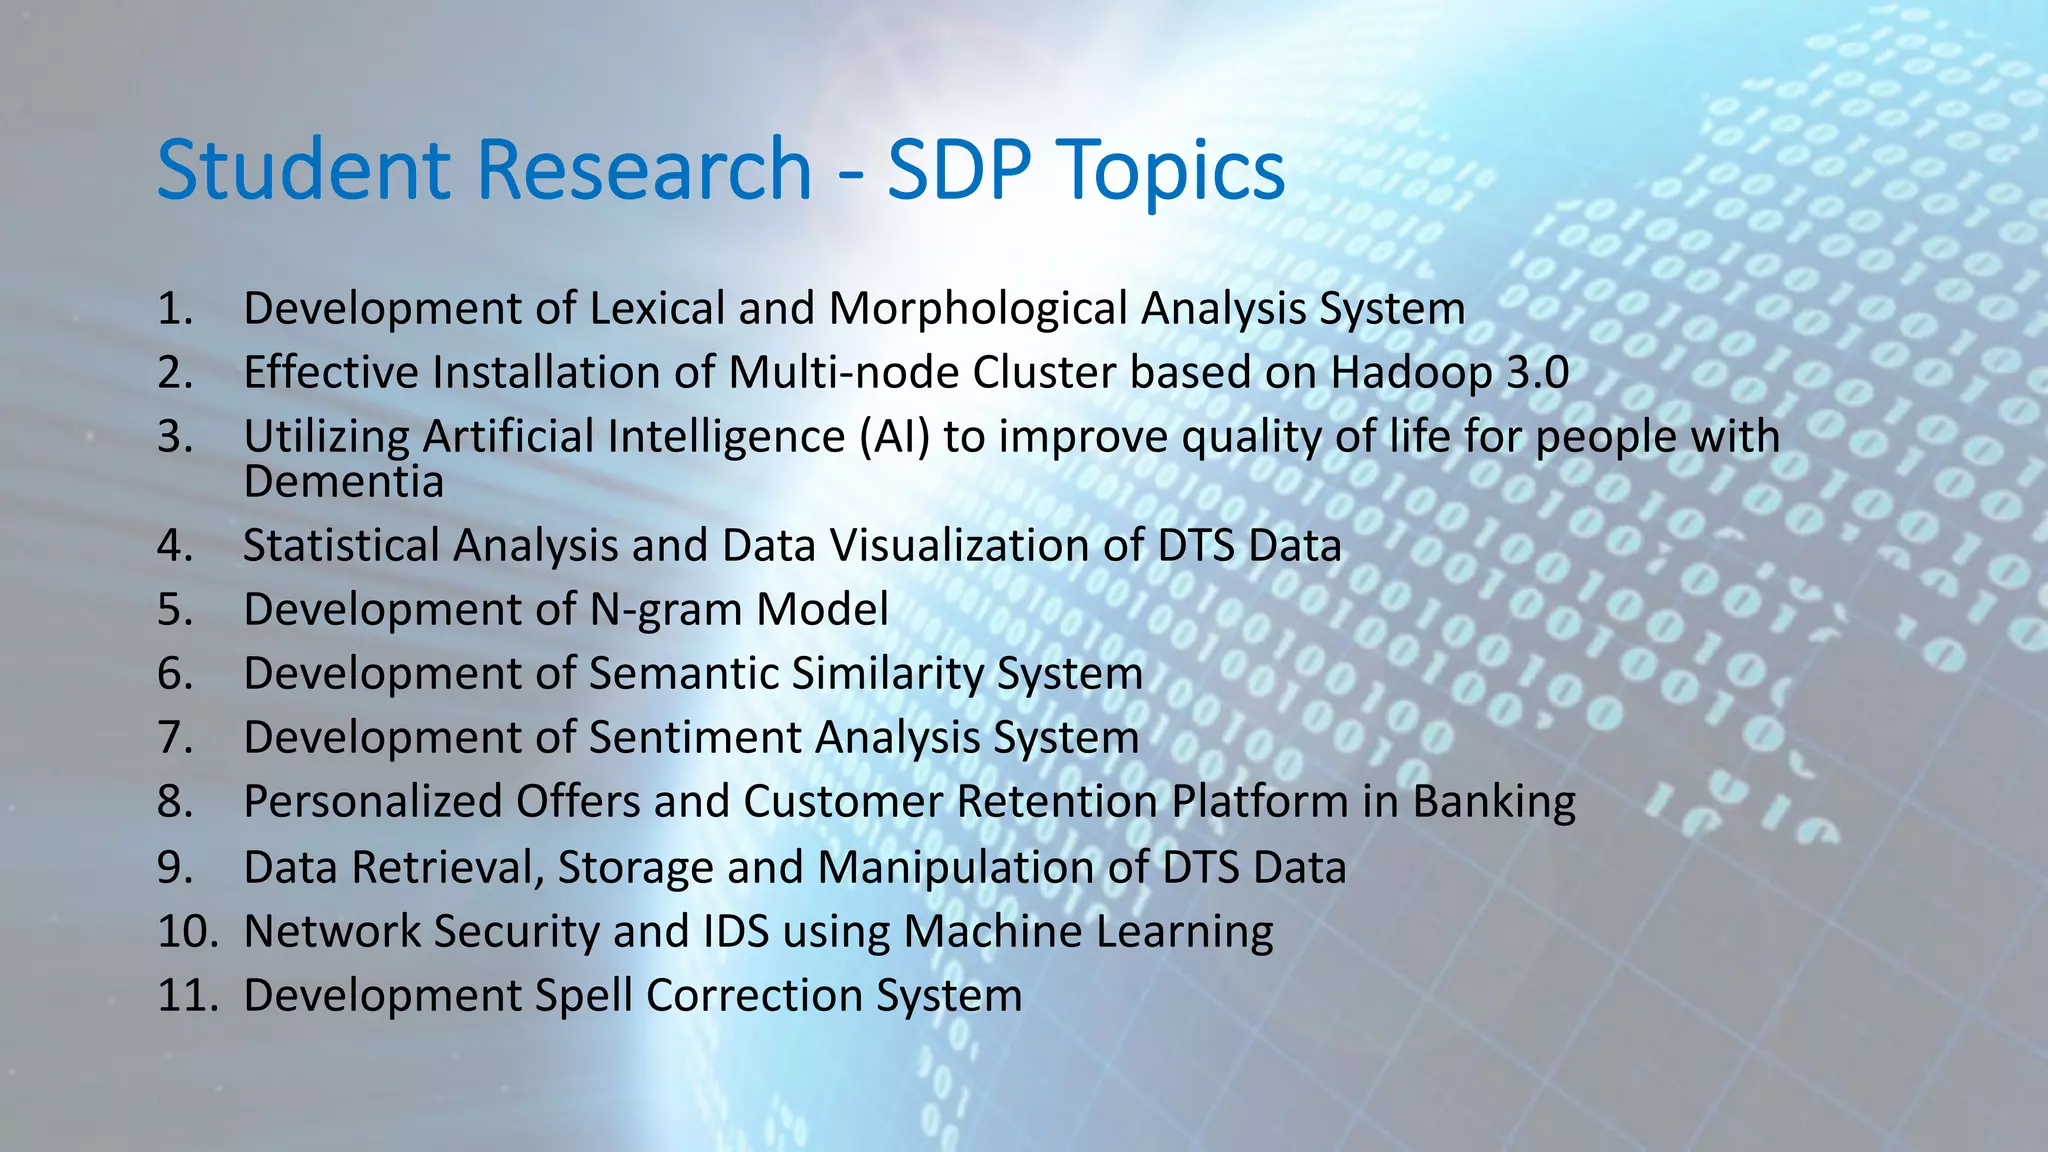
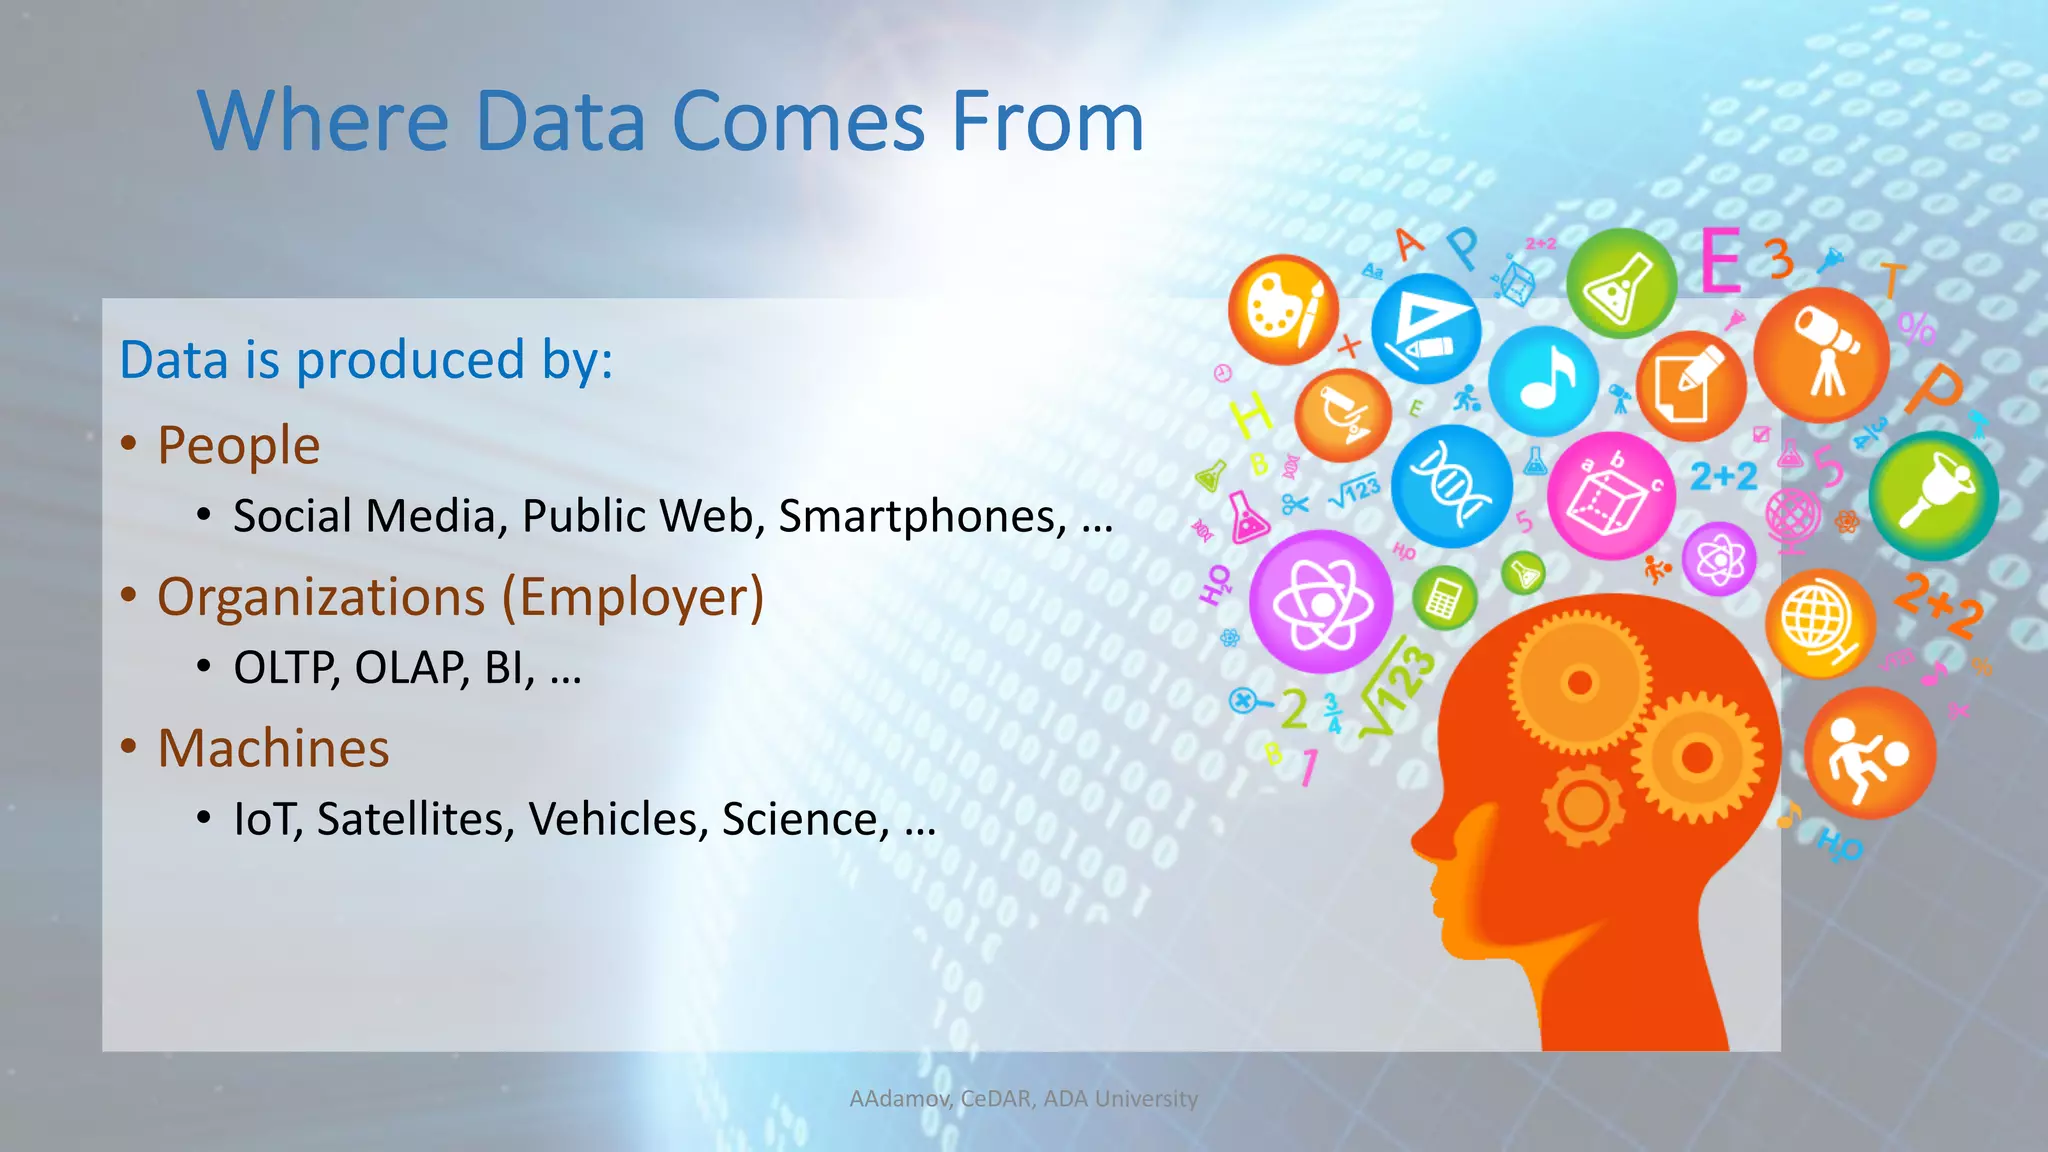
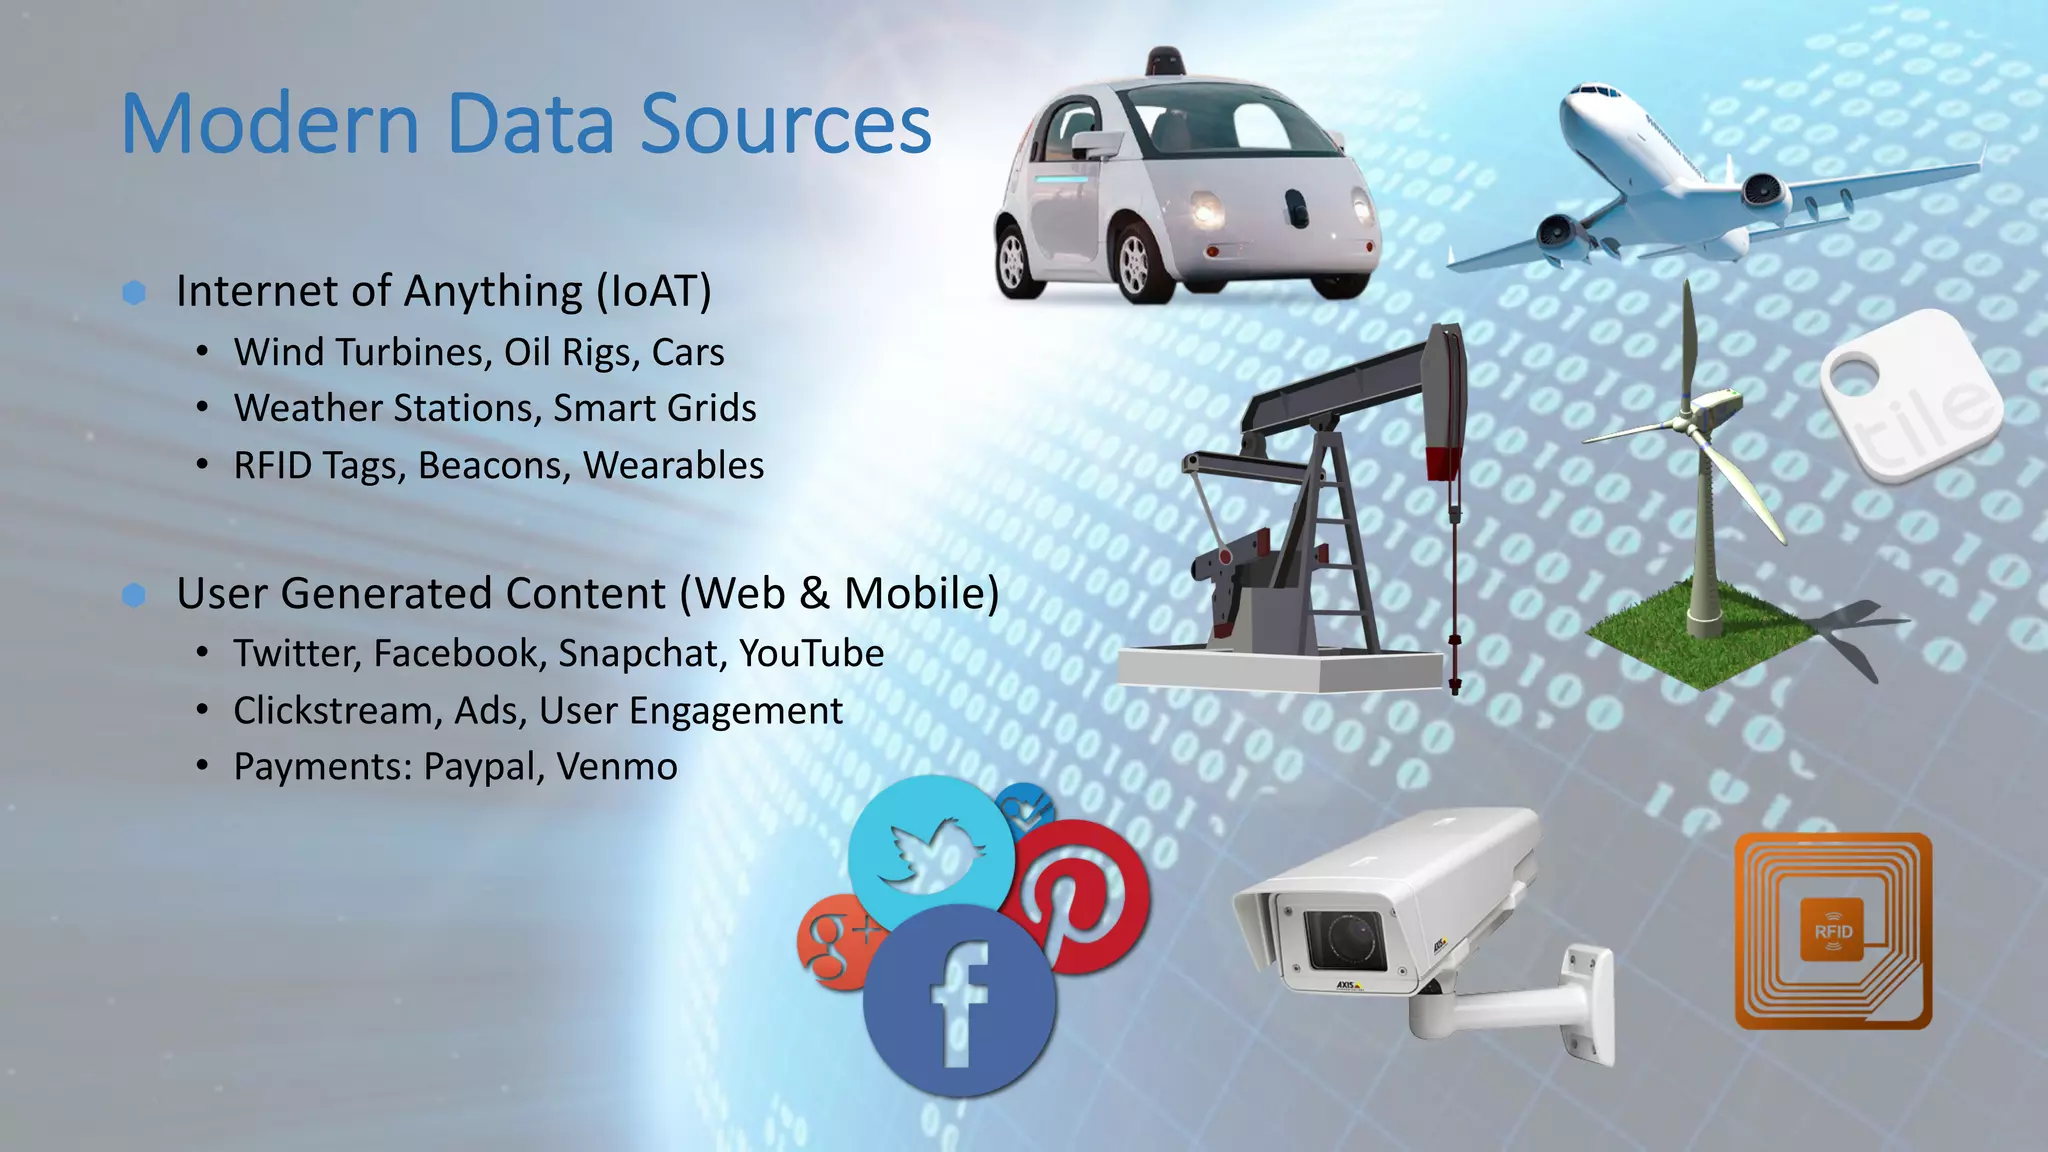
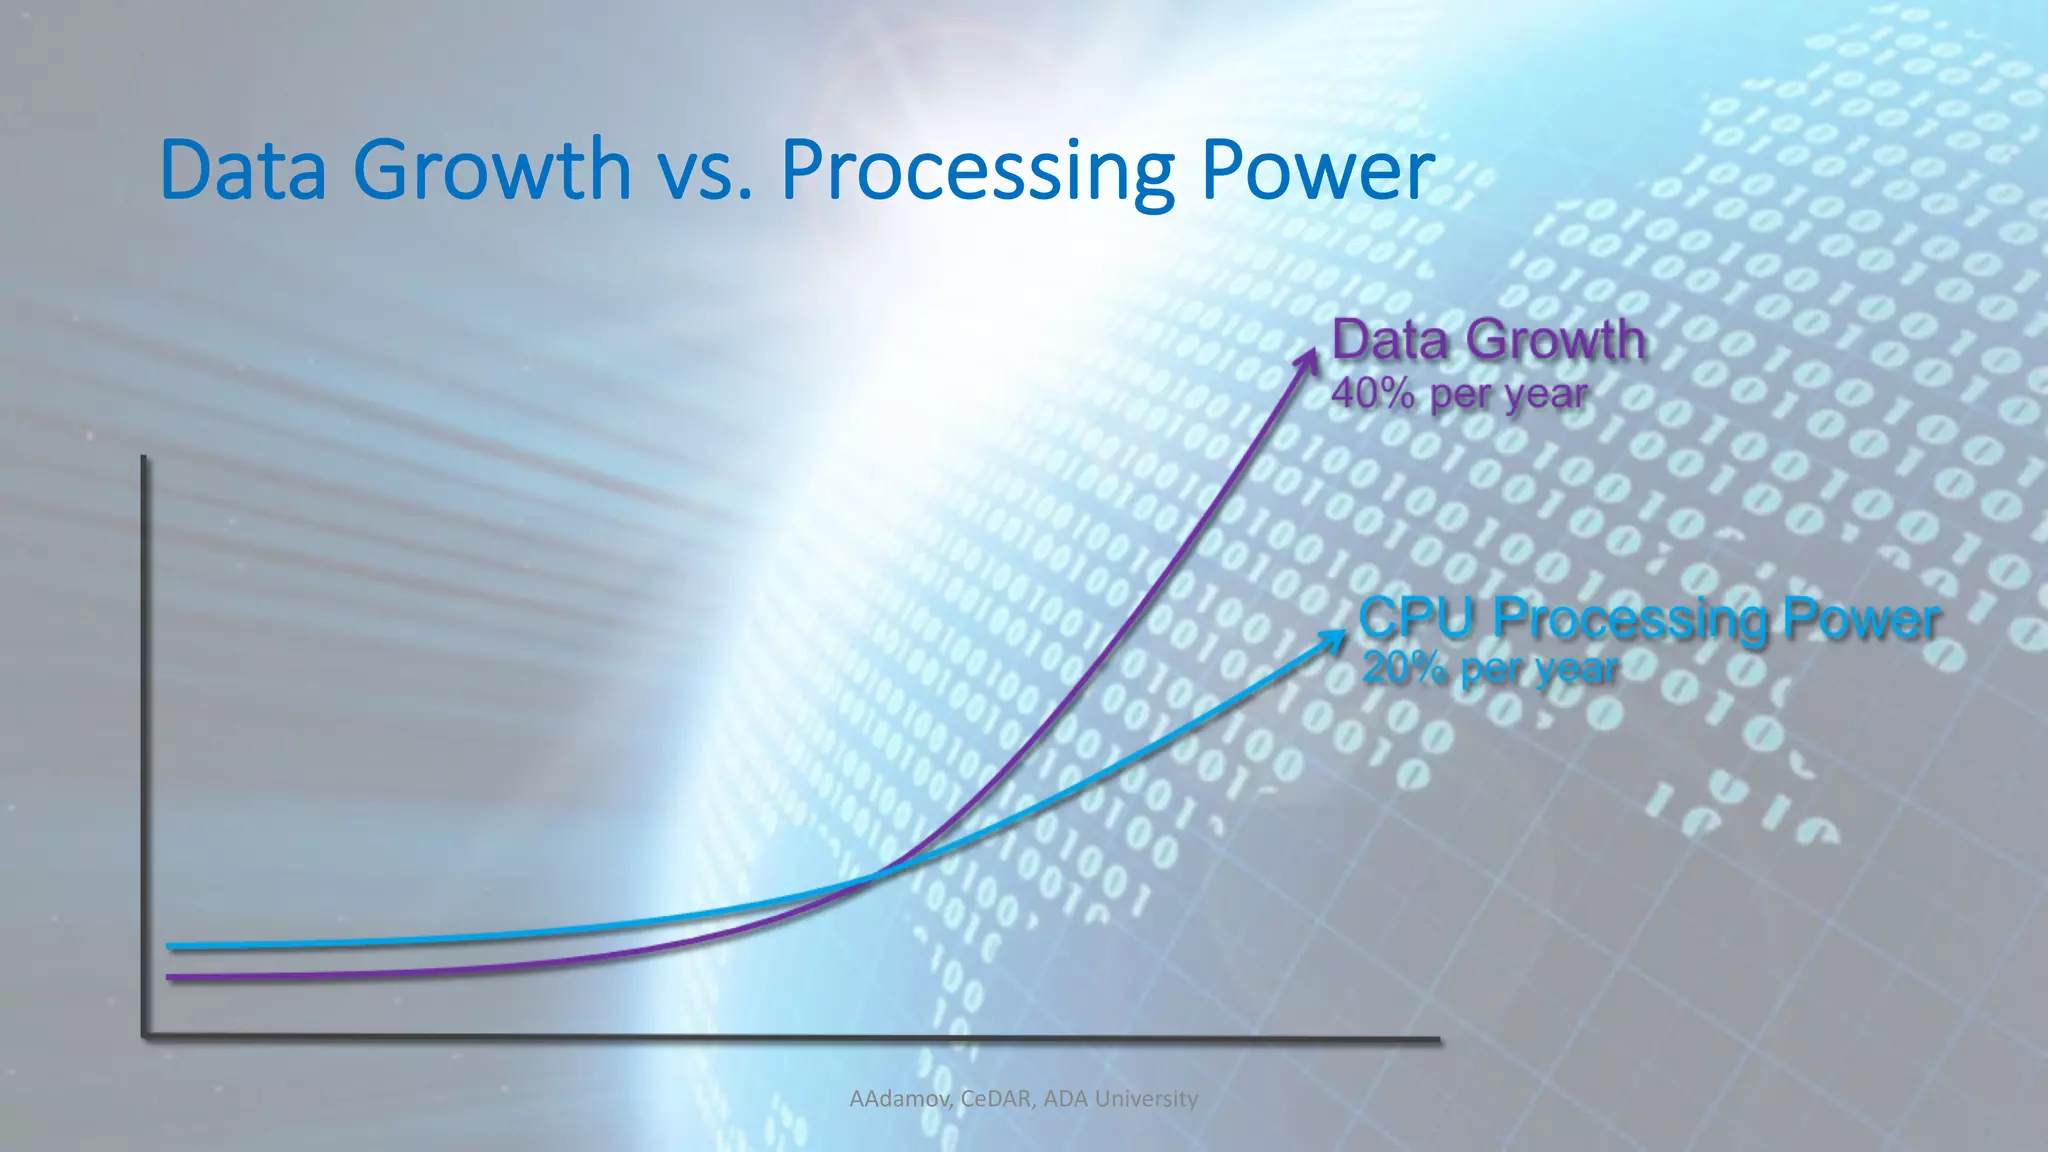
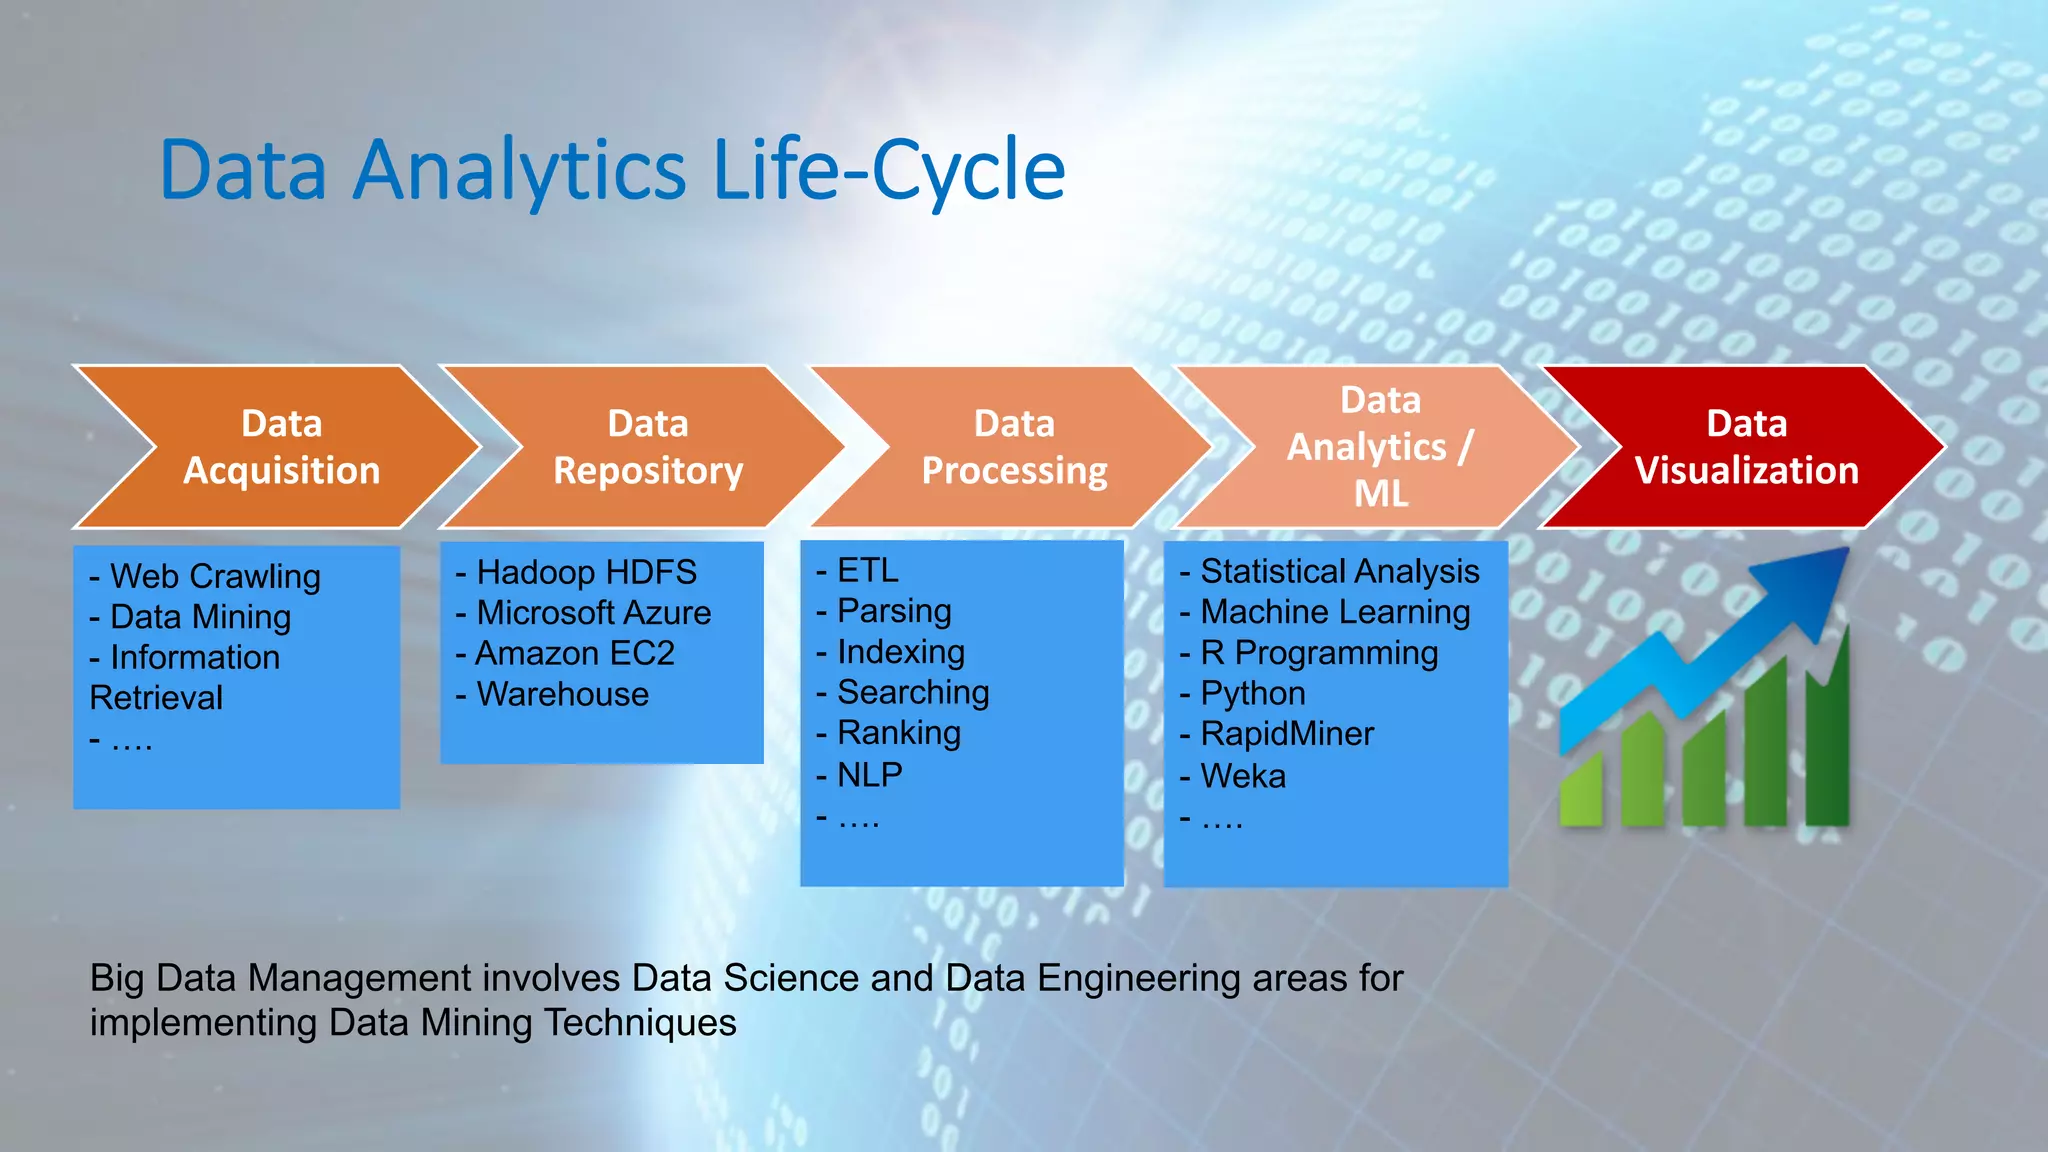
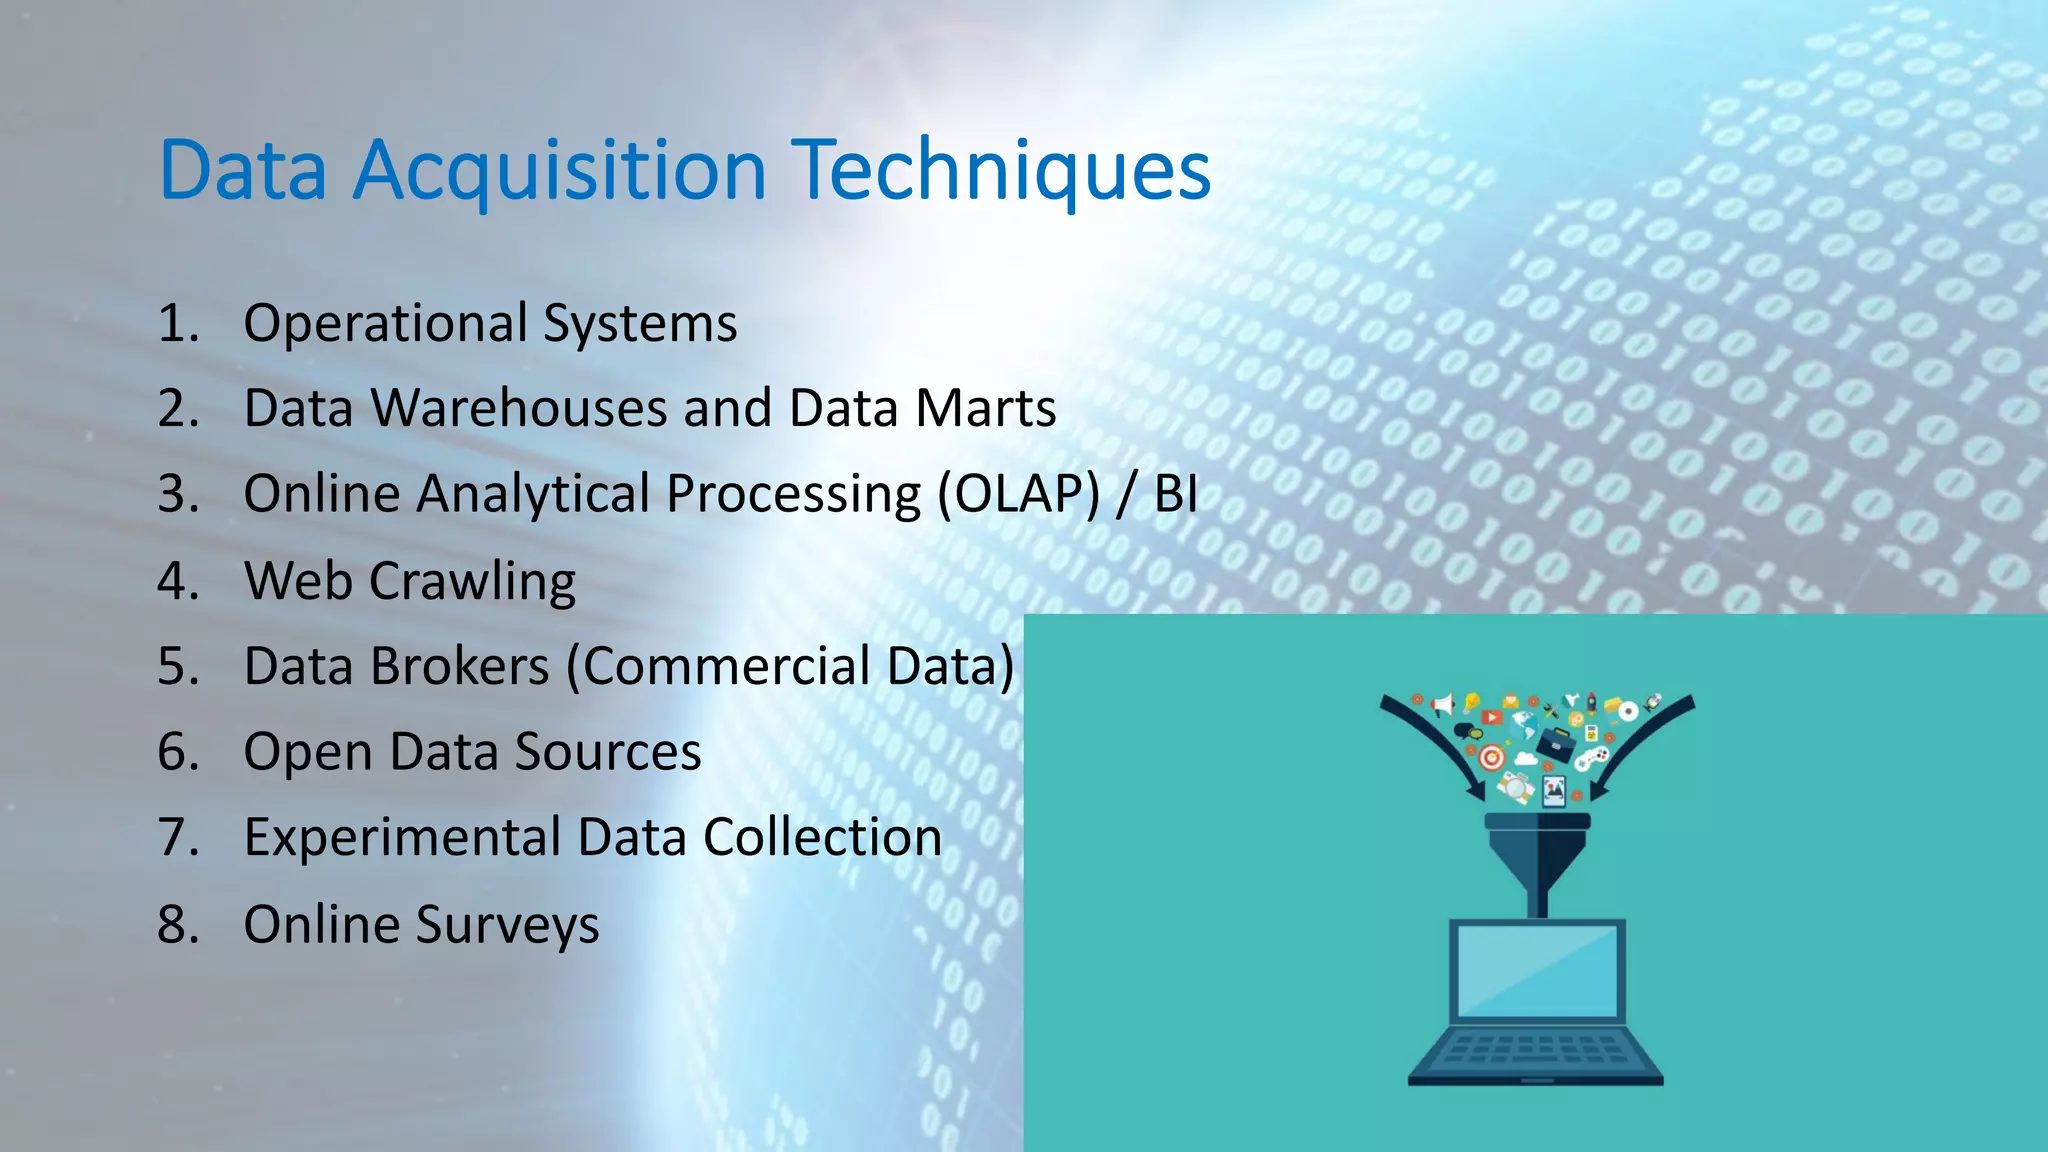
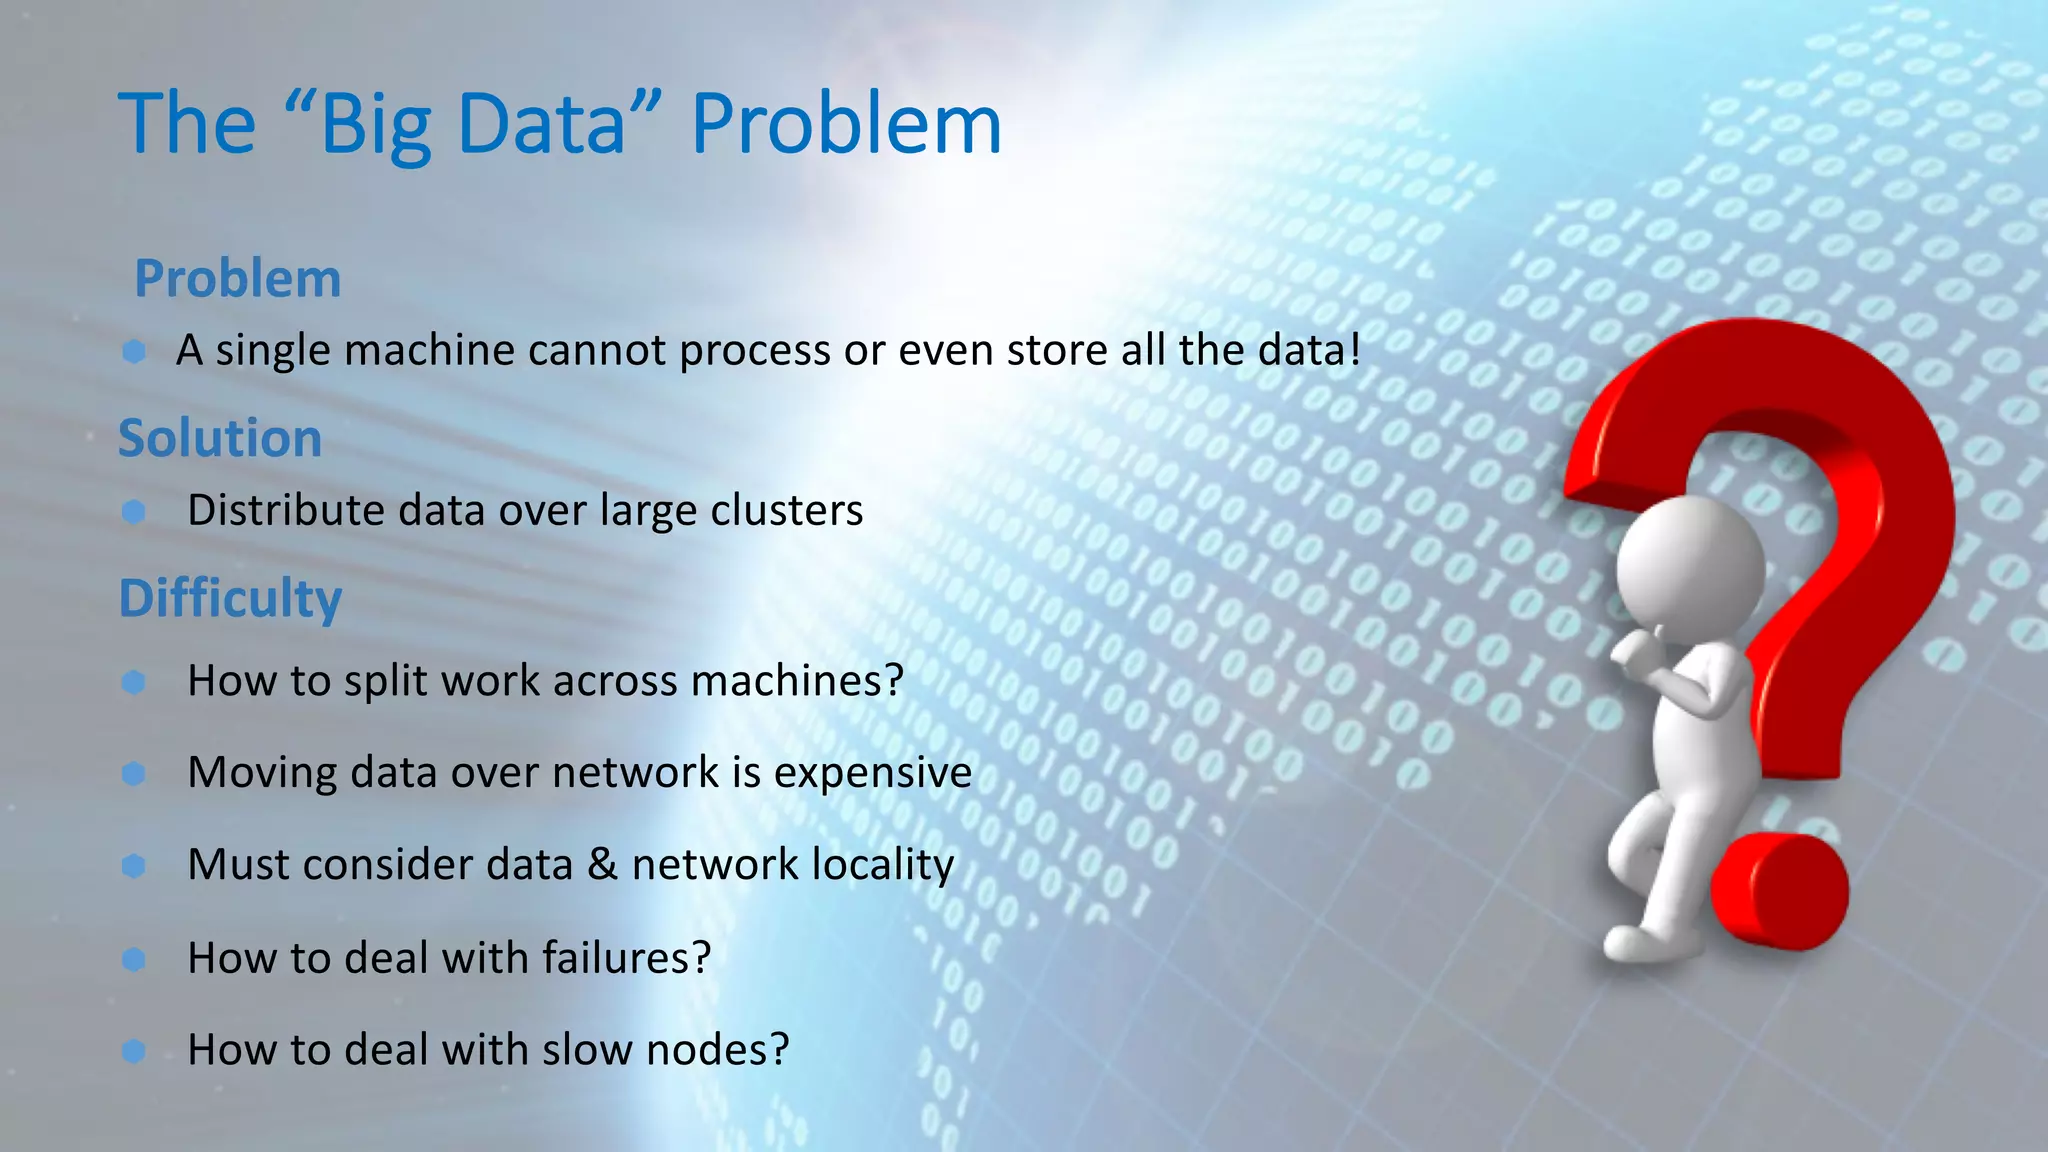
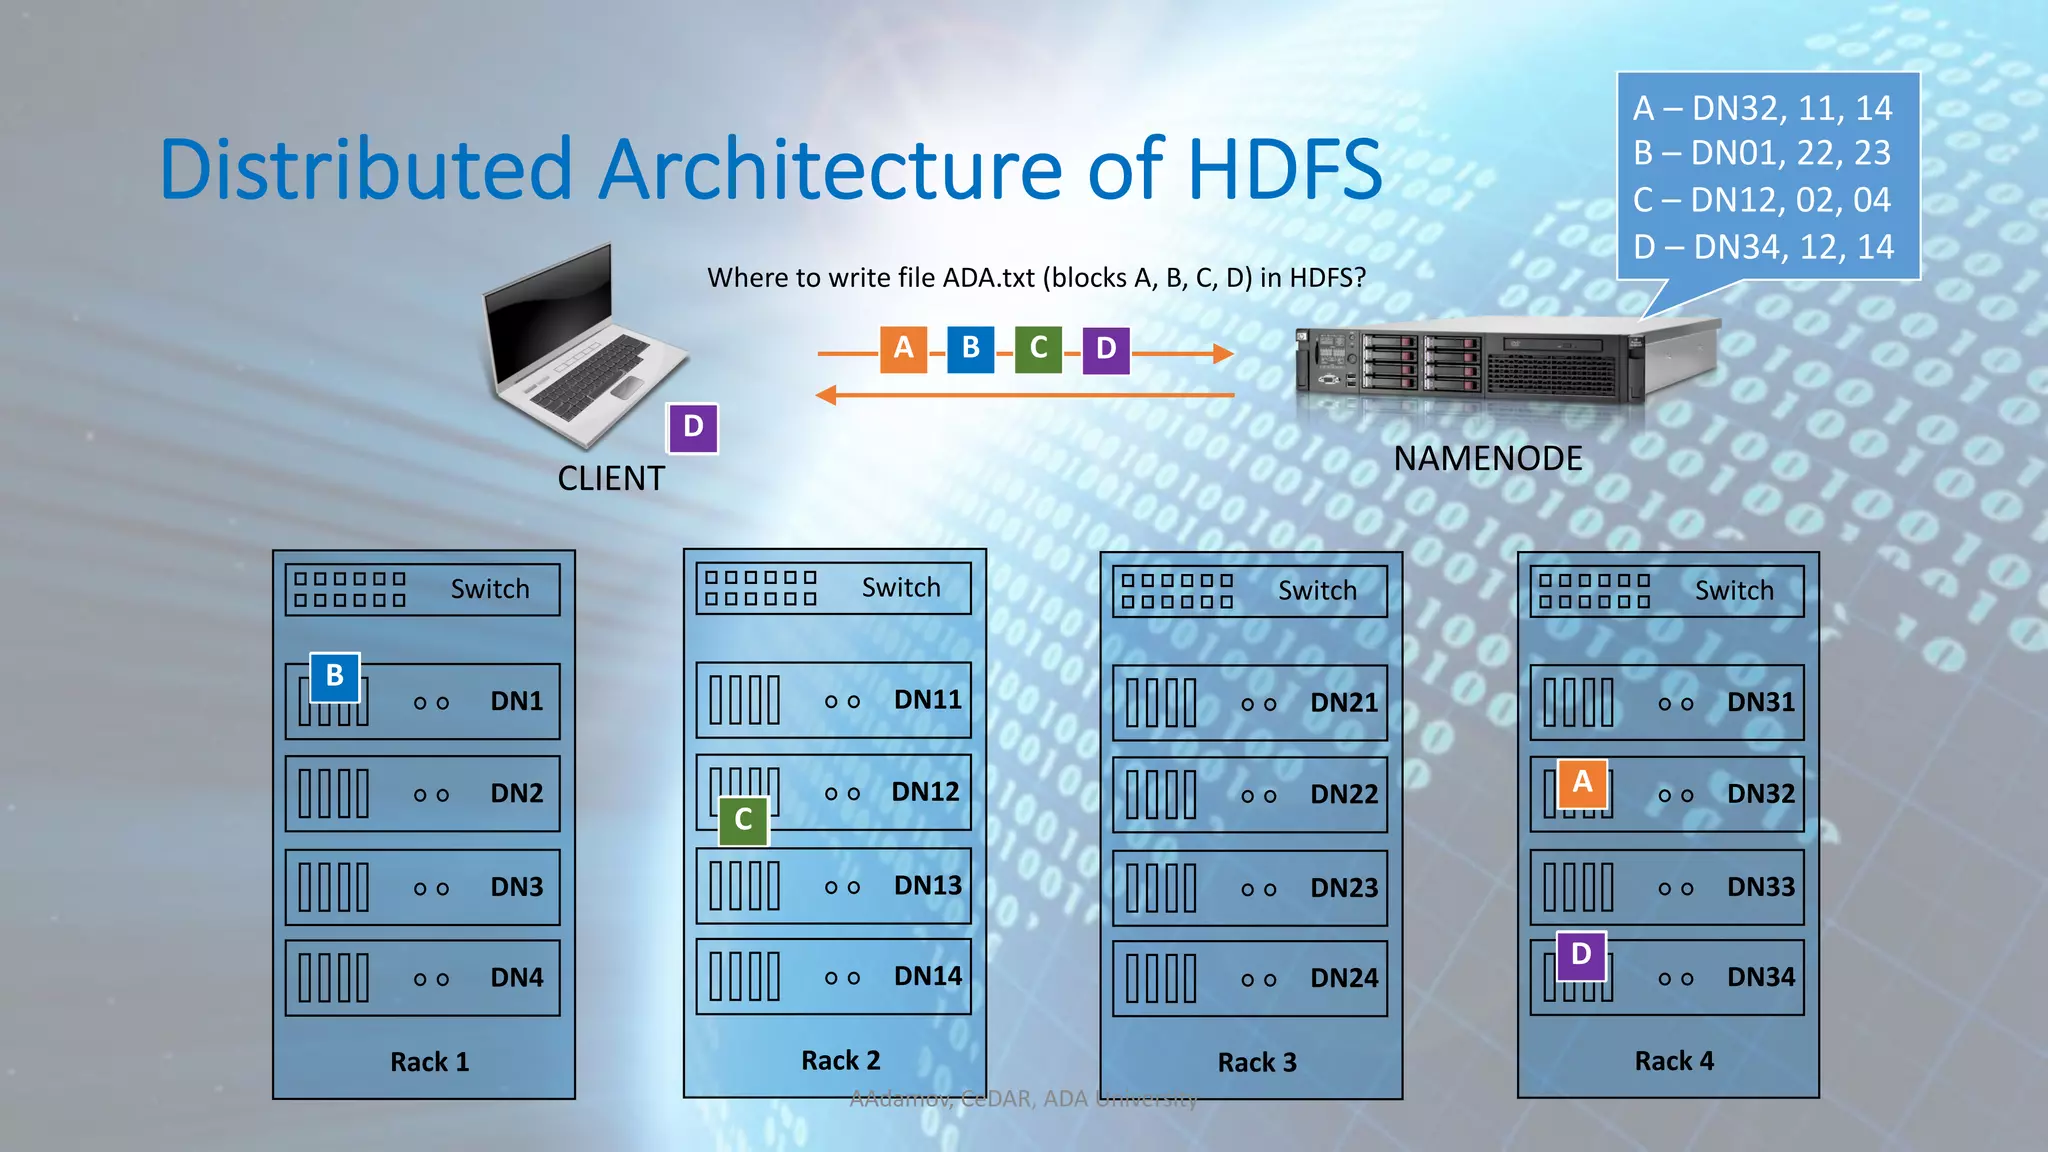
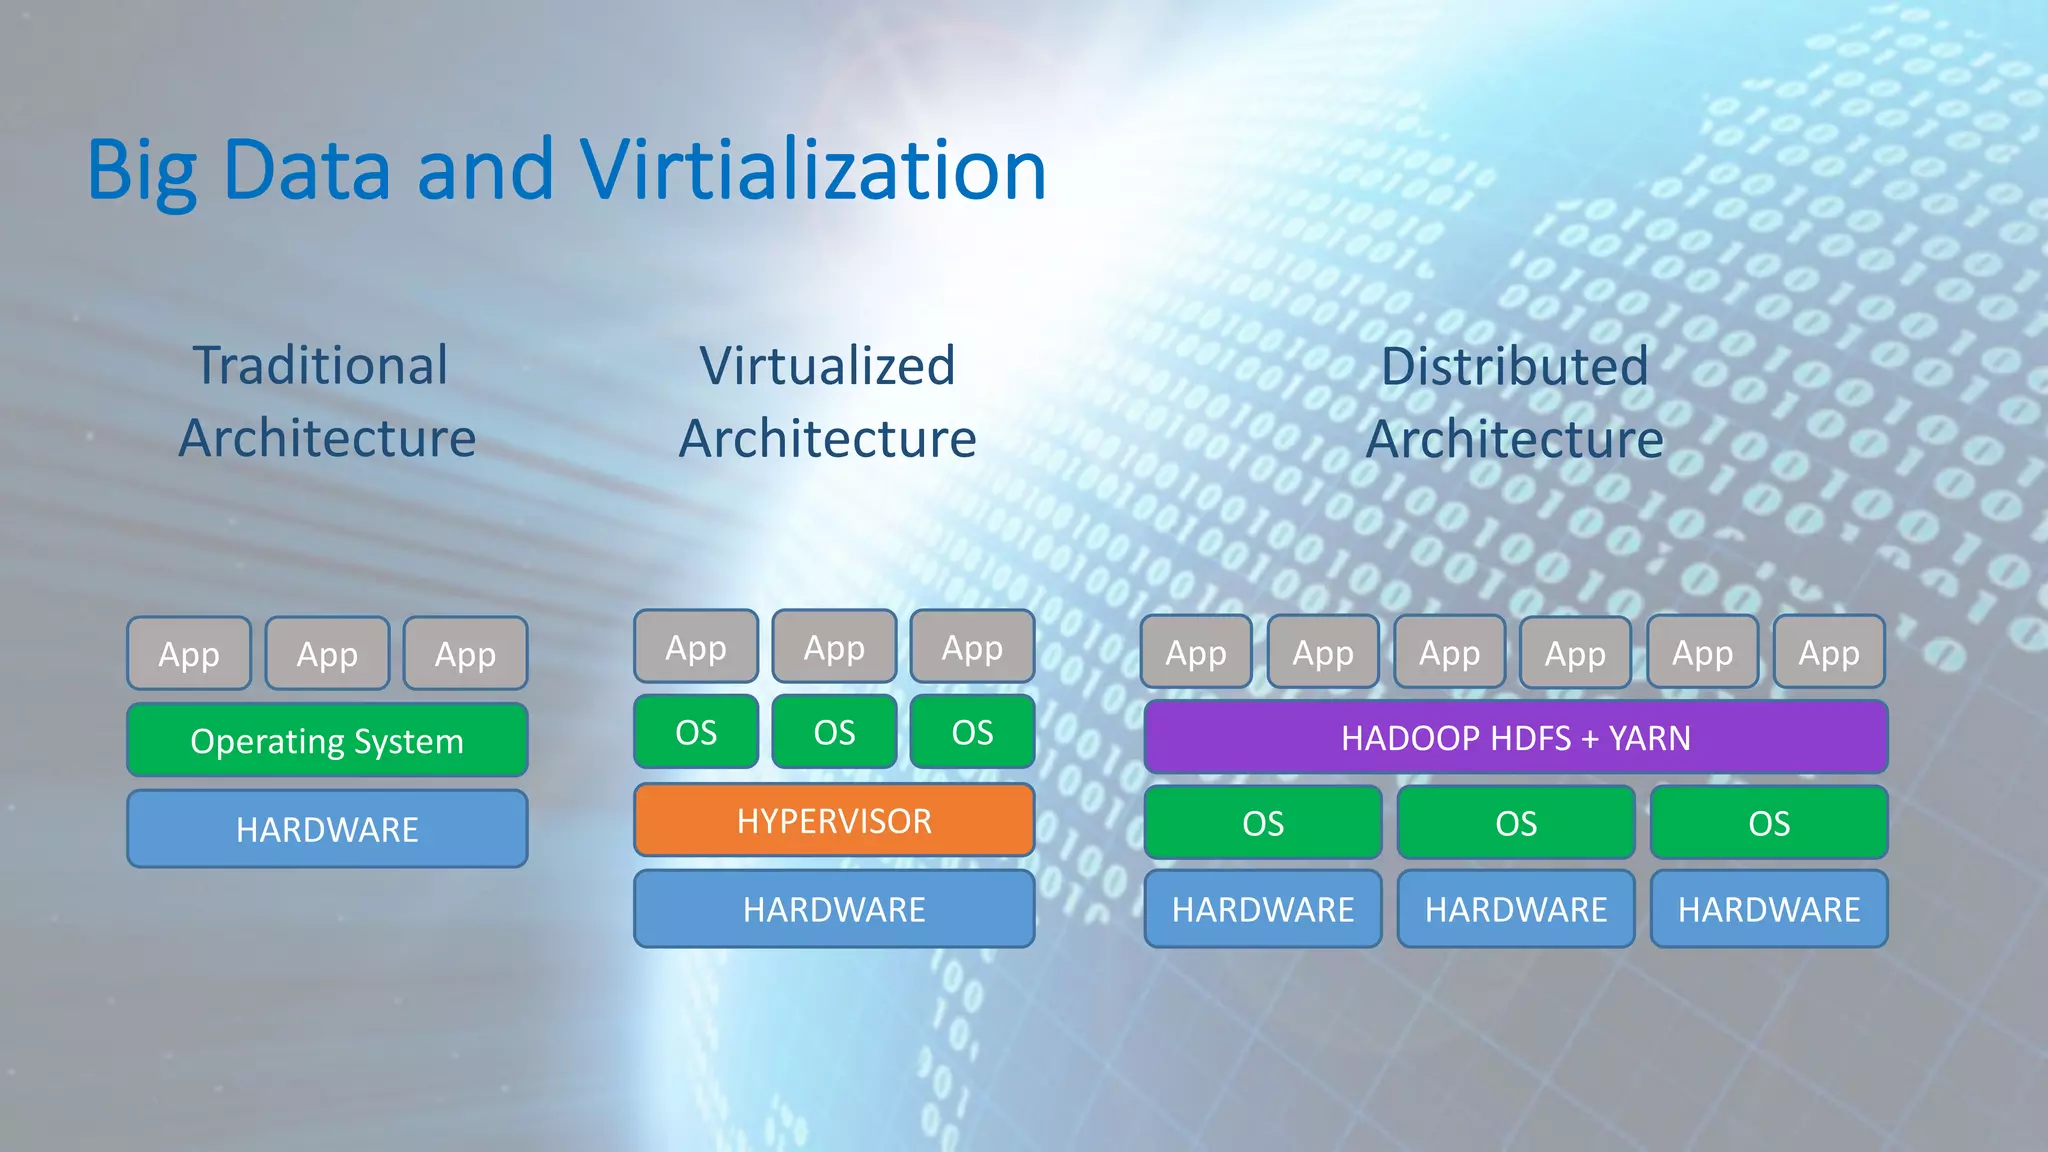
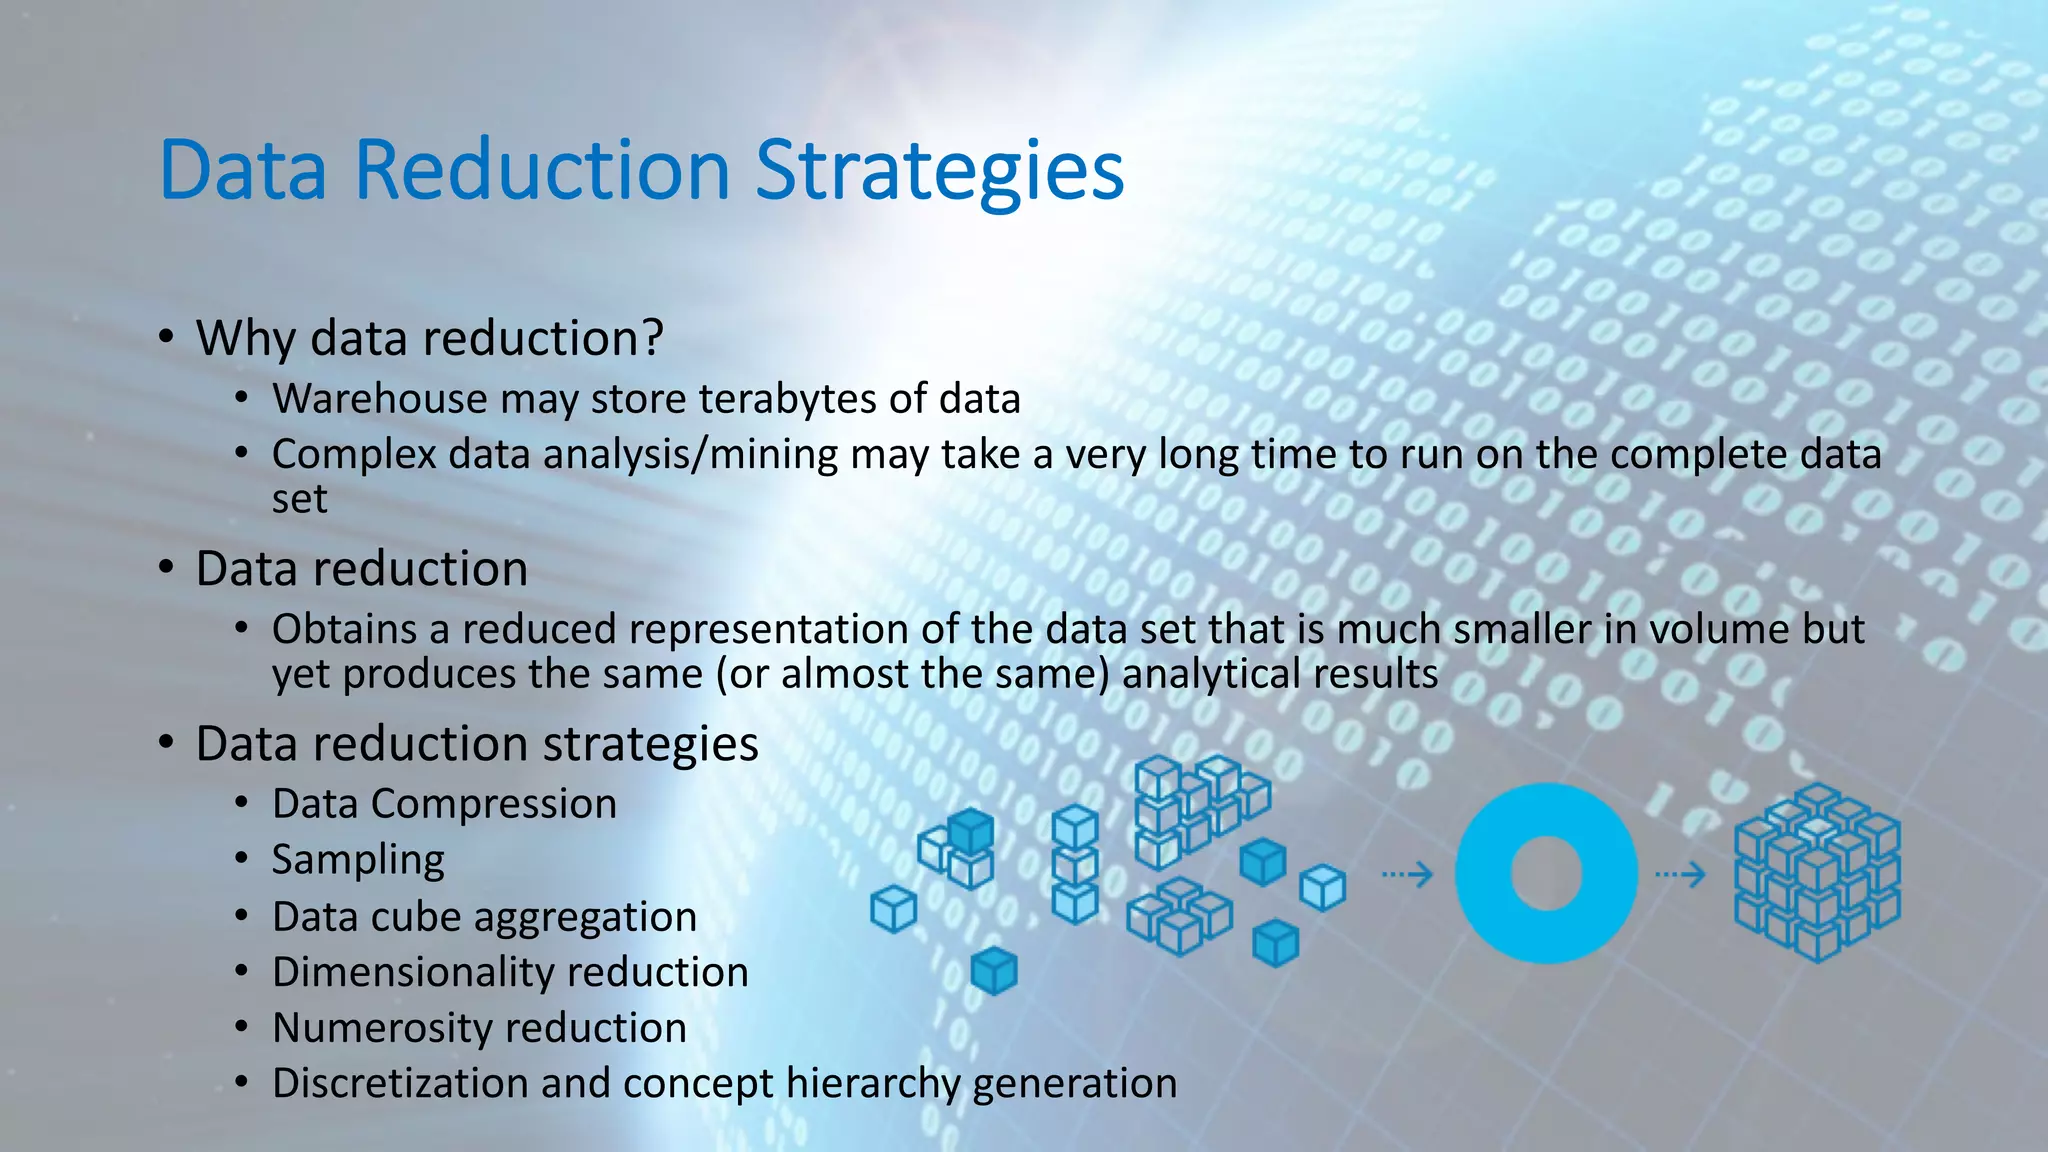
This document provides an overview of data analytics and machine learning. It discusses the data analytics lifecycle including data acquisition, preprocessing, analytics/machine learning, visualization, and governance. It then covers several key aspects of the lifecycle in more detail, such as the data preprocessing steps of cleaning, integration, transformation, reduction, and discretization. Machine learning algorithms are categorized as supervised learning techniques like logistic regression, neural networks, and support vector machines.