Download to read offline

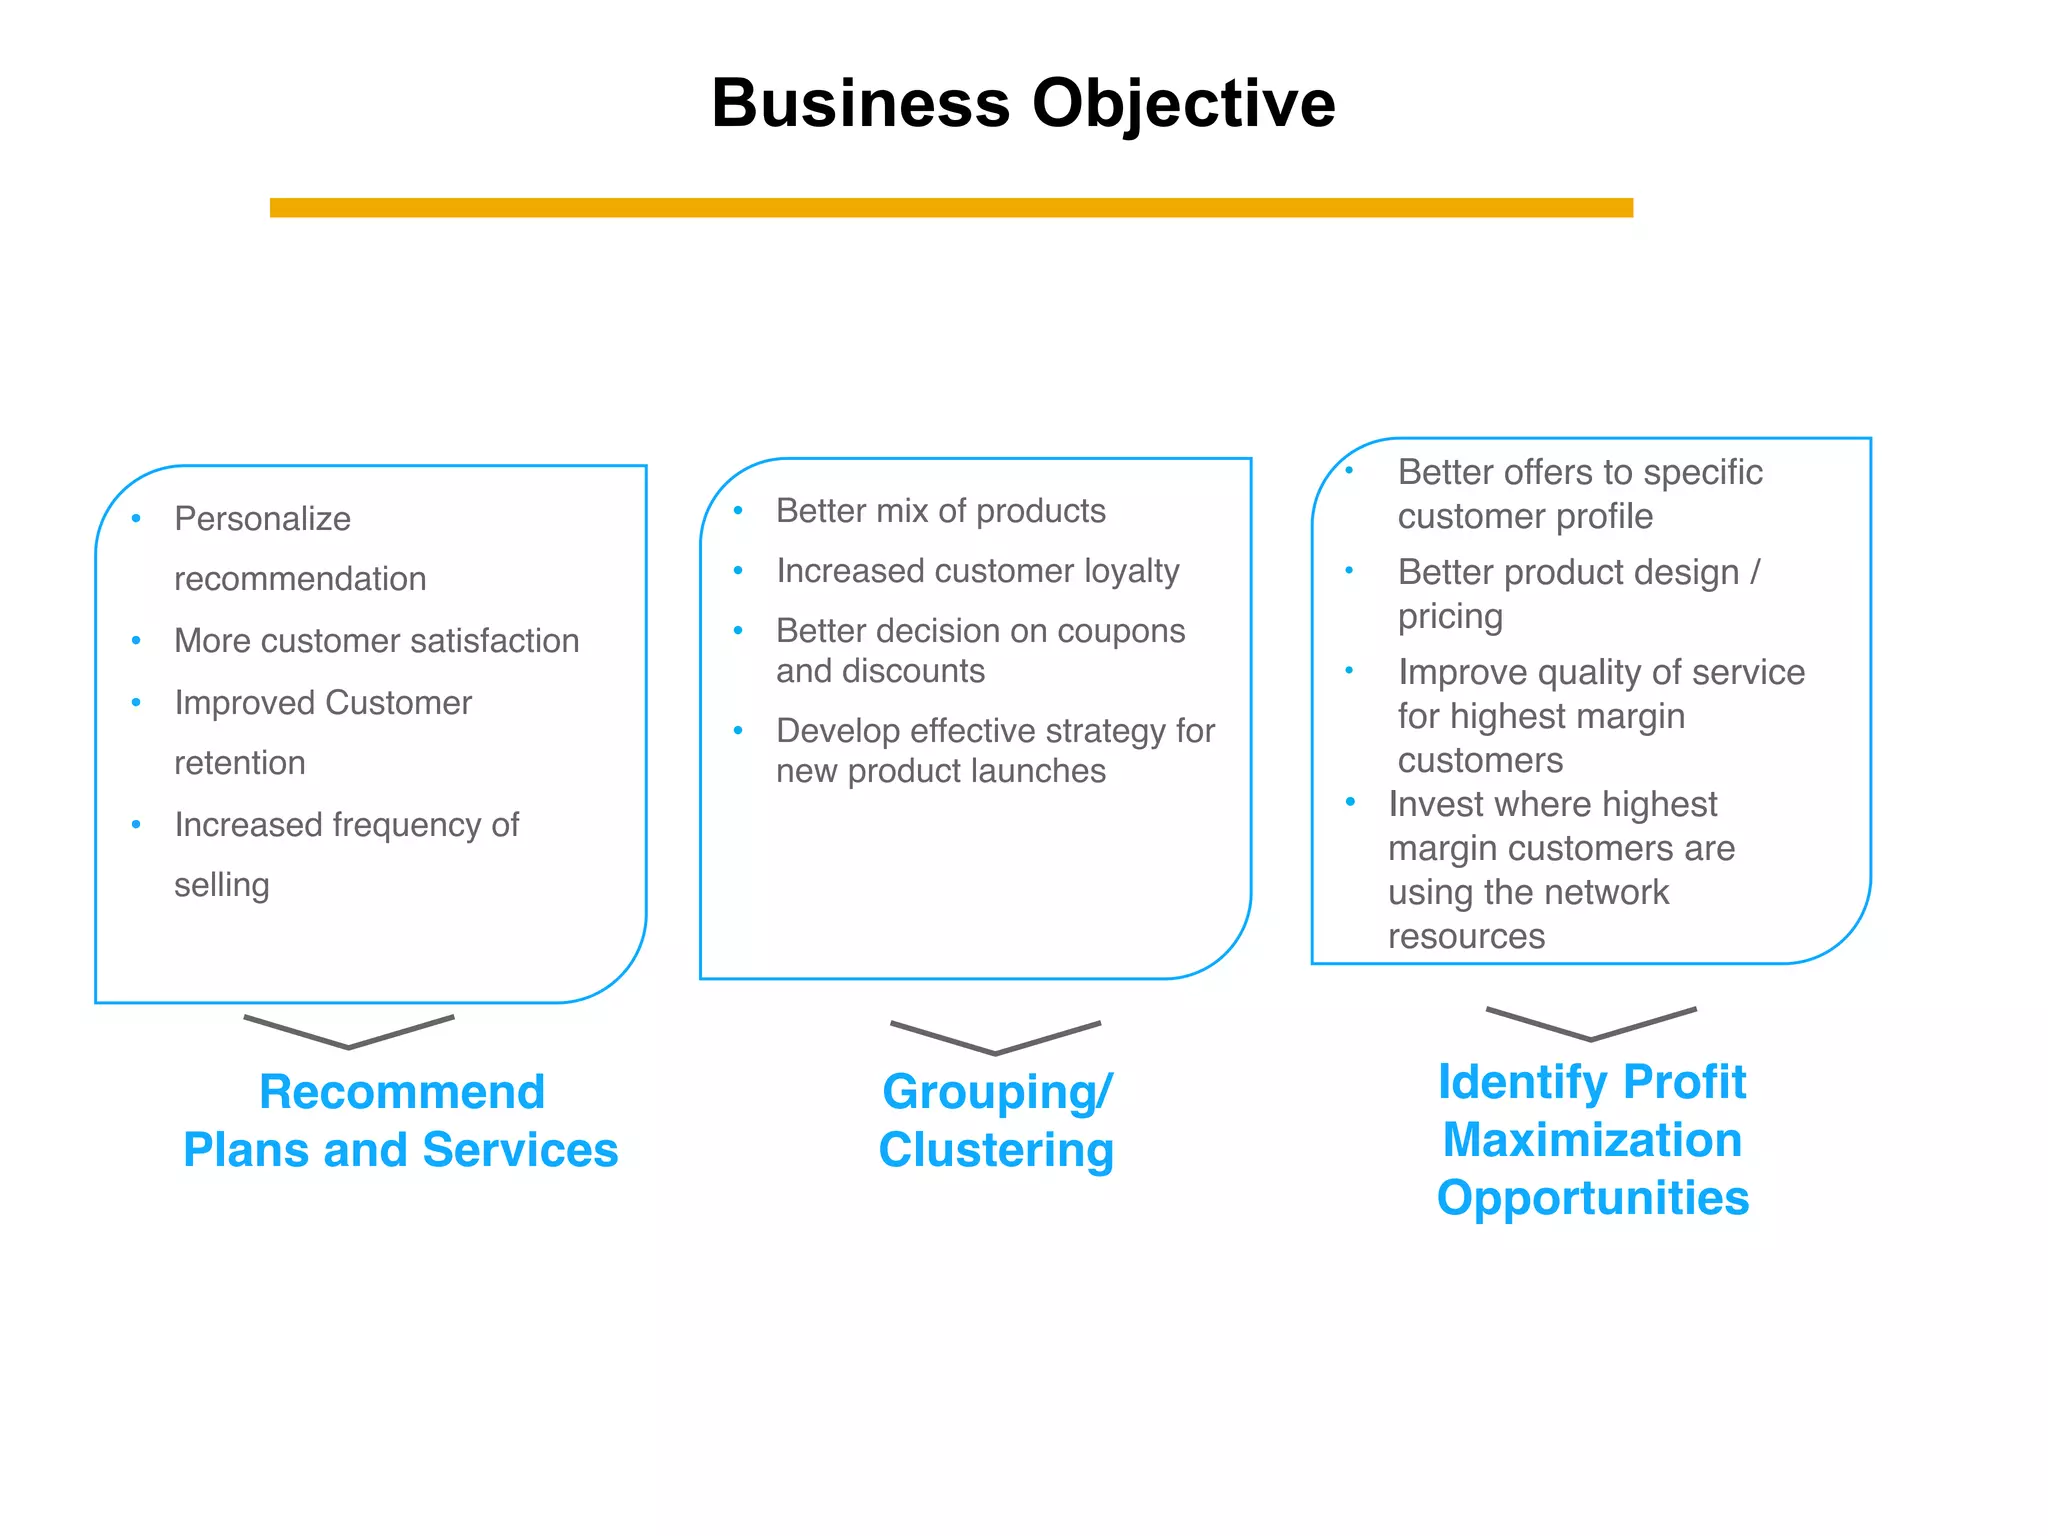
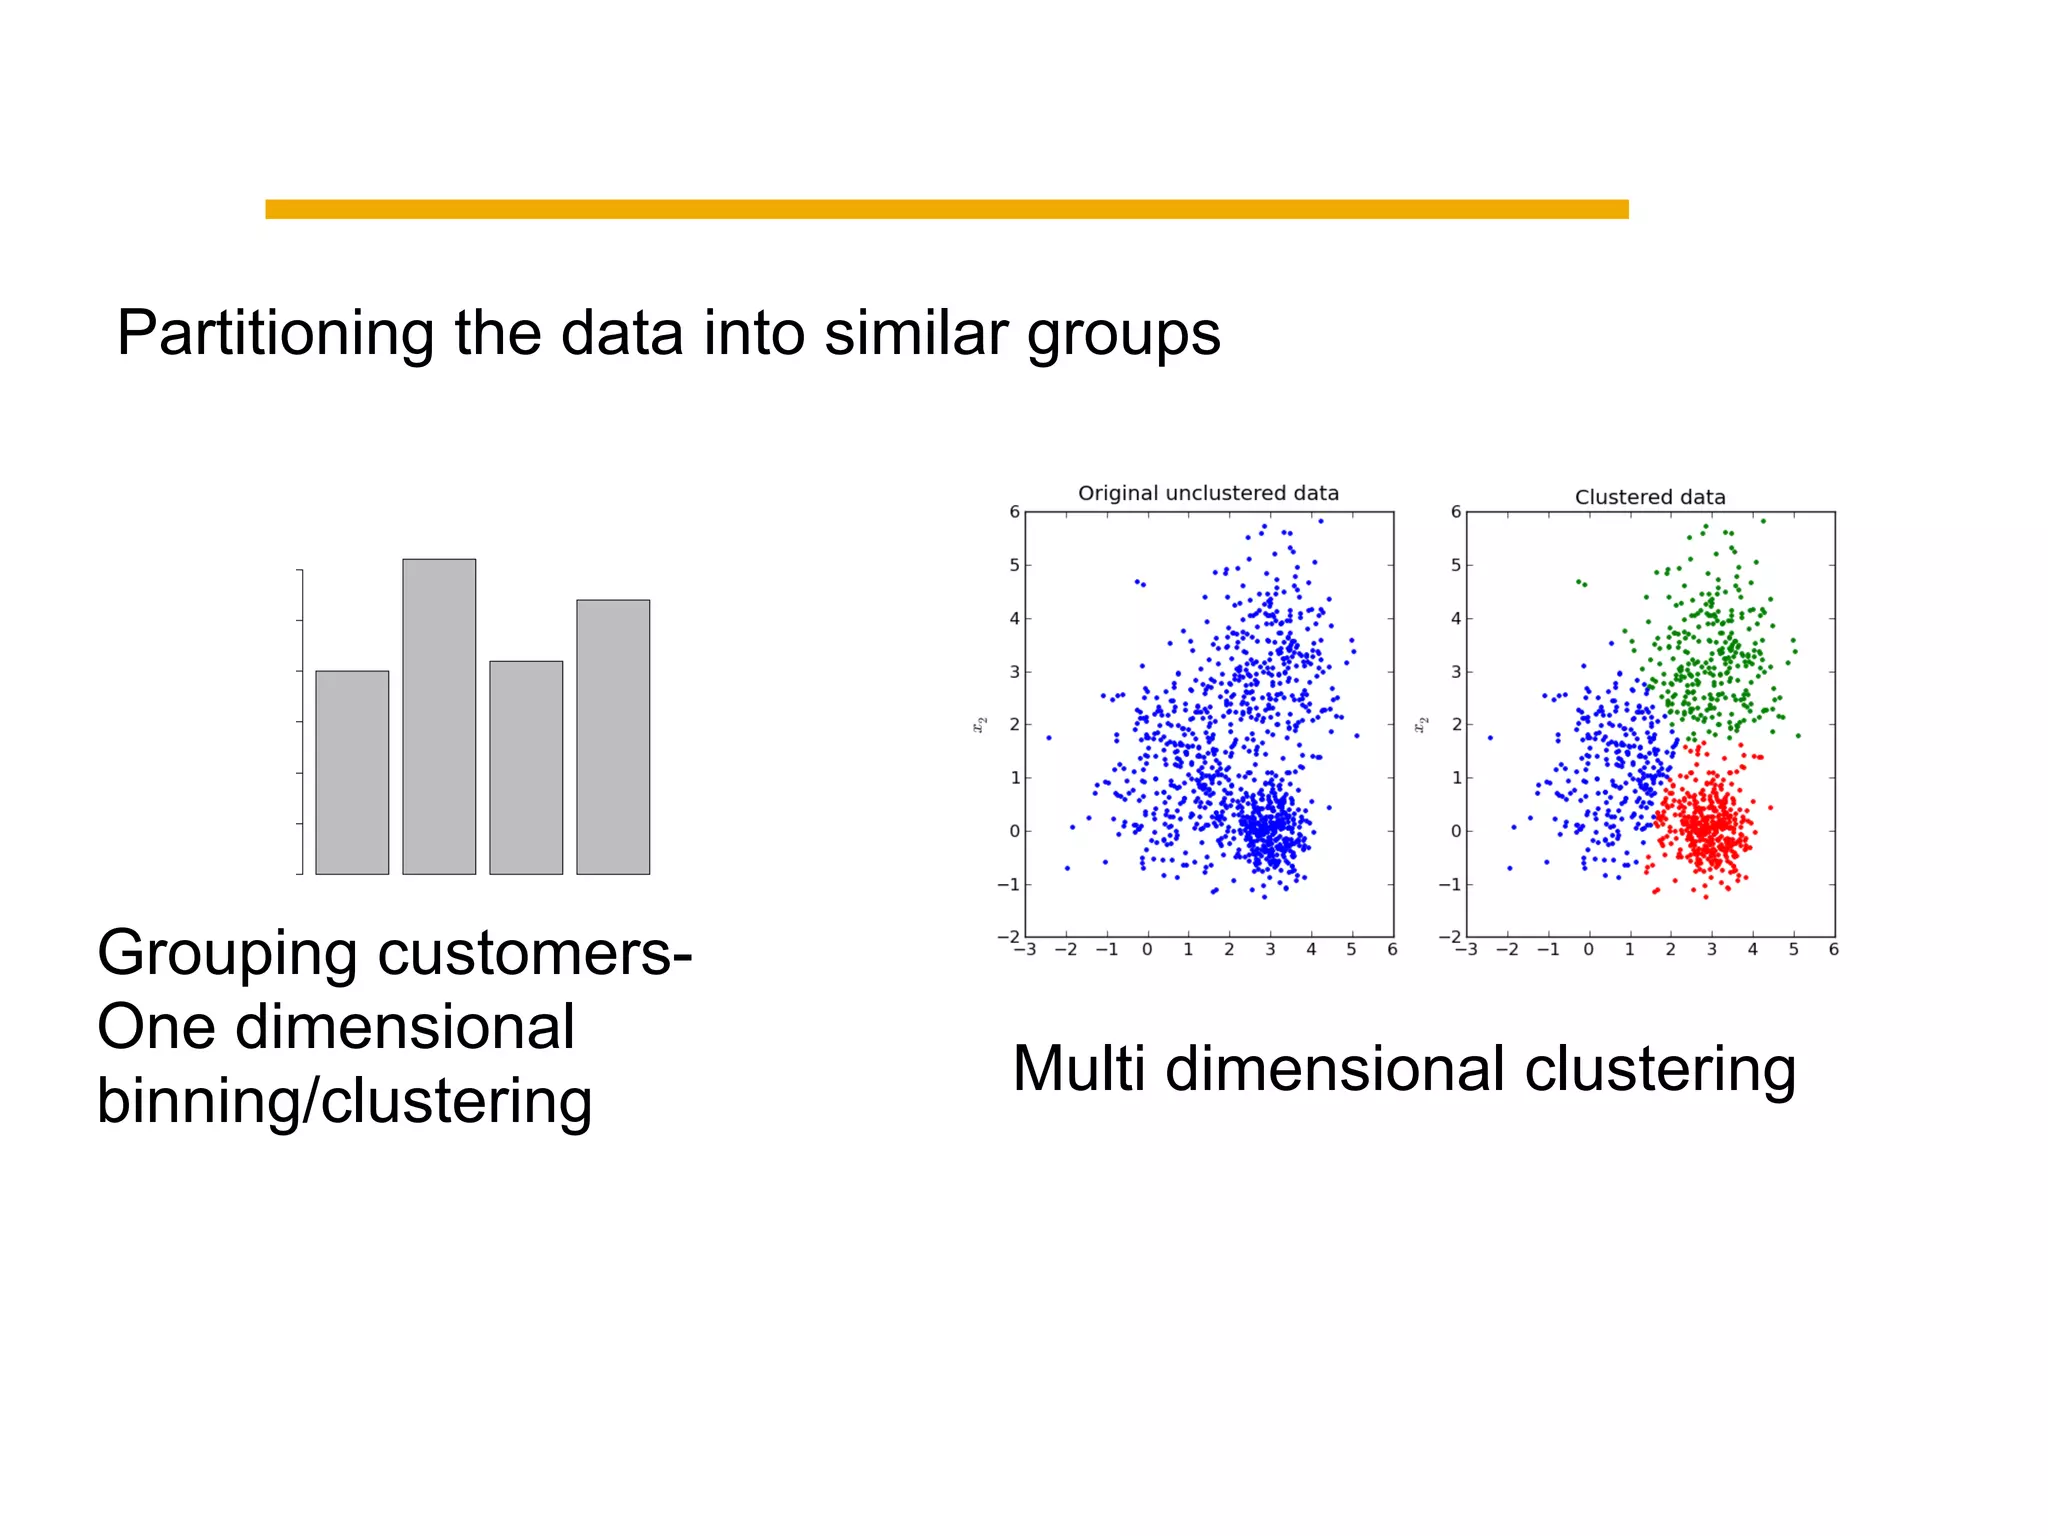
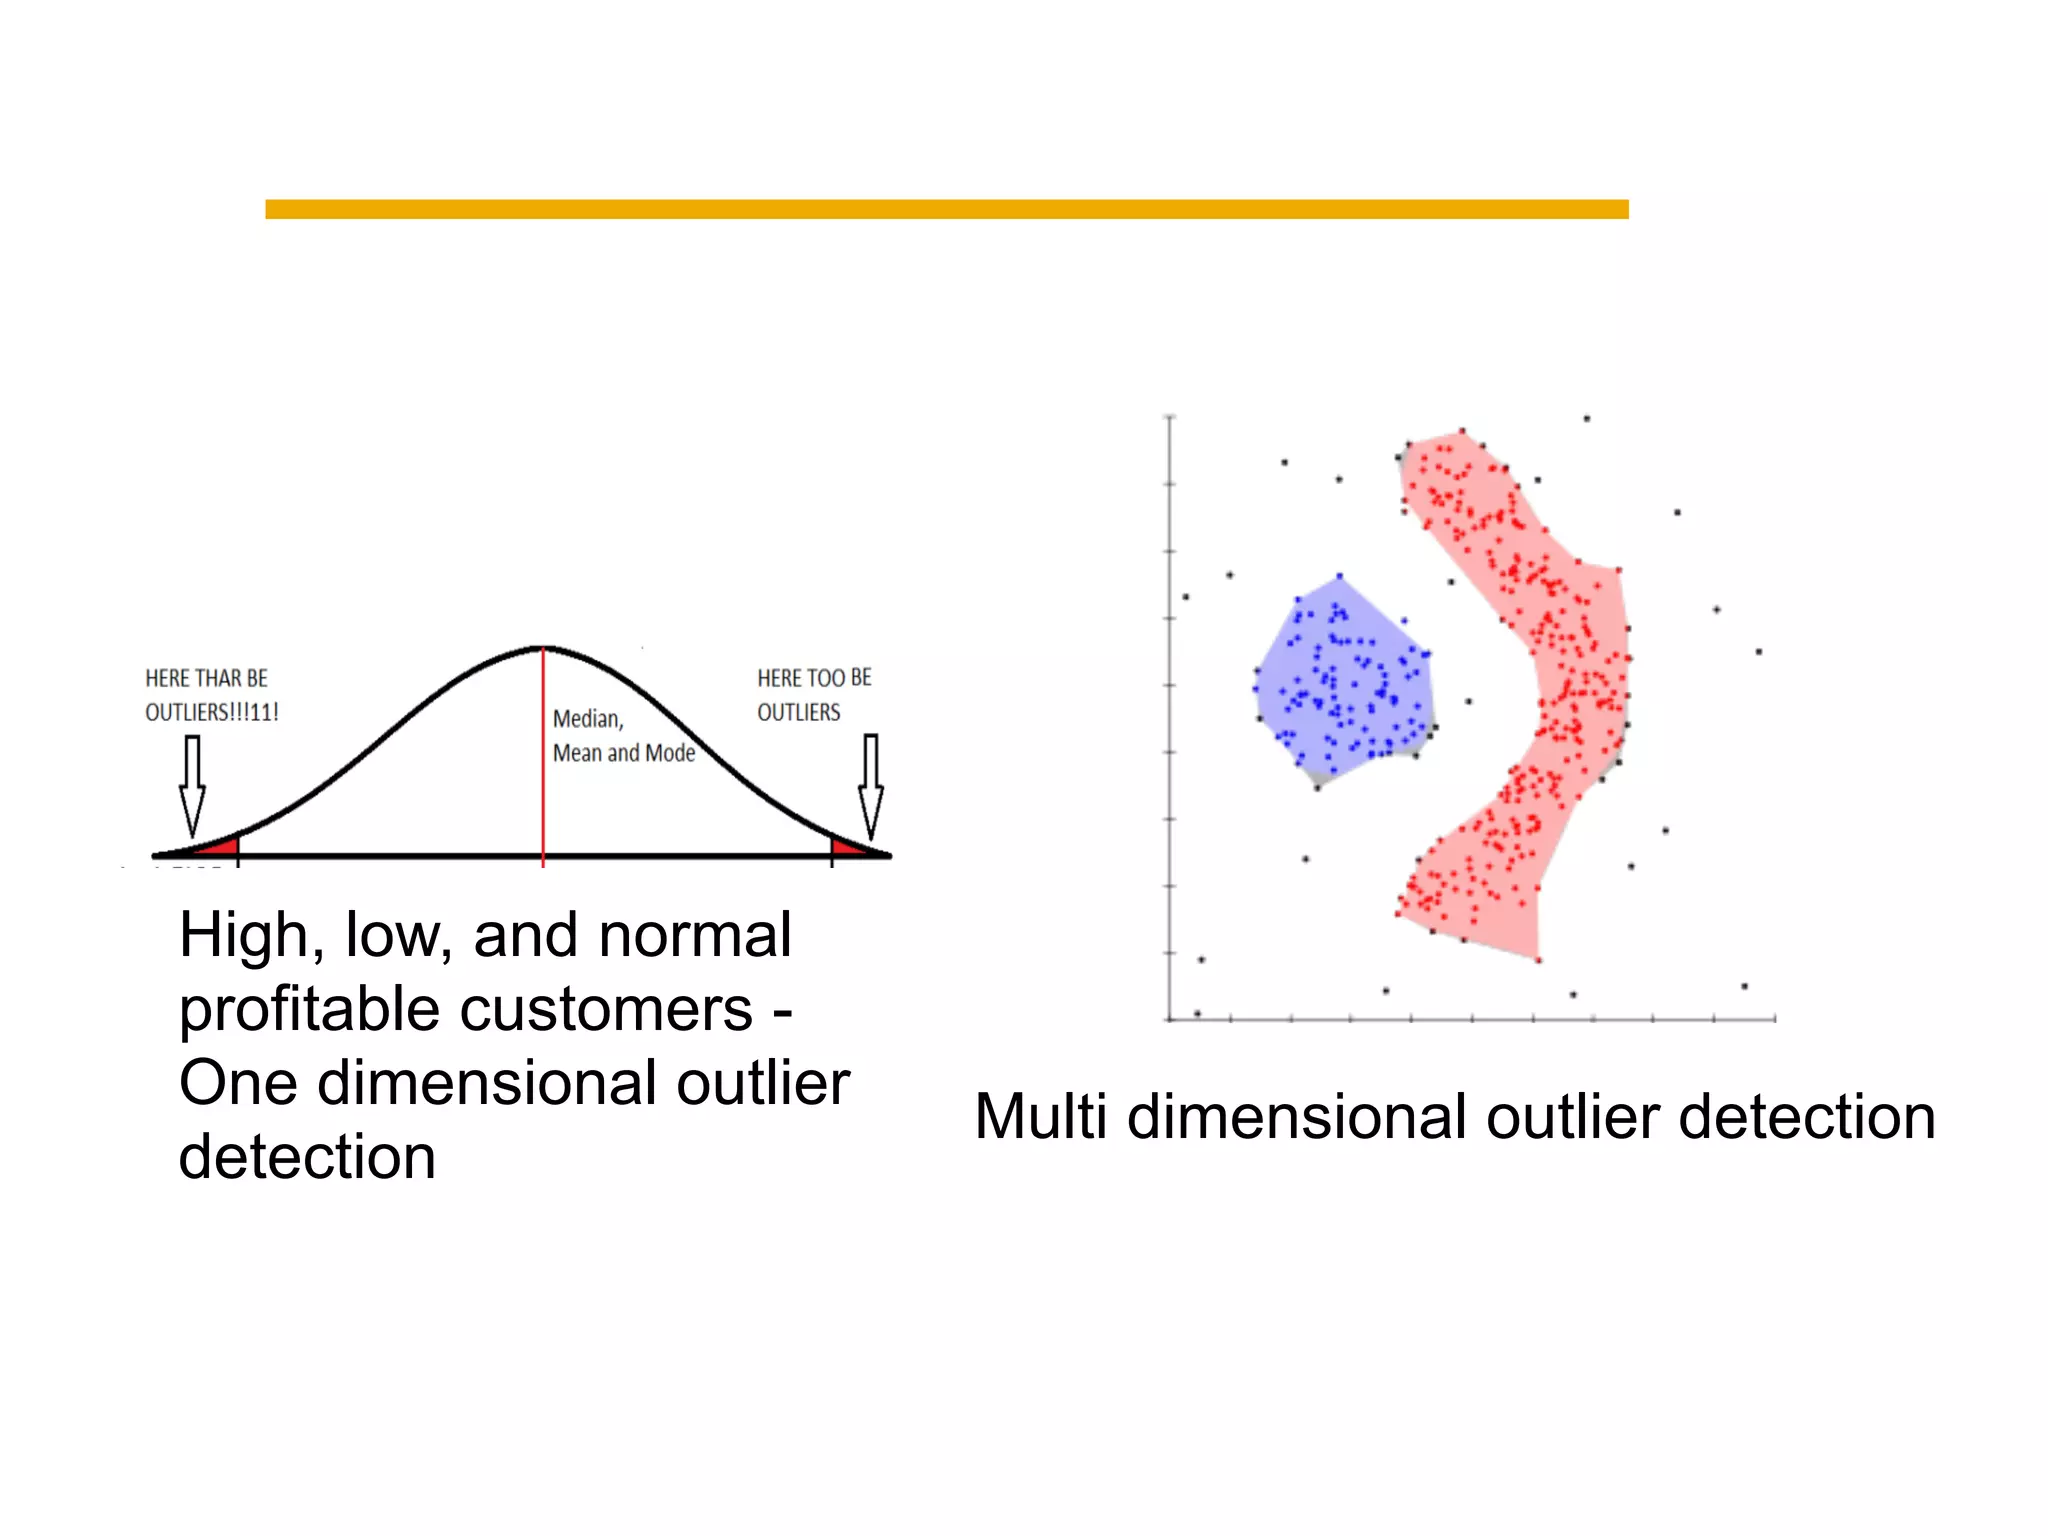
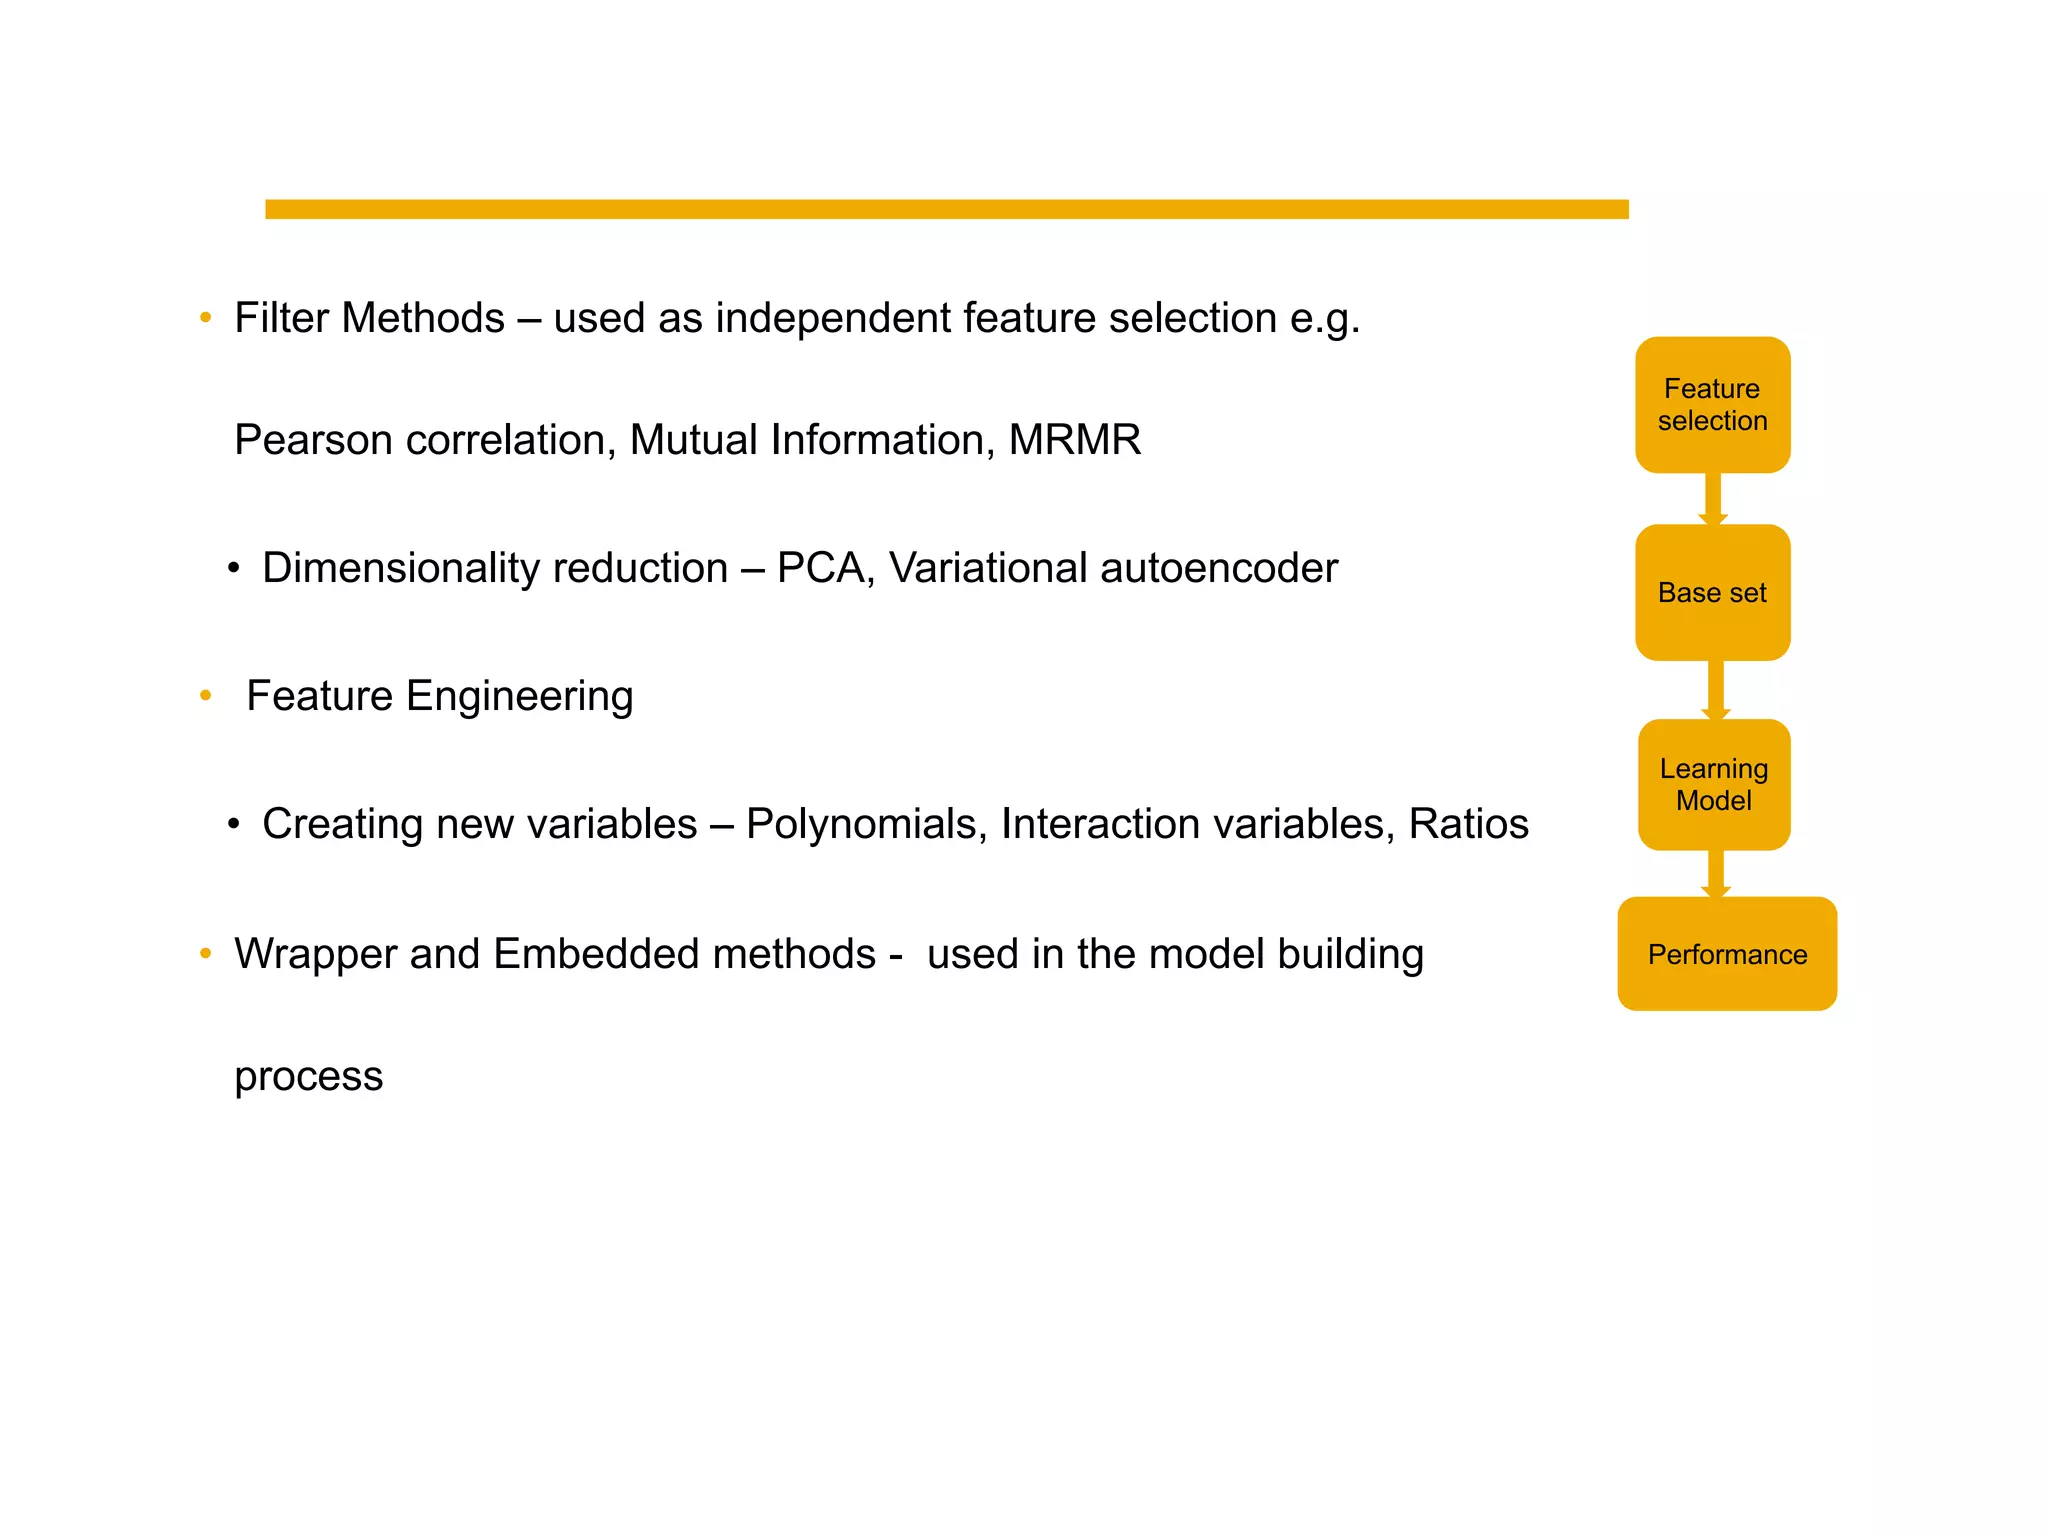

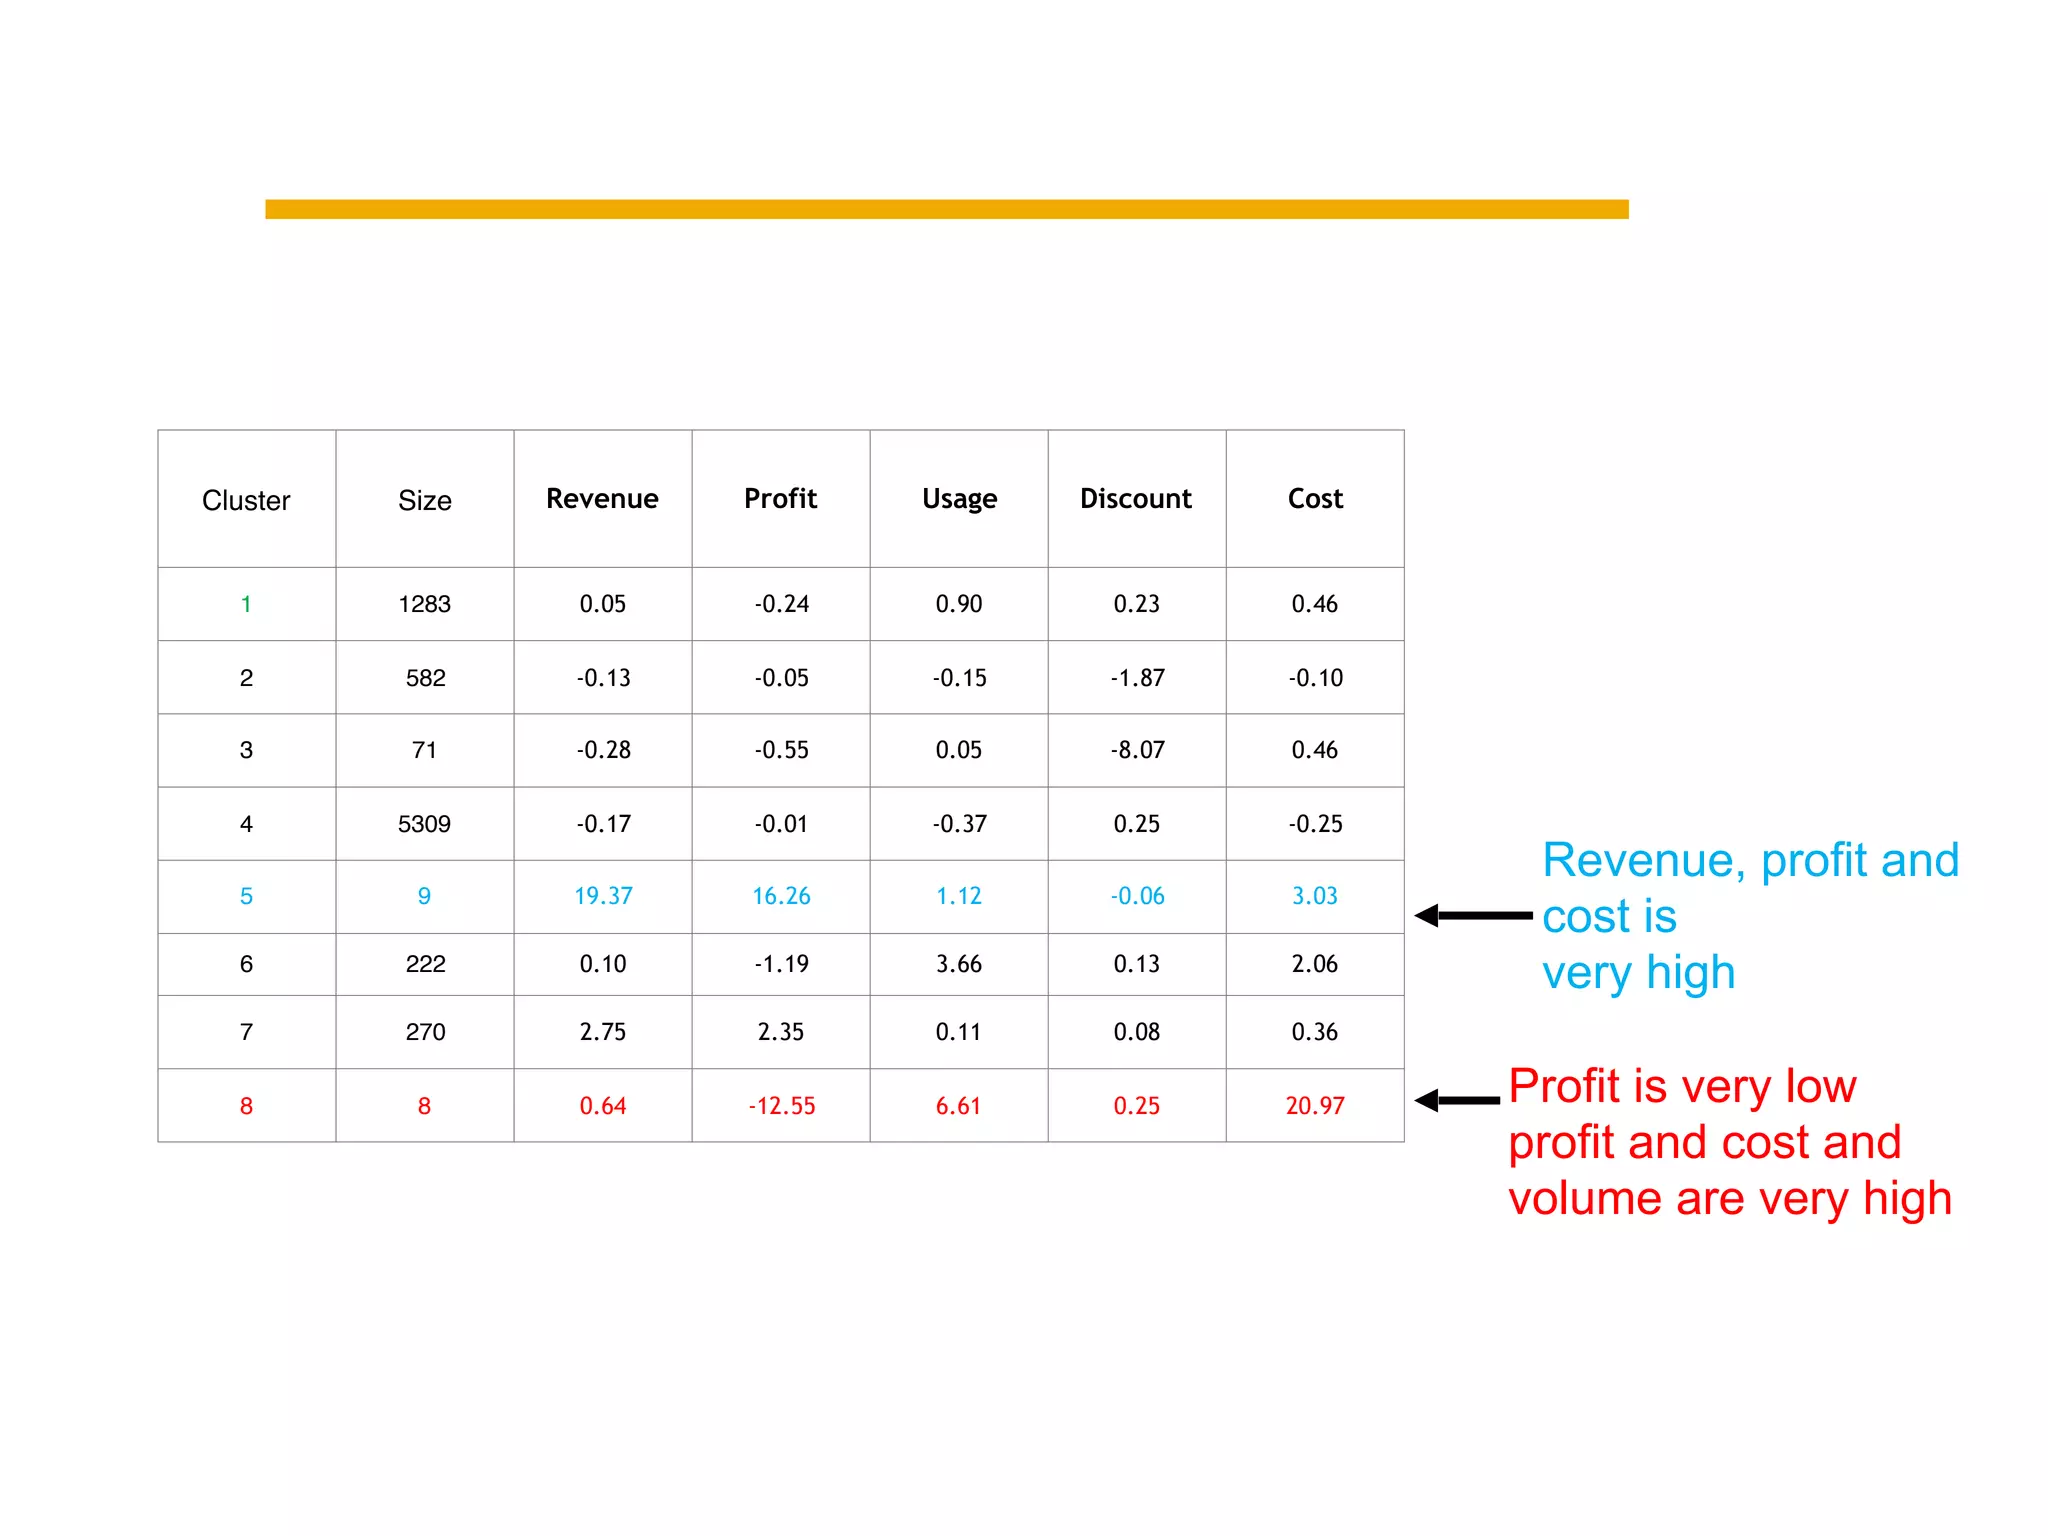
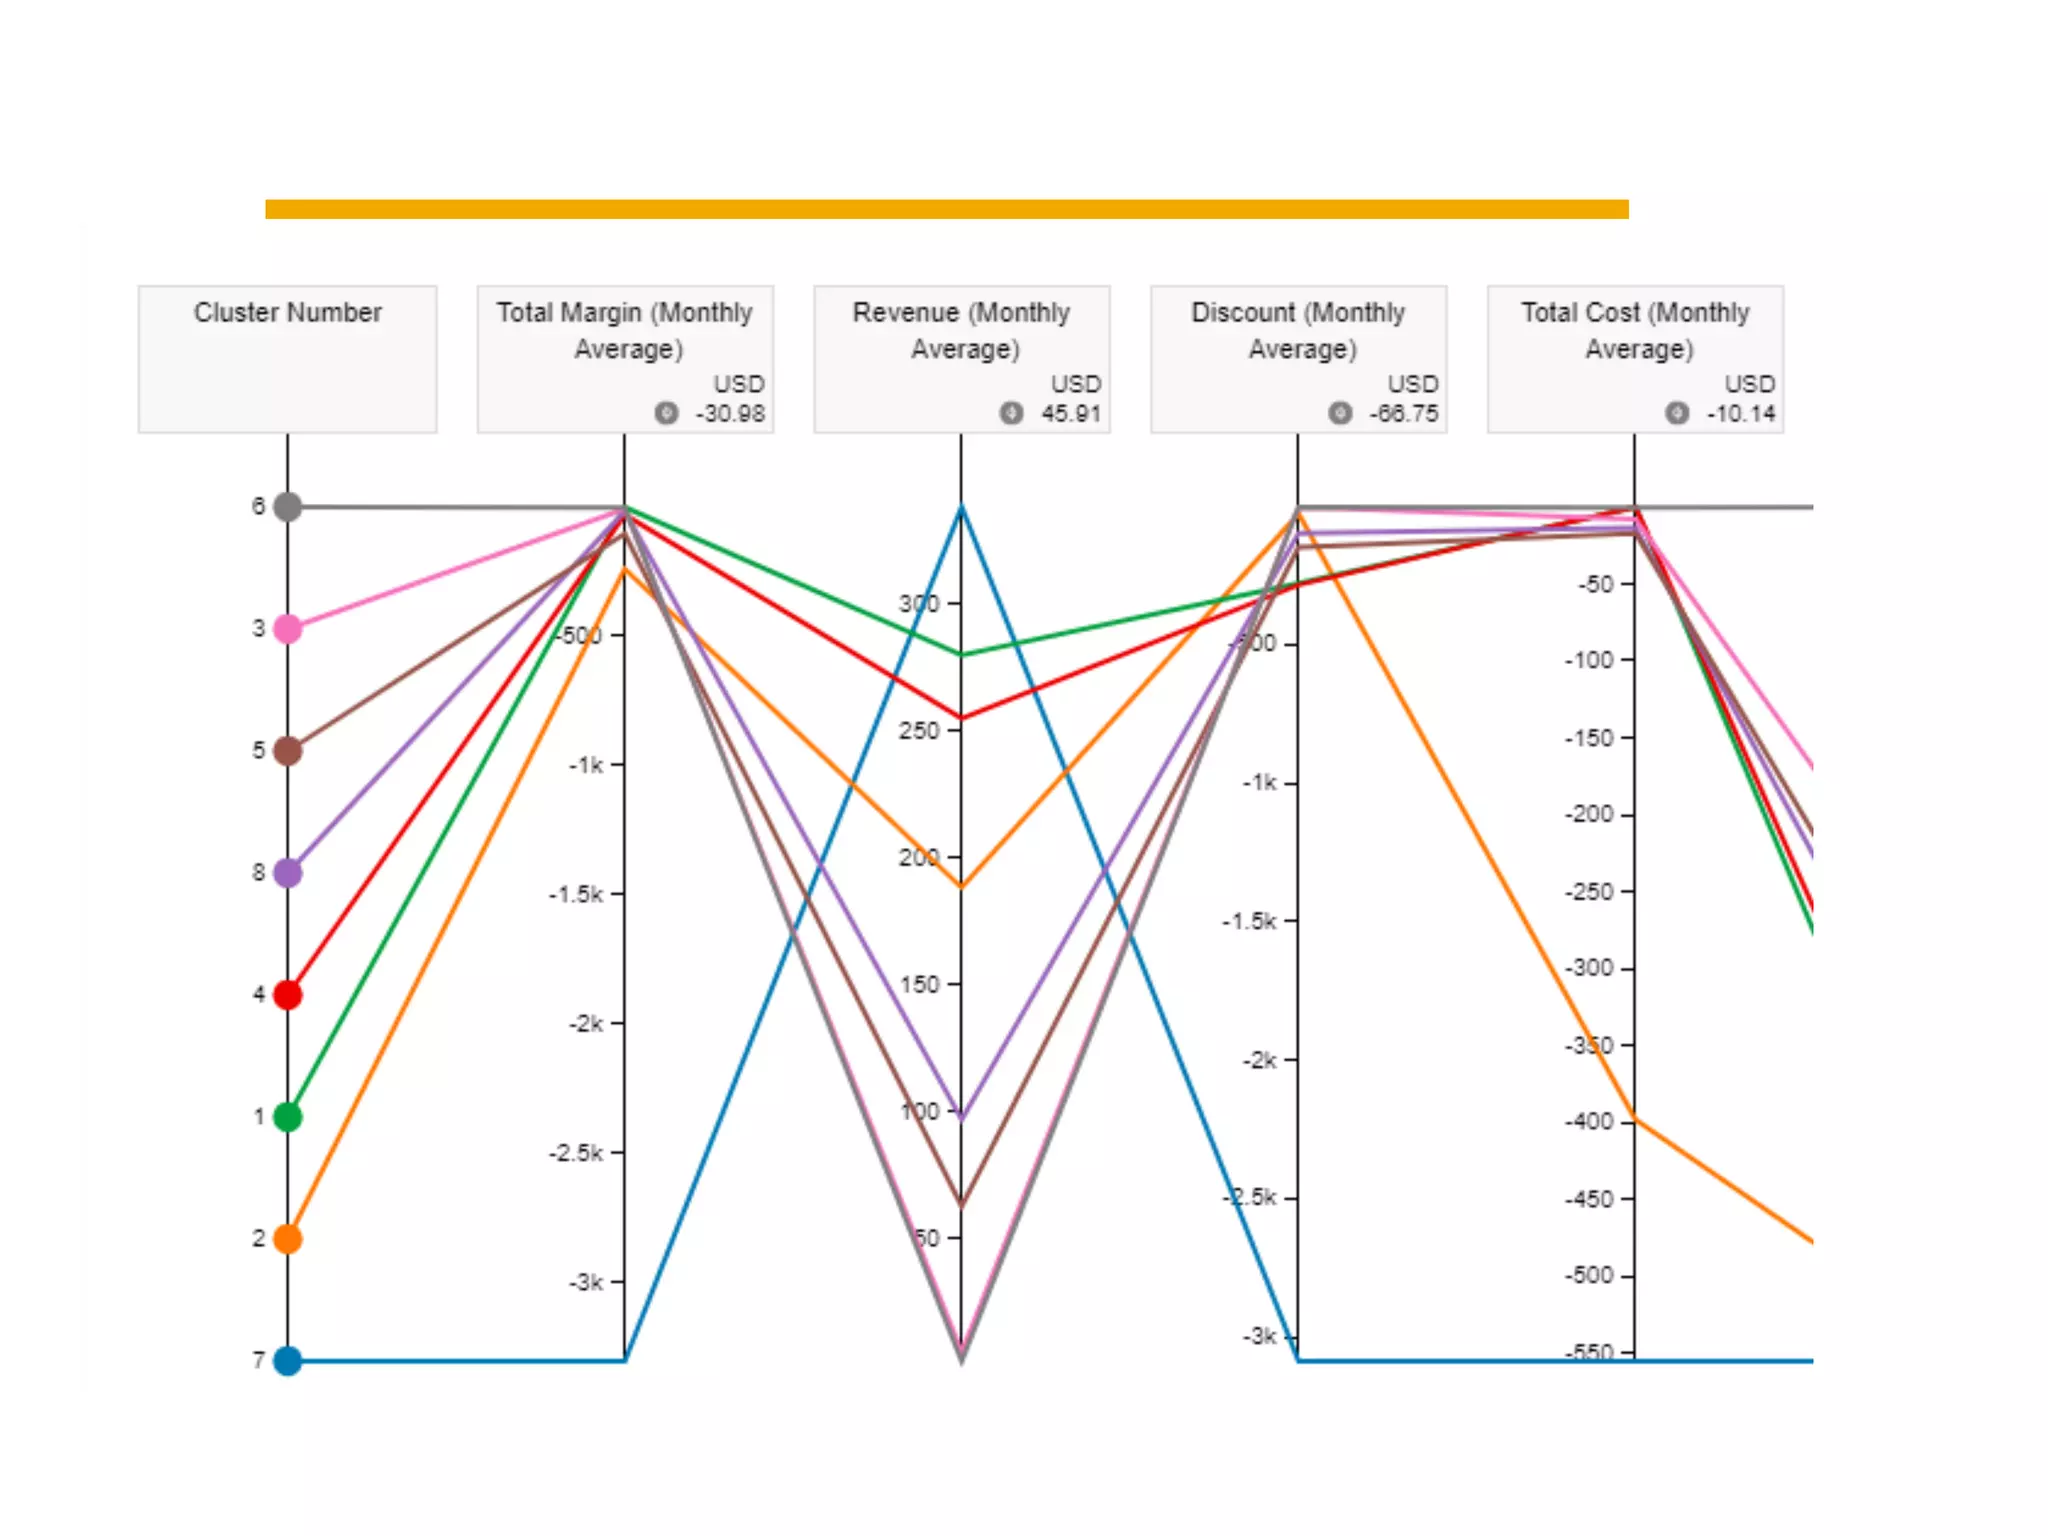

This document summarizes building a data solution for a telecom company. The objectives were to personalize recommendations, increase customer retention and loyalty. The data included large volumes of static and dynamic customer data. The pipeline involved clustering customers into groups, identifying high and low profit customers as outliers, and feature selection before building learning models. Insights from the models included clustering customers by revenue, profit, usage, discounts and costs to identify optimization opportunities.