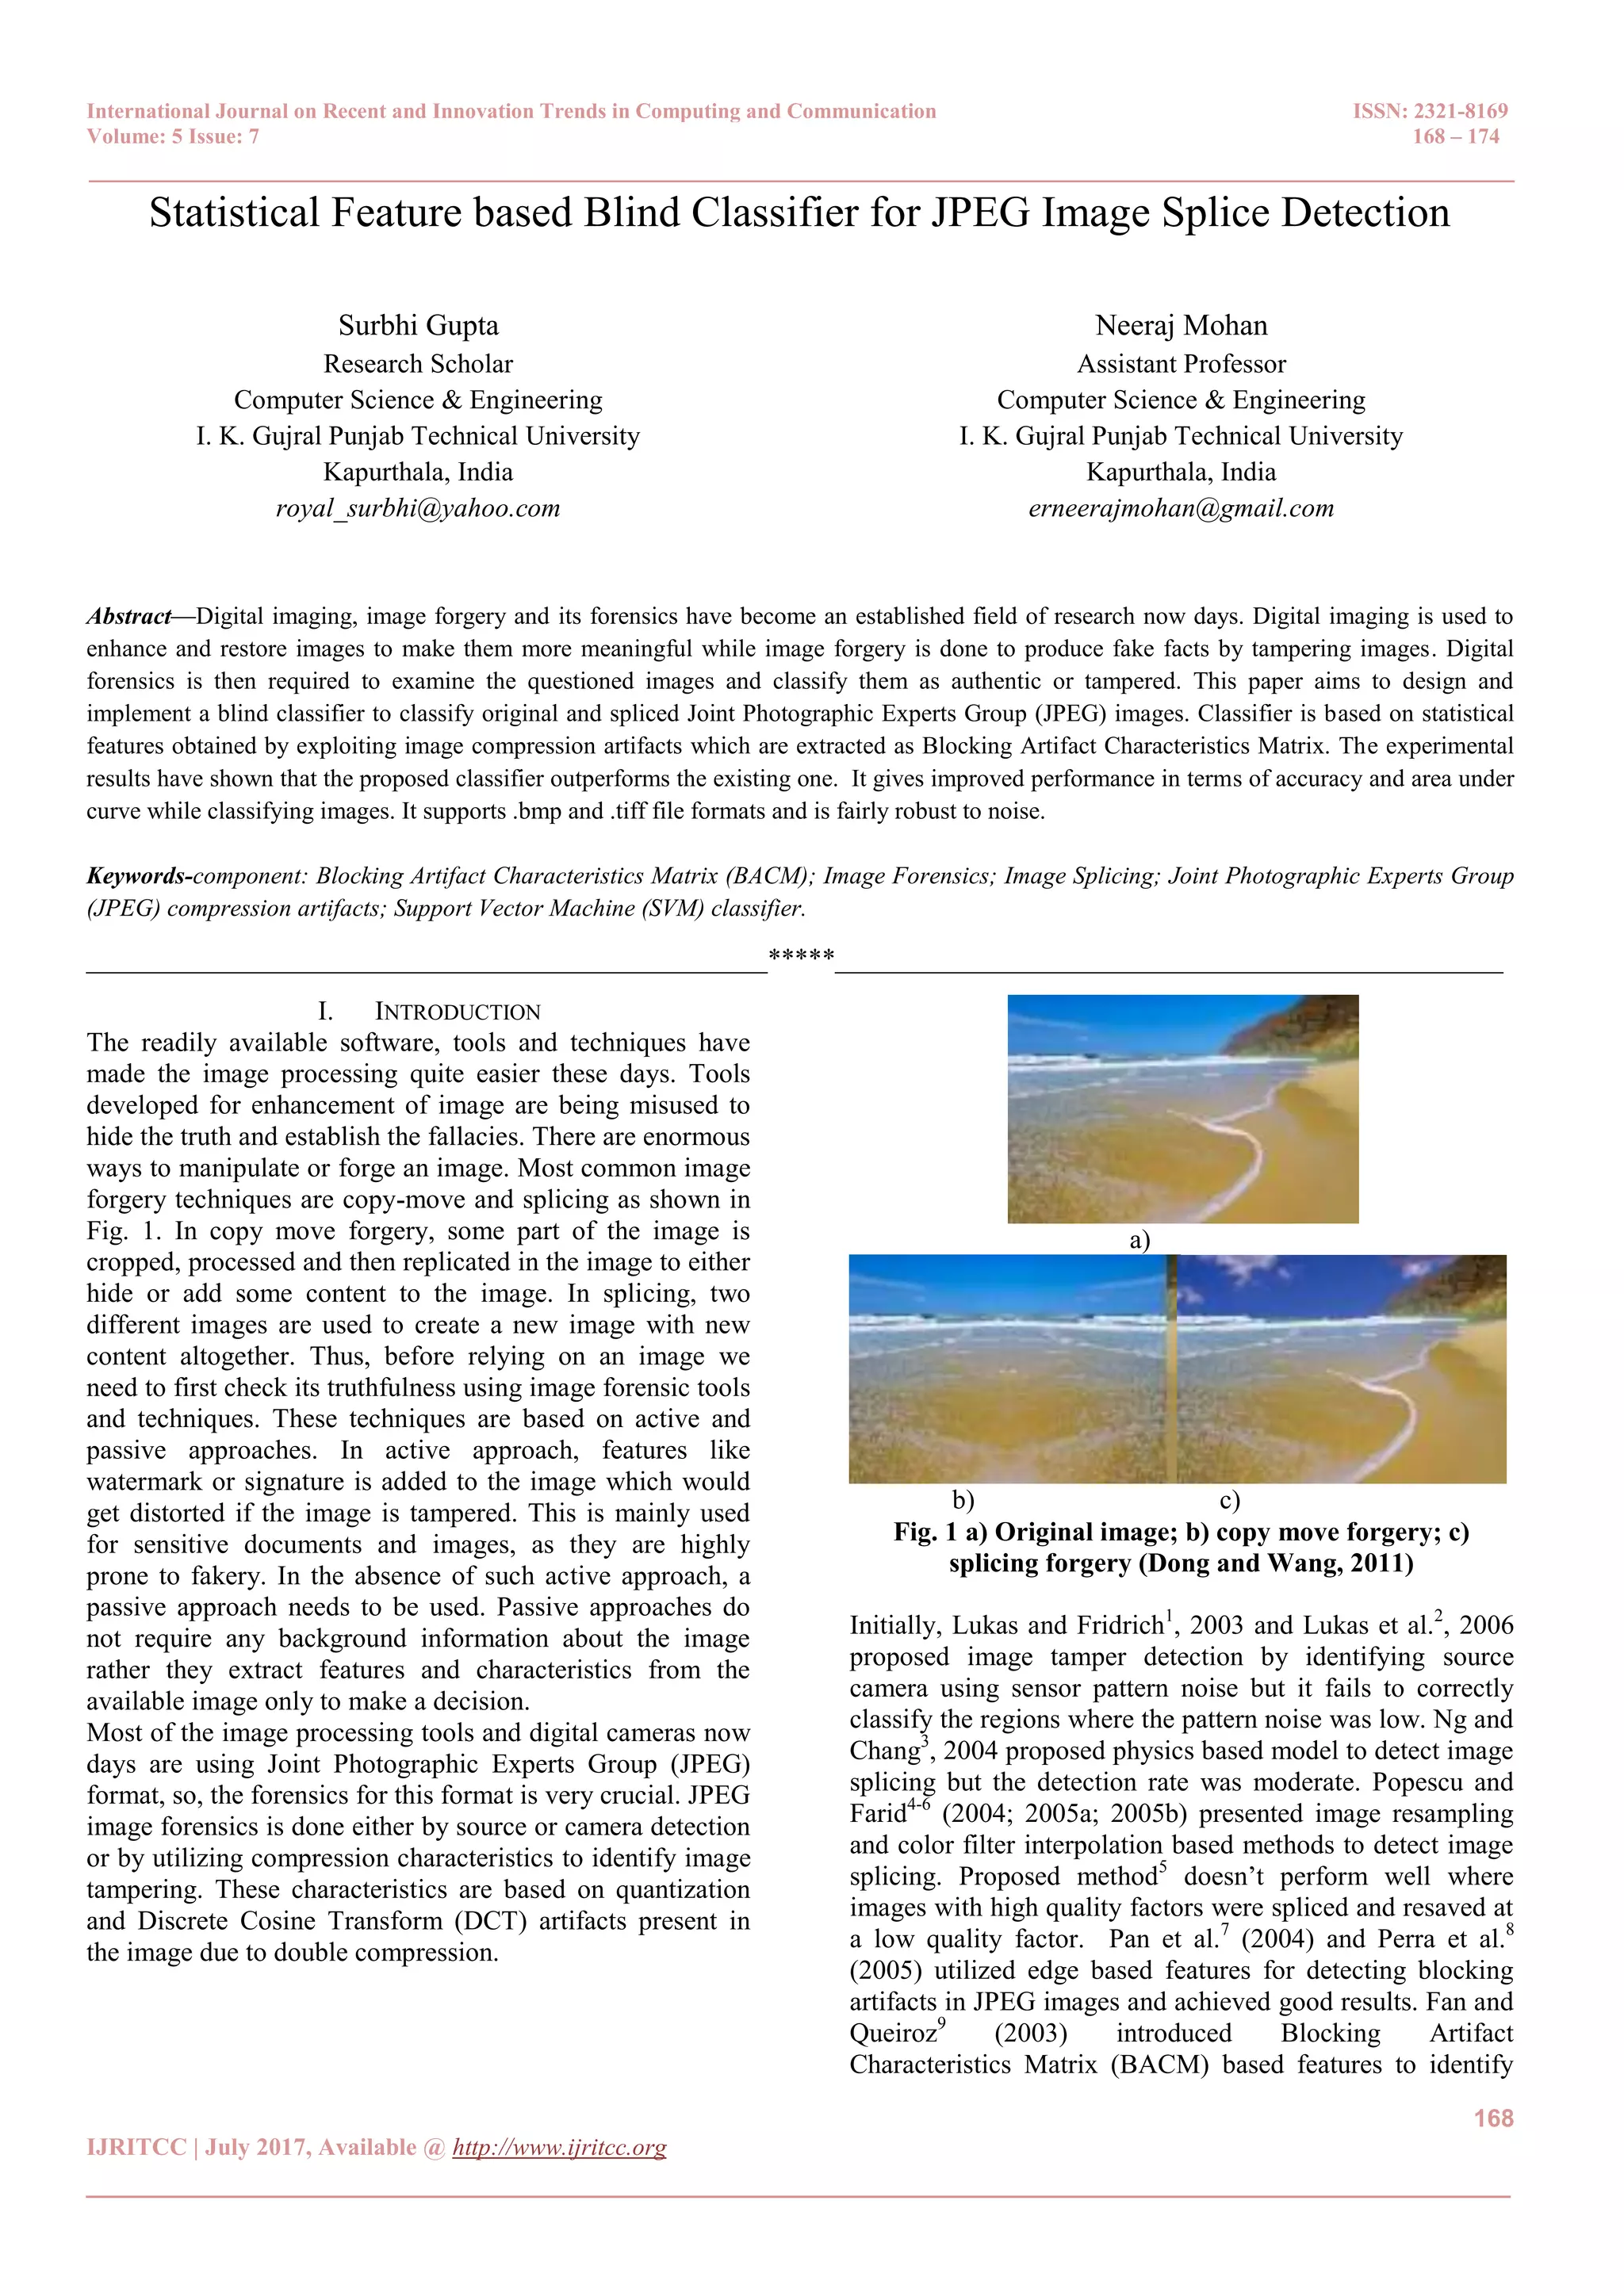
The paper presents a novel blind classifier for detecting spliced JPEG images using statistical features derived from image compression artifacts. By employing a blocking artifact characteristics matrix, the classifier demonstrates improved accuracy and performance over existing methods, capable of working with various file formats. Experimental results indicate that it successfully identifies image tampering even under noise and preprocessing conditions.
![International Journal on Recent and Innovation Trends in Computing and Communication ISSN: 2321-8169 Volume: 5 Issue: 7 168 – 174 _______________________________________________________________________________________________ 169 IJRITCC | July 2017, Available @ http://www.ijritcc.org _______________________________________________________________________________________ double image compression which Luo et al.10 (2007) used to determine cropping and forgery, but this method gave a low true positive rate. Chen and Hsu11 (2008) investigated the periodic property of blocking artifact by using different features. But this method only performed well when forged image has high quality factor as compared to original image. Pan and Lyu12 (2010) proposed region duplication detection using image key-points and feature vectors as these are robust to usual image transforms. Barni et al.13 (2010) localized tampering by statistically analysing the image both block and region wise. Bianchi and Piva14 (2012) categorized the double JPEG compression as either aligned or non-aligned and localized the tampering. Although results presented were very comprehensive but classifier achieved low Area Under Curve (AUC) for spliced images with high Quality Factor. Thing et al.15 (2012) tried to improve the accuracy of JPEG image tampering detection by considering the characteristics of the random distribution of high value bins in the DCT histograms. Then, Tralic et al.16 (2012) proposed a method to detect re-compression using Blocking Artifact Grid extraction but sufficient illustration of method on different types of images was lacking. Mall et al. 17 (2013) proposed a combined hashing index for image which was capable of detecting structural tampering, brightness level adjustment and contrast manipulations. Chang et al.18 (2013) proposed copy move detection by searching similarity blocks in the image and used similarity vector field to assure the true positives. Recently, Wattanachote et al.19 (2015) utilized BACM features to identify seam modifications in JPEG images and presented efficient results. All these researchers contributed significantly in image forensics but only few provided a comprehensive study. The aim of presented work is to design and implement a blind classifier for splice detection of JPEG images at various quality factors with higher accuracy and area under curve. Proposed classifier works for .bmp and .tiff images as well. It is robust to presence of noise in images. It detects image splicing even when pre-processing and post-processing operations have been applied and spliced area vary from small to large. The proposed design and the experimental results obtained are discussed in following sections. II. PROPOSED SYSTEM DESIGN FOR SPLICE DETECTION CLASSIFIER The system design consists of two main components i.e. training and testing of Support Vector Machine (LIBSVM20 ) to classify images as shown in Fig. 2. Image dataset consists of original and spliced images from CASIA21 database. Dataset is divided as training and testing dataset. Statistical features from these images are extracted from image Blocking Artifact Characteristic Matrix (BACM) which is the mean inter-pixel intensity difference inside and across the JPEG sub-block boundaries. This difference is similar for uncompressed images but when an image is compressed, the discontinuities appear in pixel intensity difference. The statistical features of images from training dataset are fed to SVM and a model is obtained. Then this model is used to test images for their identification as original or spliced. Fig. 2 System Design for proposed JPEG tool A. Proposed algorithm for statistical features extraction The algorithm used for extracting image statistical features and its complexity is as follows: Step1: Consider an image I. transform the image I to grayscale such that Ig=rgb_to_gray (I). Step2: Subdivide the image into sub-blocks of 8 x 8 pixels. For each sub-block, for every pixel location 𝑥, 𝑦 , where,1 ≤ 𝑥, 𝑦 ≤ 8 Calculate difference in neighbour pixel intensities 𝐷(𝑥, 𝑦) as: 𝐷(𝑥, 𝑦) = |[𝑃(𝑥, 𝑦) + 𝑃(𝑥 + 1, 𝑦 + 1)] − [𝑃(𝑥 + 1, 𝑦) + 𝑃(𝑥, 𝑦 + 1)] (1) Where,𝑃(𝑥, 𝑦) represent intensity of pixel at location 𝑥, 𝑦. Calculate 𝐷(𝑥 + 4, 𝑦 + 4). Calculate absolute difference 𝐷’(𝑥, 𝑦) = | 𝐷 𝑥 + 4, 𝑦 + 4− 𝐷(𝑥,𝑦)|. (2) Step 3. Calculate energy 𝐾(𝑥, 𝑦) at each pixel location 𝑥 , 𝑦 from each sub-block 𝑖 as 𝐾(𝑥, 𝑦) = 𝐷𝑖′(𝑥, 𝑦) 𝑛 𝑖=1 (3) Where,𝑛 is total number of image sub-blocks. Step 4. Calculate BACM matrix 𝐵(𝑥, 𝑦) as 𝐵(𝑥, 𝑦) = 𝐾(𝑥, 𝑦)/𝑛. (4) Step 5. Extract features F1-F20 from BACM and input them to SVM to obtain the classifier model. The algorithm works on 2x2 pixel neighbouring in each sub- block. Every pixel is considered neighbour to 4 pixels as shown in Fig 3. Algorithm needs to access each block once and each pixel of the image 4 times to calculate pixel intensity difference. So, the number of access for each pixel is 4 and the complexity is equivalent to O (4n) ≈ O (n). It is linearly dependent on the size of the image. The algorithm’s main steps i.e. extracting BACM and defining feature set are further clarified with example in the following two sections. B. Extracting BACM Blocking Artifact Characteristics Matrix (BACM) is a matrix extracted form DCT blocks of the image. It reveals important features about the image compression history. To extract BACM, grey scale image is subdivided into sub- blocks of 8x8pixels. For each sub-block and every pixel](https://image.slidesharecdn.com/34150001378214-07-2017-171227110903/75/Statistical-Feature-based-Blind-Classifier-for-JPEG-Image-Splice-Detection-2-2048.jpg)

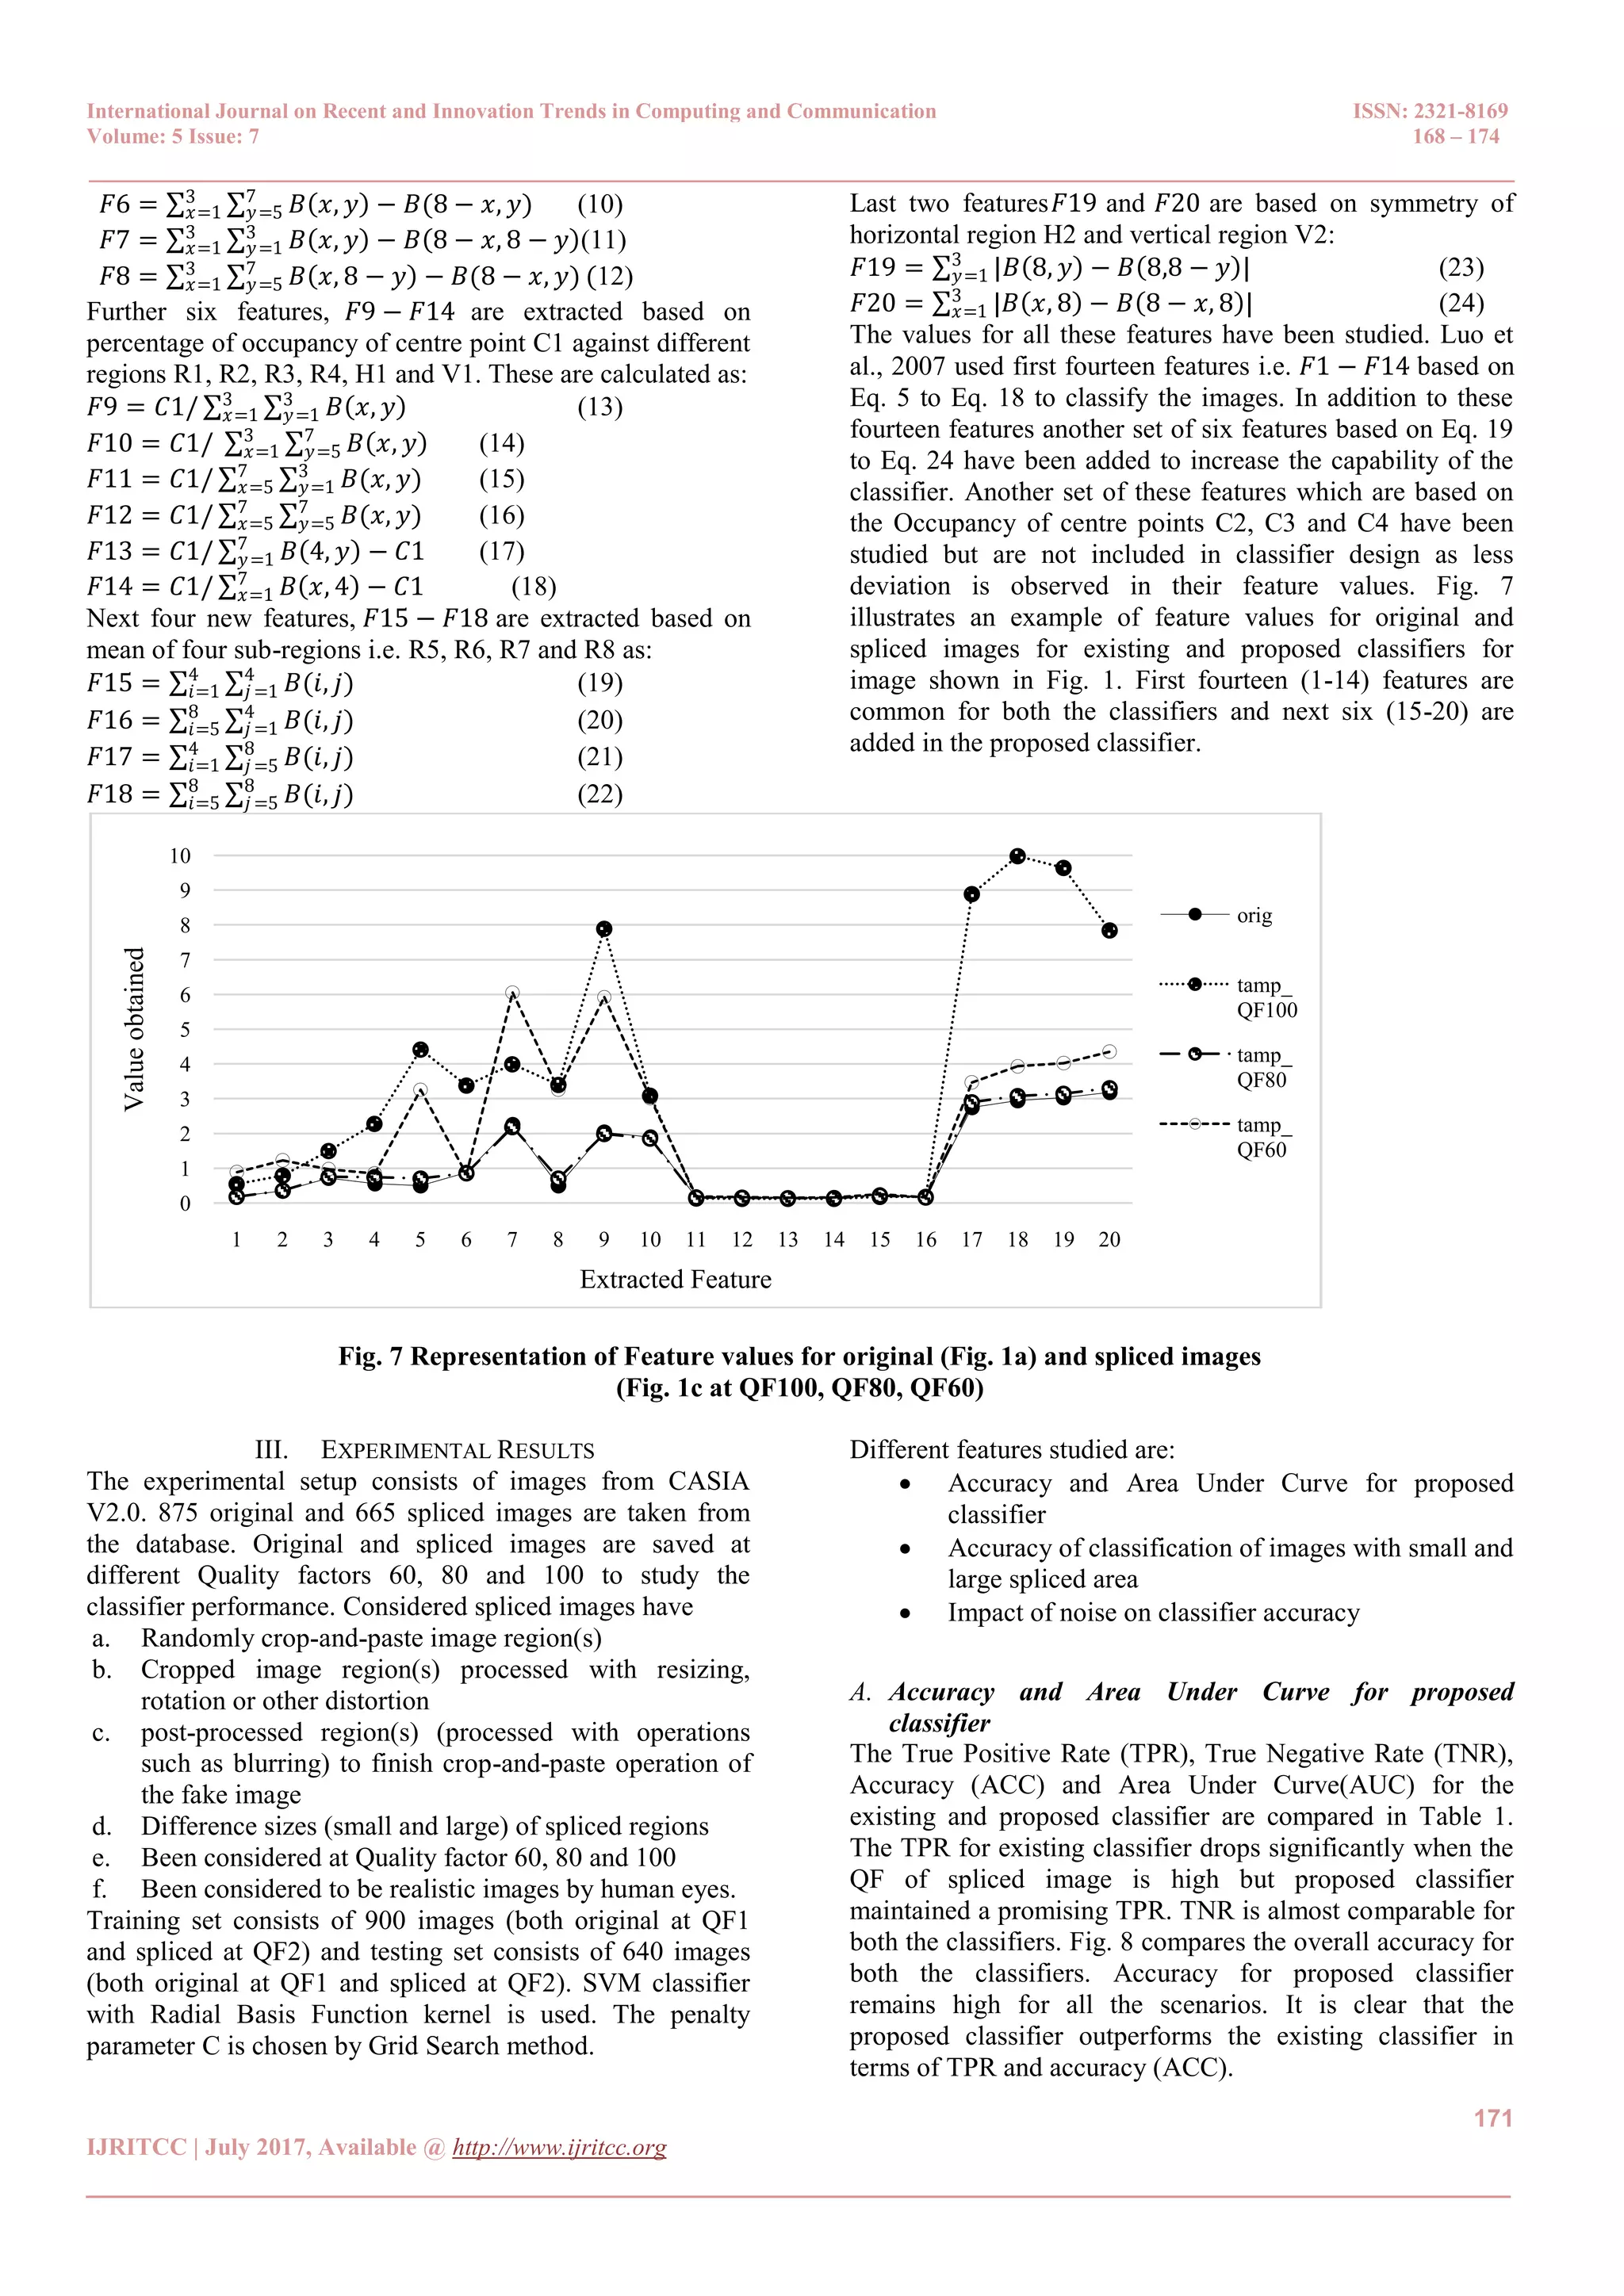
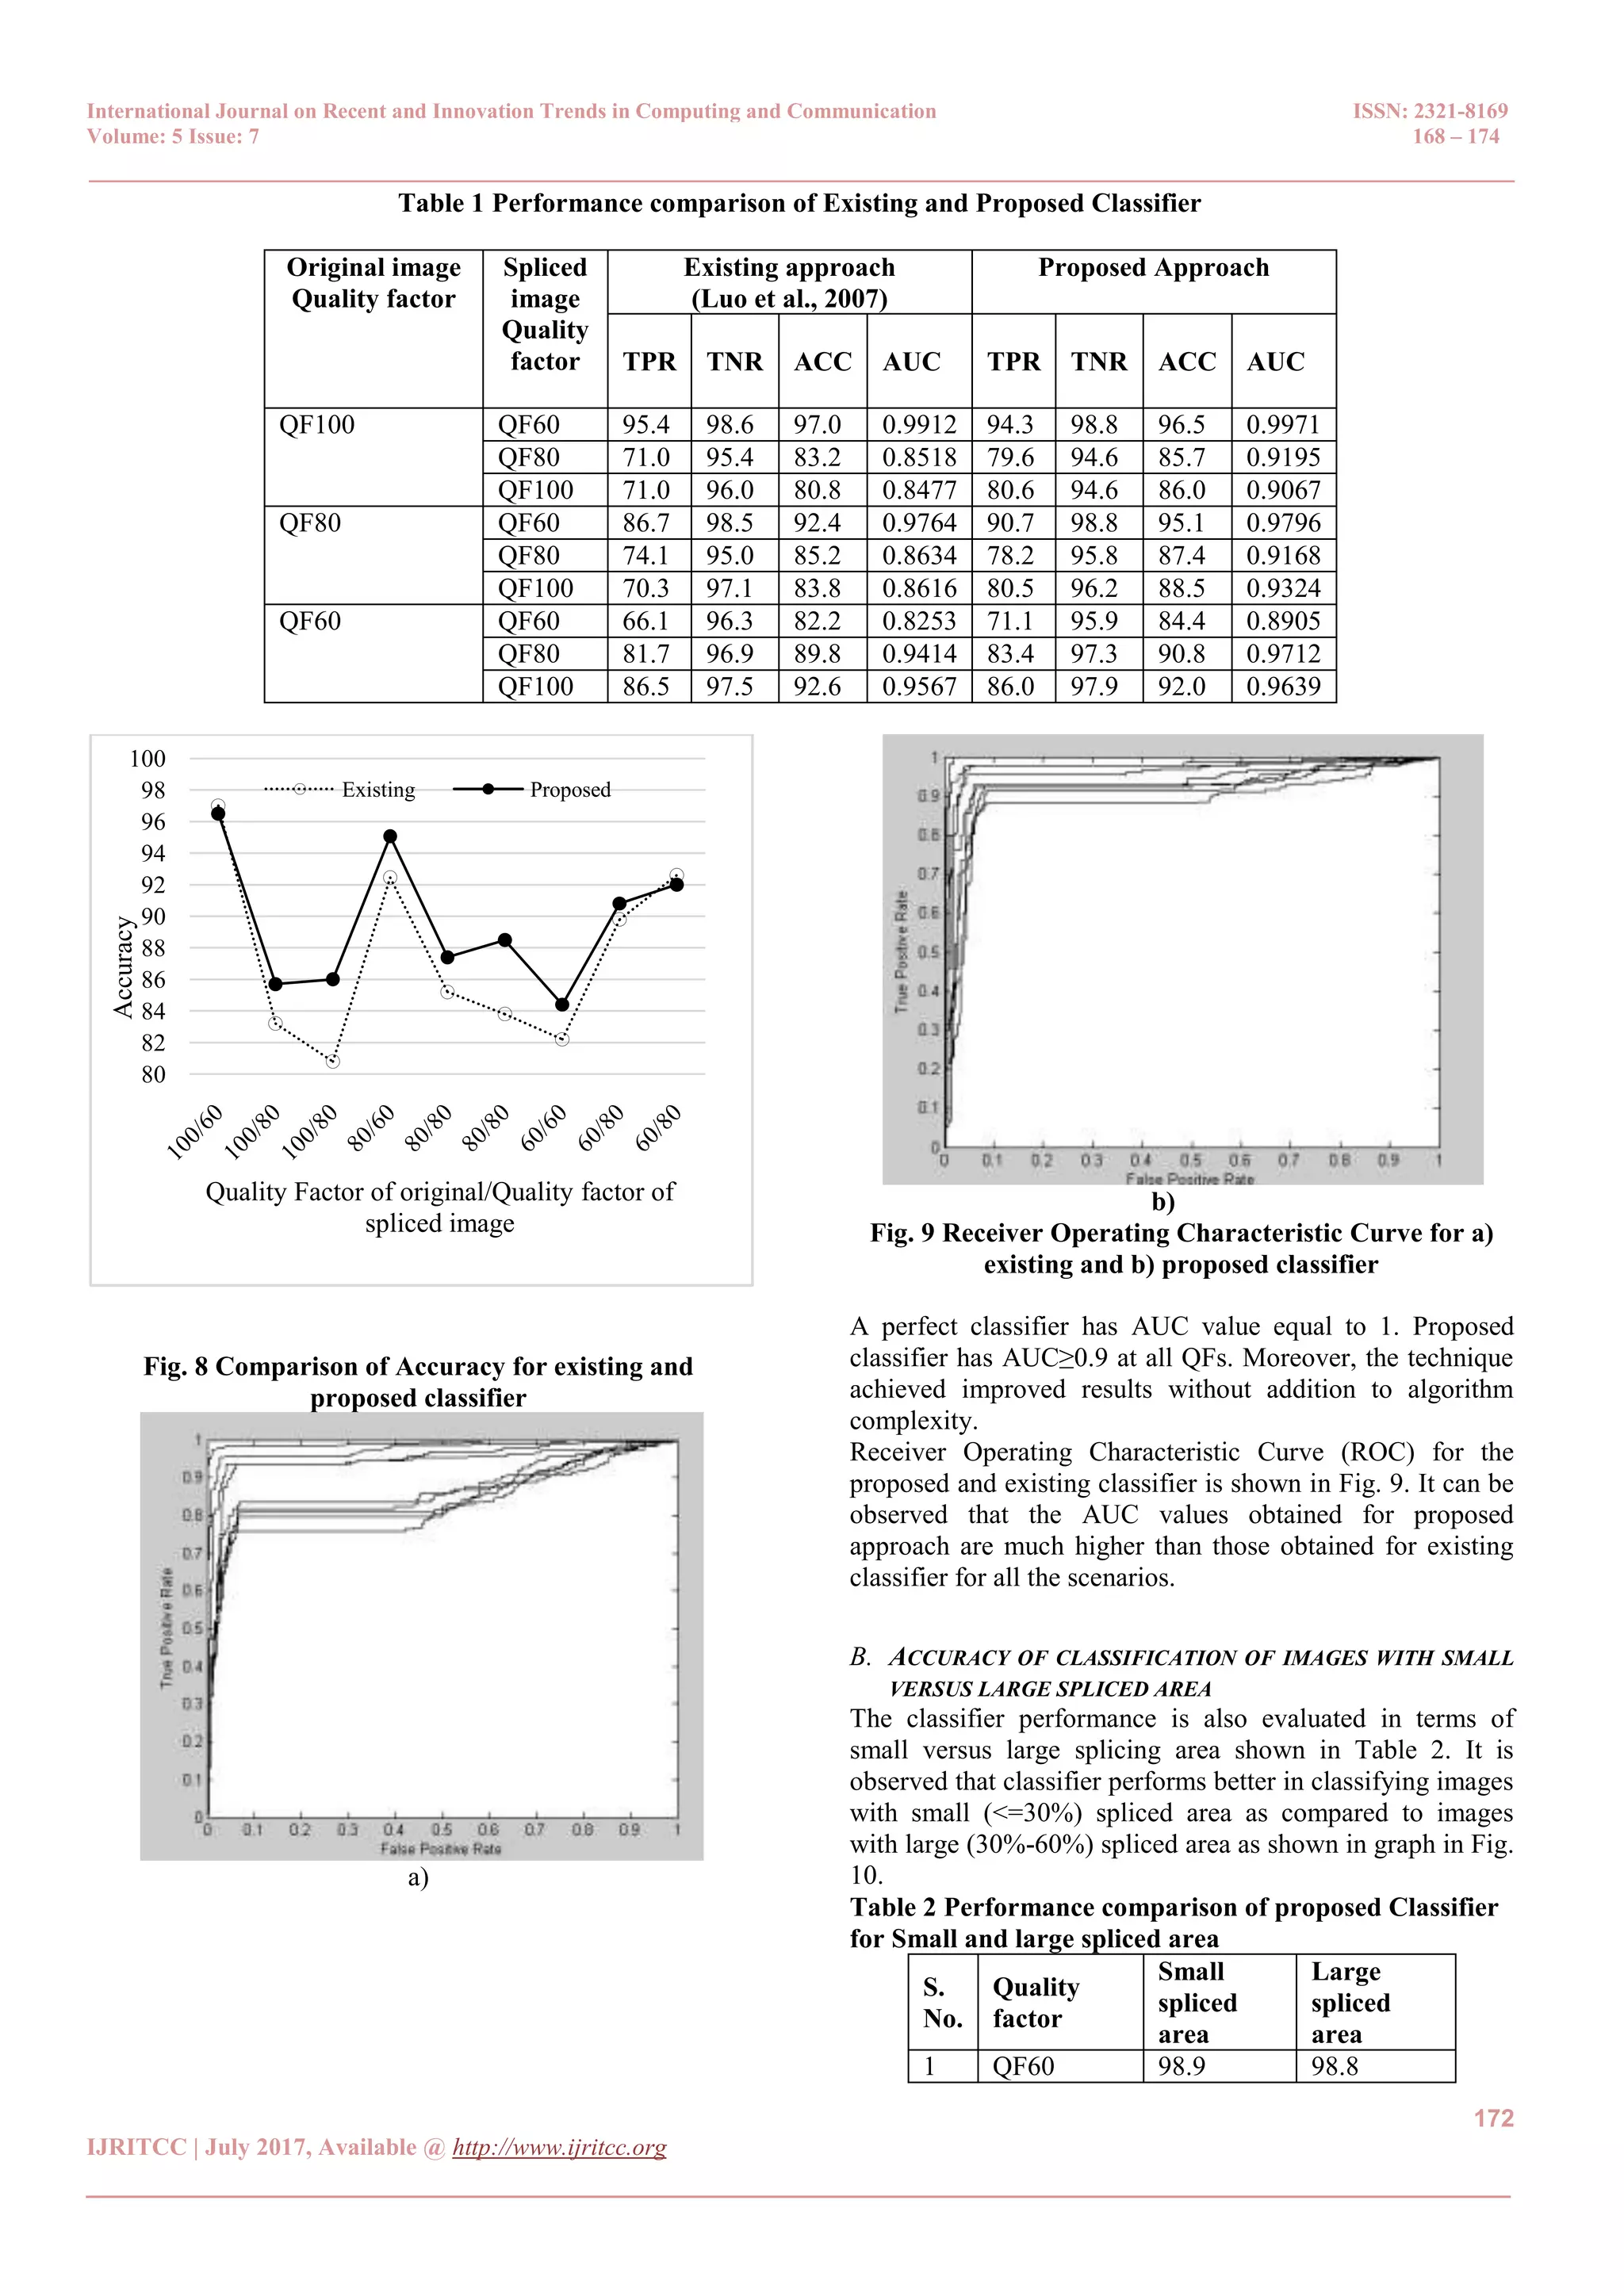
![International Journal on Recent and Innovation Trends in Computing and Communication ISSN: 2321-8169 Volume: 5 Issue: 7 168 – 174 _______________________________________________________________________________________________ 173 IJRITCC | July 2017, Available @ http://www.ijritcc.org _______________________________________________________________________________________ 3 QF80 95.6 93.6 4 QF100 96.7 92.6 Fig. 10 Classifier accuracy for images with small and large spliced area C. IMPACT OF NOISE ON CLASSIFIER ACCURACY As images are very much prone to noise, it is obvious that the classifier results will vary in presence of noise. In this paper four different types of noise are considered i.e. fast fading, gaussian blur, white noise and JPEG. 320 images with different types of noise from LIVE222 database have been taken. These authentic images are checked for their true classification using the proposed classifier. The classifier classifies the images having Gaussian blur and white noise accurately. The accuracy obtained is 100%.For Fast fading and JPEG noise, the accuracy decreases to 85.7% and 84.8% respectively. For more comprehensive study, a number of original and spliced images with noise may be tested. But it needs another experimental setup and creation of new dataset by adding each type of noise to various types of spliced images which is out of the scope of this paper. IV. DISCUSSION AND CONCLUSION In this paper, machine learning based blind JPEG classifier for detecting spliced images has been proposed and implemented. The statistical differentiating features based on image i.e. Blocking Artifact Characteristics Matrix (BACM) have been extracted. Original images and spliced images at various quality factors i.e. QF60, QF80, QF100 have been considered to train and test LIBSVM based classifier. The main advantage of proposed classifier is that it performs well irrespective of the quality factor at which image is saved. It can be used to detect spliced images undergone through any kind of pre-processing operation as cropping, resampling, rotation etc. as well as any post- processing operation such as blurring. Moreover, the spliced area may be large or small. Additionally, it supports .bmp and .tiff images. The receiver operating characteristic curve and area under the curve demonstrated that proposed classifier performs better as compared to existing one. The only limitation is that classifier accuracy drops when both the original and spliced images are saved at poor QF60.The proposed classifier may be extended to make an integrated forensic tool which can detect splicing, copy move, seam carving, steganography and other types of tampering in images. References: [1] J. Lukas and J. Fridrich: ‘Estimation of primary quantization matrix in double compressed jpeg images’, Proc. of DFRWS, Cleveland, USA, August 2003, pp. 5-8. [2] J. Lukas, J. Fridrich, and M. Goljan: ‘Detecting digital image forgeries using sensor pattern noise’, Proc. of SPIE, 2006, pp. 0Y1–0Y11. [3] T.T. Ng and S.F. Chang: ‘Blind detection of digital photomontage using higher order statistics’, IEEE International Symposium on Circuits and Systems (ISCAS 2004), Vancouver, Canada, Vol. 5, pp. 688–691. [4] A.C. Popescu and H. Farid: ‘Statistical tools for digital forensics’, International Workshop on Information Hiding, Springer Berlin Heidelberg, 2004, pp. 128-147. [5] A.C. Popescu and H. Farid: ‘Exposing digital forgeries by detecting traces of re-sampling’, IEEE Trans. on Signal Processing, 2005a, Vol. 53, no. 2, pp. 758–767. [6] A.C. Popescu and H. Farid: ‘Exposing digital forgeries in color filter array interpolated images’, IEEE Trans. on Signal Processing, 2005b, Vol. 53, no. 10, pp. 3948–3959. [7] F. Pan, X. Lin, S. Rahardja, E. P. Ong and W. S. Lin : ‘Measuring blocking artifacts using edge direction information’, In Multimedia and Expo, ICME 2004, IEEE International Conference on, Vol. 2, pp. 1491-1494. [8] C. Perra, F. Massidda and D. D. Giusto: ‘Image blockiness evaluation based on sobel operator’, IEEE International Conference on Image Processing, 2005, Vol.1 (part-1), pp. 389–392. [9] Z. Fan and R. L. De Queiroz: ‘Identification of bitmap compression history: JPEG detection and quantizer estimation’, IEEE Transactions on Image Processing, 2003, Vol. 12, no. 2, pp. 230–235. [10] W.Q. Luo, Z.H. Qu, J.W. Huang and G.P. Qiu: ‘A novel method for detecting cropped and recompressed image block’, in IEEE Int. Conf. on Acoustics, Speech and Signal Processing, 2007, pp. II-217–II-220. [11] Y. L. Chen and C. T. Hsu: ‘Image tampering detection by blocking periodicity analysis in JPEG compressed images’, in Proc. of IEEE 10th Workshop on Multimedia Signal Processing, Oct. 2008, pp. 803–808. [12] X. Pan and S. Lyu: ‘Region duplication detection using image feature matching’,IEEE Transactions on Information Forensics and Security,Vol. 5, no. 4, 2010, pp. 857–867. [13] M. Barni, A. Costanzo and L. Sabatini: ‘Identification of cut & paste tampering by means of double-JPEG detection and image segmentation’, in Proc. of ISCAS, 2010, pp. 1687– 1690. [14] T. Bianchi and A. Piva: ‘Image forgery localization via block- grained analysis of JPEG artifacts’, in IEEE Trans. Information Forensics and Security, Vol. 7, no. 3, 2012, pp. 1003–1017. [15] V. L. L. Thing, Y. Chen and C. Cheh: ‘An Improved Double Compression Detection Method for JPEG Image Forensics’, IEEE Int. Symp. Multimedia, Dec. 2012, pp. 290–297. 92 93 94 95 96 97 98 99 100 QF60 QF80 QF100 Detectionaccuracy Quality factor of spliced image Small spliced area Large spliced area](https://image.slidesharecdn.com/34150001378214-07-2017-171227110903/75/Statistical-Feature-based-Blind-Classifier-for-JPEG-Image-Splice-Detection-6-2048.jpg)
![International Journal on Recent and Innovation Trends in Computing and Communication ISSN: 2321-8169 Volume: 5 Issue: 7 168 – 174 _______________________________________________________________________________________________ 174 IJRITCC | July 2017, Available @ http://www.ijritcc.org _______________________________________________________________________________________ [16] D. Tralic, J. Petrovic and S. Grgic: ‘JPEG image tampering detection using blocking artifacts’, 19th International Conference on Systems, Signals and Image Processing (IWSSIP), IEEE, 2012, pp. 5-8. [17] Mall, S. Shukla, S.K. Mitra and A.K. Roy: ‘Comprehensive image index and detection of tampering in a digital image’, in Int. Conf. Informatics, Electronics & Vision (ICIEV), 2013, pp. 1–7. [18] I.C. Chang, J.W. Yu, and C.C. Chang: ‘A forgery detection algorithm for exemplar-based inpainting images using multi- region relation’, Image and Vision Computing,2013, Vol. 31, no. 1, pp. 57–71. [19] K. Wattanachote, T. K. Shih, W. L. Chang and H. H. Chang: ‘Tamper Detection of JPEG Image Due to Seam Modifications’, IEEE Transactions on Information Forensics and Security, 2015, Vol. 10, no. 12, pp. 2477-2491. [20] C.W. Hsu, C.C. Chang, and C.J. Lin: ‘A practical guide to support vector classification’, 2003, pp.1-16, http://www.csie.ntu.edu.tw/~cjlin/libsvm/. [21] J. Dong and W. Wang: ‘CASIA tampered image detection evaluation database’, 2011, http://forensics.idealtest.org. [22] H.R. Sheikh, Z. Wang, L. Cormack and A.C. Bovik, ‘LIVE Image Quality Assessment Database Release 2’, 2005, http://live.ece.utexas.edu/research/quality.](https://image.slidesharecdn.com/34150001378214-07-2017-171227110903/75/Statistical-Feature-based-Blind-Classifier-for-JPEG-Image-Splice-Detection-7-2048.jpg)