Downloaded 1,563 times


![1 1 1 4 3 2 4 4 3 3 3 4 4 4 4 4 1 1 1 3 3 2 2 3 3 3 4 4 3 3 4 4 Grid 1 Grid 2 ([Grid1] = 3) AND ([Grid2] = 3) = An illustration of a raster-based binary model. A query statement, ([Grid1] = 3) AND ([Grid2] = 3), results in the selection of 3 cells in the output. Spatial Analysis and Modelling by Tadele Feyssa, 118 Wollega University](https://image.slidesharecdn.com/spatialanalysisandmodeling-141209020403-conversion-gate01/75/Spatial-analysis-and-modeling-118-2048.jpg)


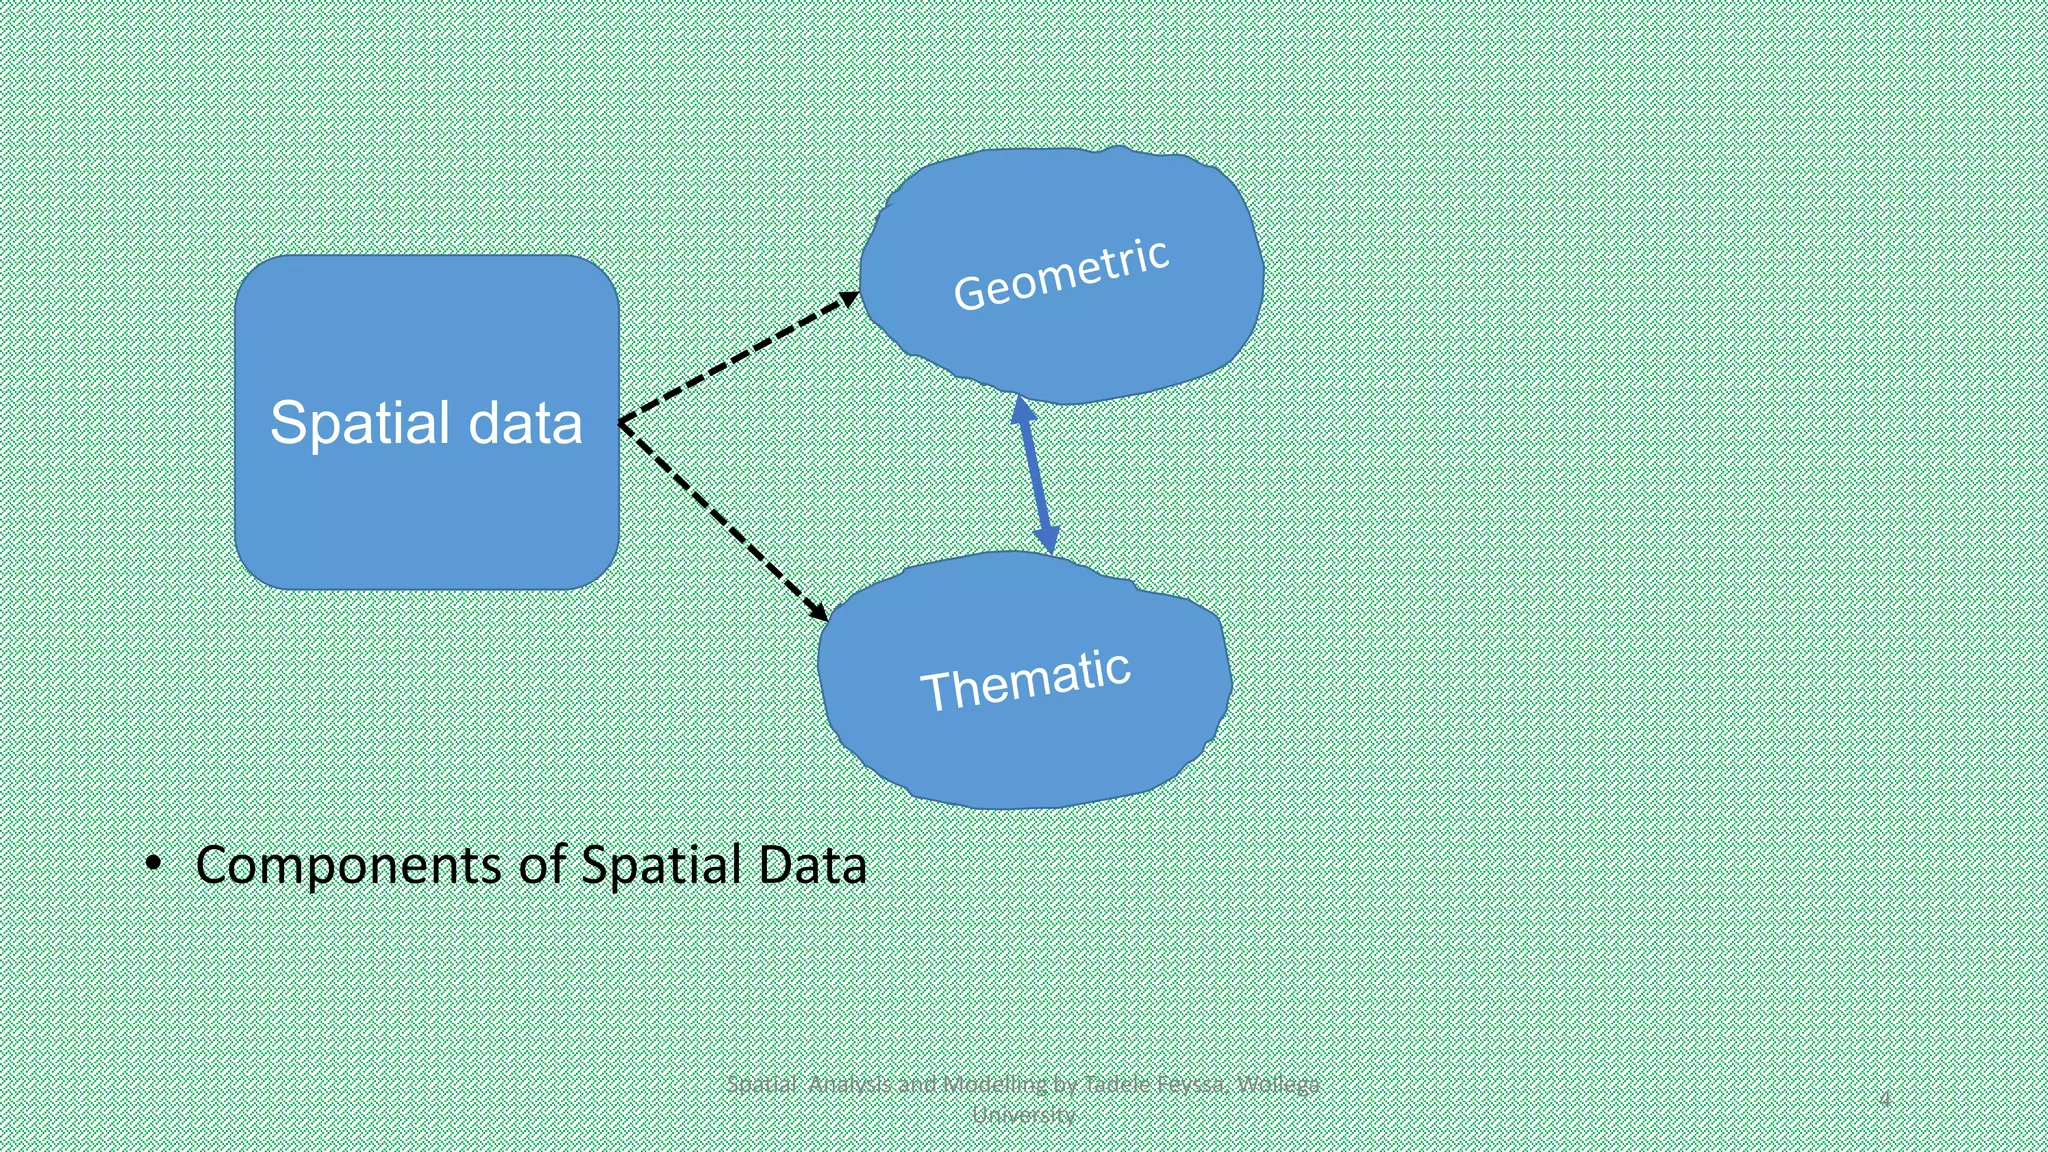
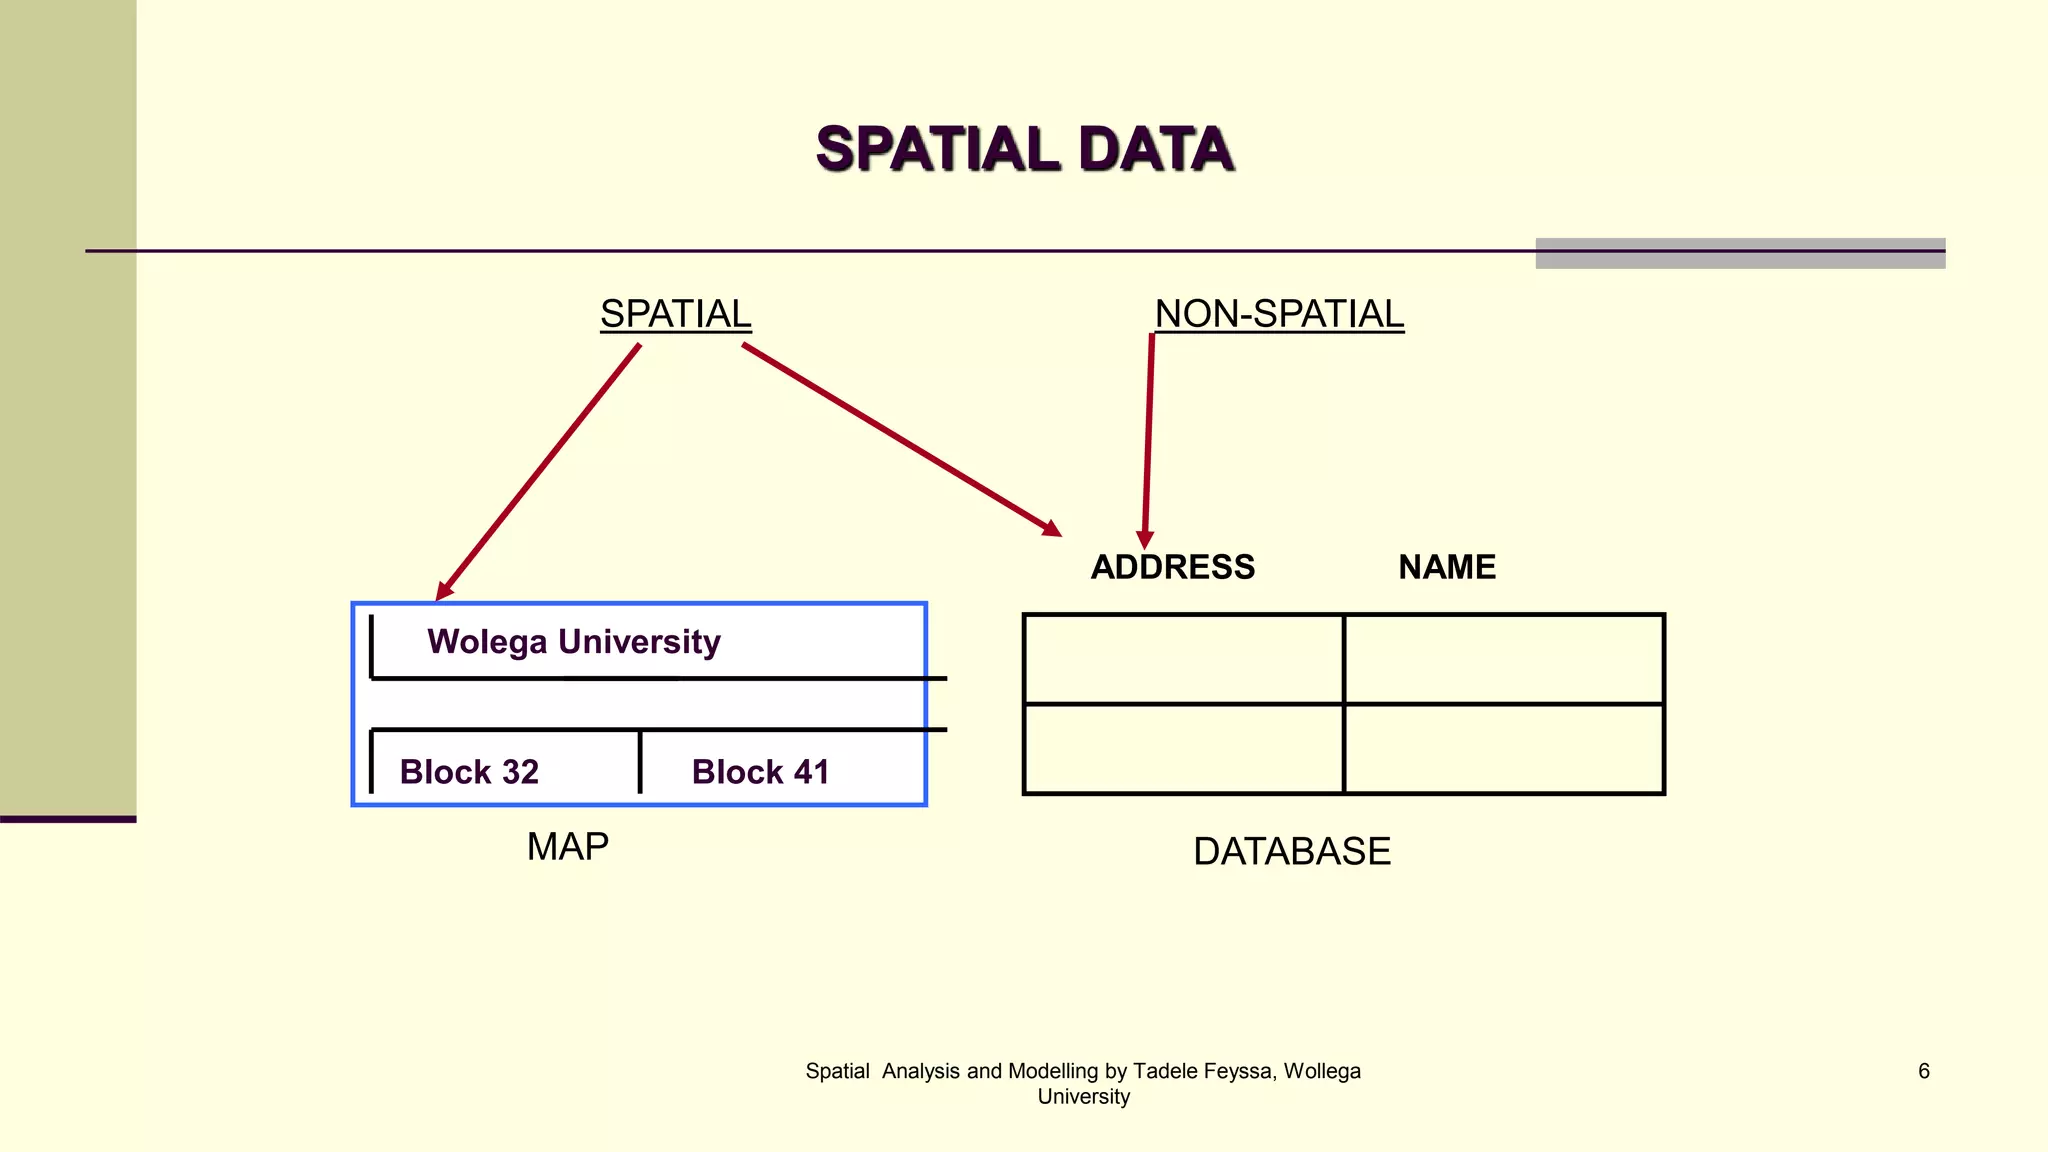
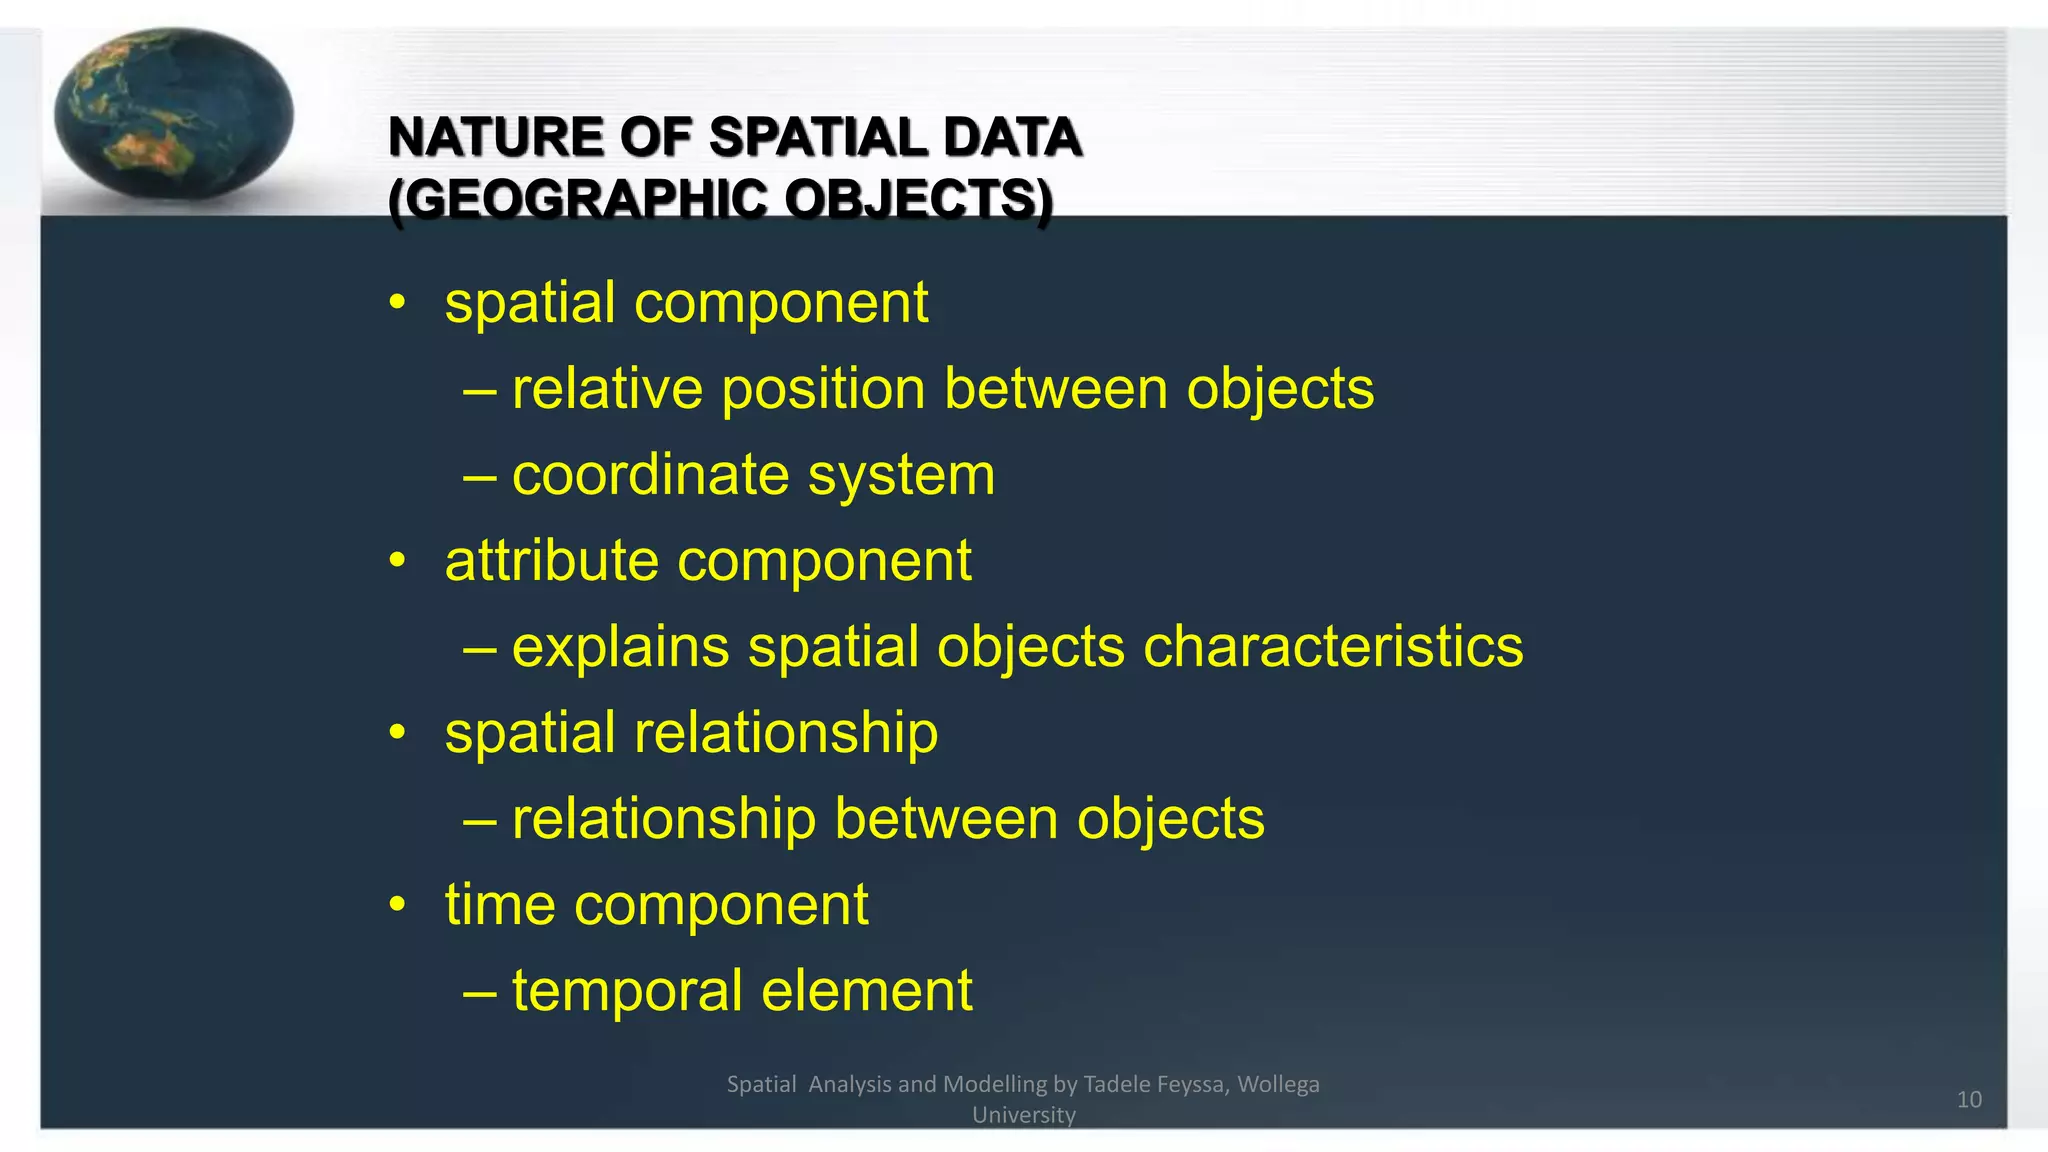
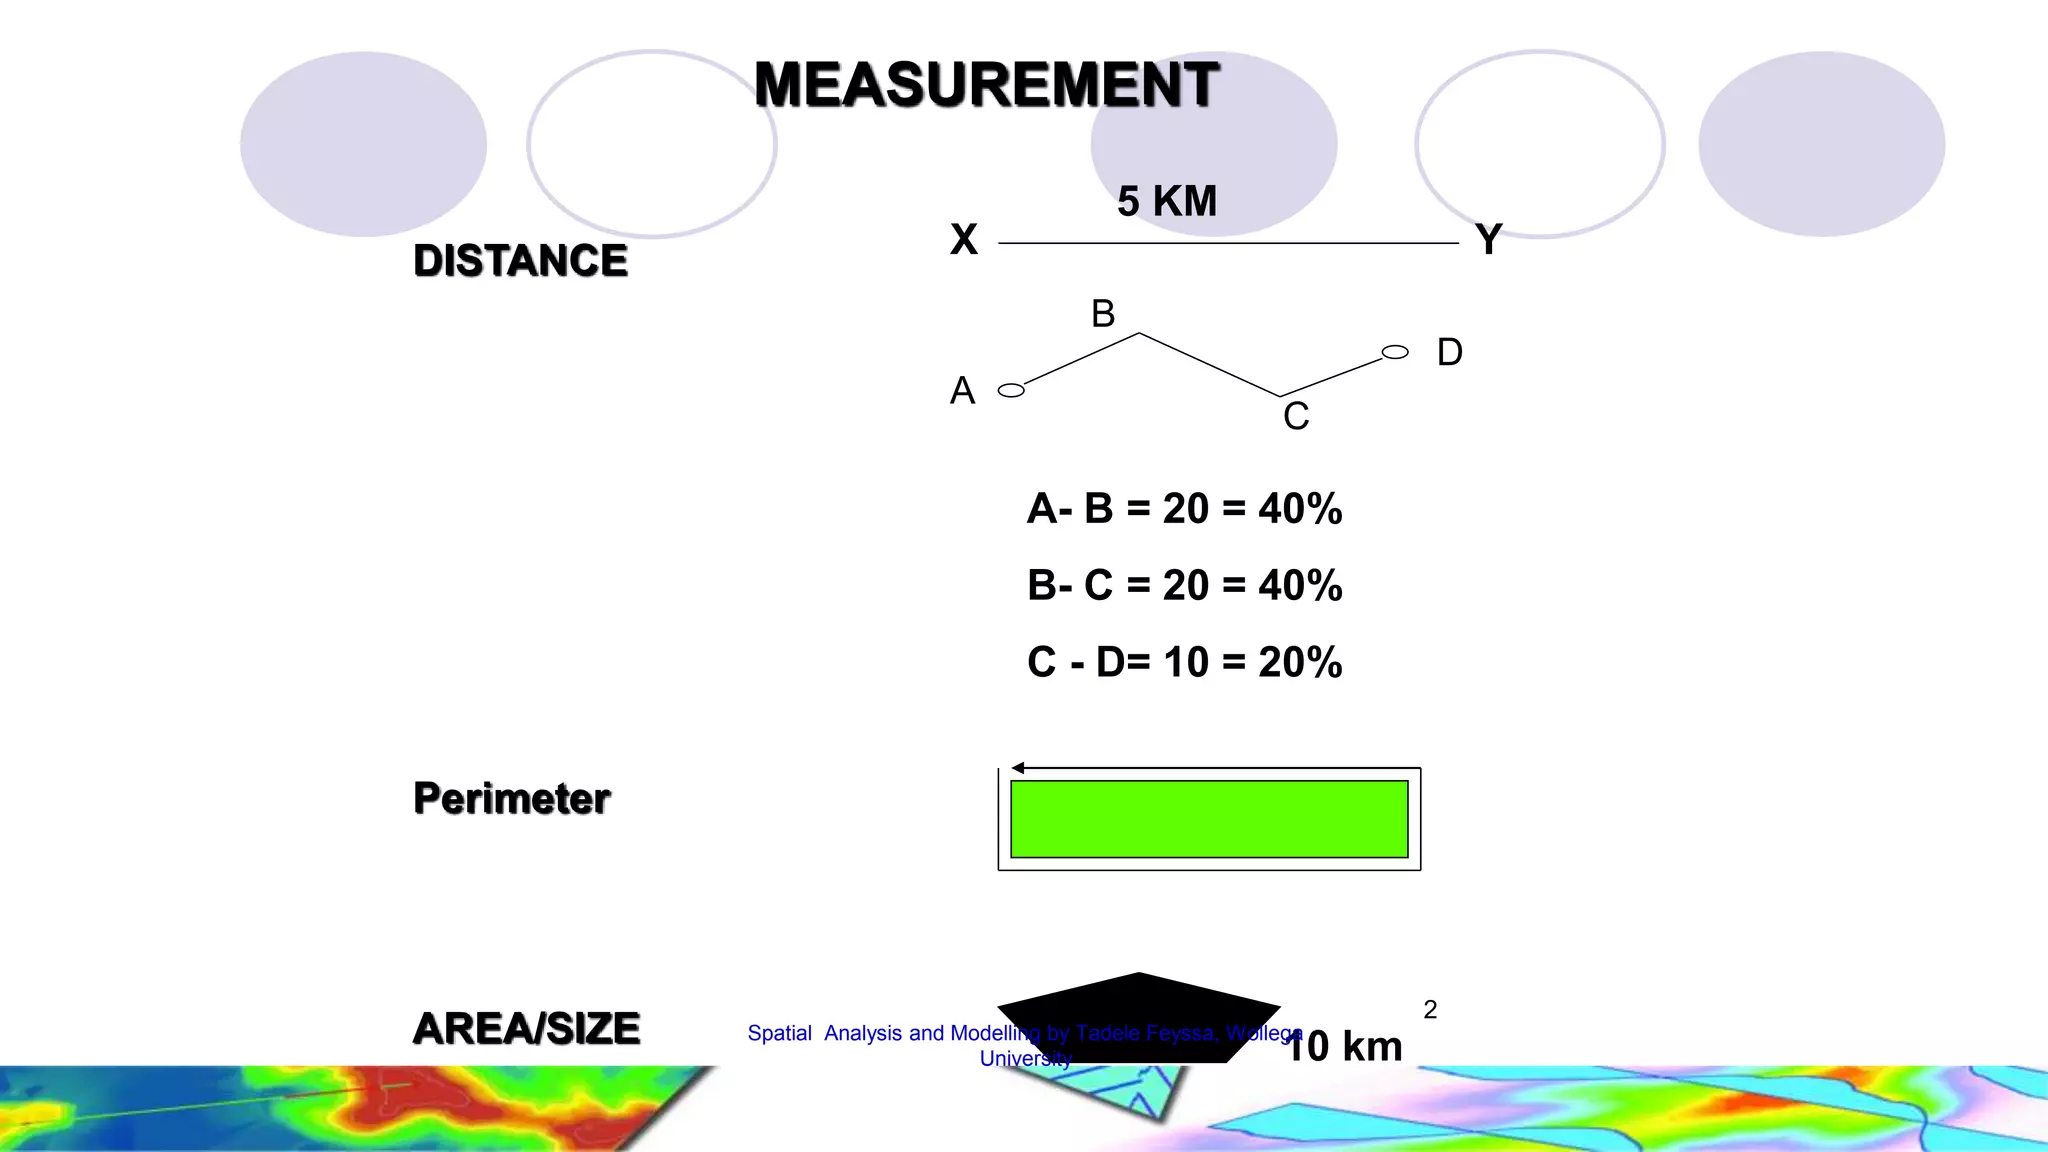
The document discusses spatial data and spatial analysis. It defines spatial data as data connected to locations on Earth, with three main components - geometric data describing location, thematic data providing attribute values, and identifiers linking the geometric and thematic components. Spatial analysis in GIS involves functions like measurements, queries, classifications and modeling to analyze spatial relationships in the data and address real-world problems. Common analysis functions in GIS include measurements, queries, extractions, proximity analysis, and network analysis.