Download to read offline

![International Research Journal of Engineering and Technology (IRJET) e-ISSN: 2395-0056 Volume: 09 Issue: 11 | Nov 2022 www.irjet.net p-ISSN: 2395-0072 © 2022, IRJET | Impact Factor value: 7.529 | ISO 9001:2008 Certified Journal | Page 927 X. Conclusion: e-Learning is the latest solution for delivering education and knowledge. A variety of tools have been developed to implement this method of learning and to get people to recognize and accept its importance. Both synchronous and asynchronous learning methods are equally important. 's e-learning tools meet the needs of 's novices and experts alike, and its consistency also proves his 's effectiveness in traditional methods. The web application helped visualize how the pathfinding algorithm works and made it easy to understand. Further development of this tool may involve visualization of more complex algorithms and their implementation on real maps. XI. ACKNOWLEDGEMENT: How ever we put a lot of time and effort into this task.And many individuals have helped and assisted us in completing this task. We would like to express our sincere gratitude to everyone and thank Prof. Prachi Nilekar for her role as our guide and for always being there by keeping an eye on us and providing her necessary input and information on the project. We would also like to thank HOD Prof. Priyadarshini Doke from the Computer Engineering Department for her moral support and motivation in helping us to make this project a reality.And Thankful to Principal Dr. Sanjay Talbar who gave us his constant support and motivation which was very helpful in bringing our project to life. We would like to take this opportunity to thank our teachers, friends and everyone who contributed to the completion of our project. XII. REFERENCES [1] Alexander, S. (2001), ``e-Learning developments and experiences'', Education and Training, Vol. 43 Nos 4/5, pp. 240-8 [2] Daniela Borissov, Ivan Mustakerov “E-learning Tool for Visualization of Shortest Paths Algorithms” [3] Magzhan Kairanbay, Hajar Mat Jani(2013), “A review and evaluations of Shortest Path Algorithms ”, International Journal of Scientific & Technology Research 2(6):99-104 [4]https://www.researchgate.net/publication/3528482 85_AlgoAssist_Algorithm_Visualizer_and_Coding_ Platform_for_Remote_Classroom_Learning [5]https://www.researchgate.net/publication/2214237 15_AlCoLab_Architecture_of_Algorithm_Visualizat ion_System [6]https://www.researchgate.net/publication/3294811 79_Towards_Developing_an_Effective_Algorithm_ Visualization_Tool_for_Online_Learning](https://image.slidesharecdn.com/irjet-v9i11185-221208103444-78cda3cf/75/SHORTEST-PATH-FINDING-VISUALIZER-4-2048.jpg)

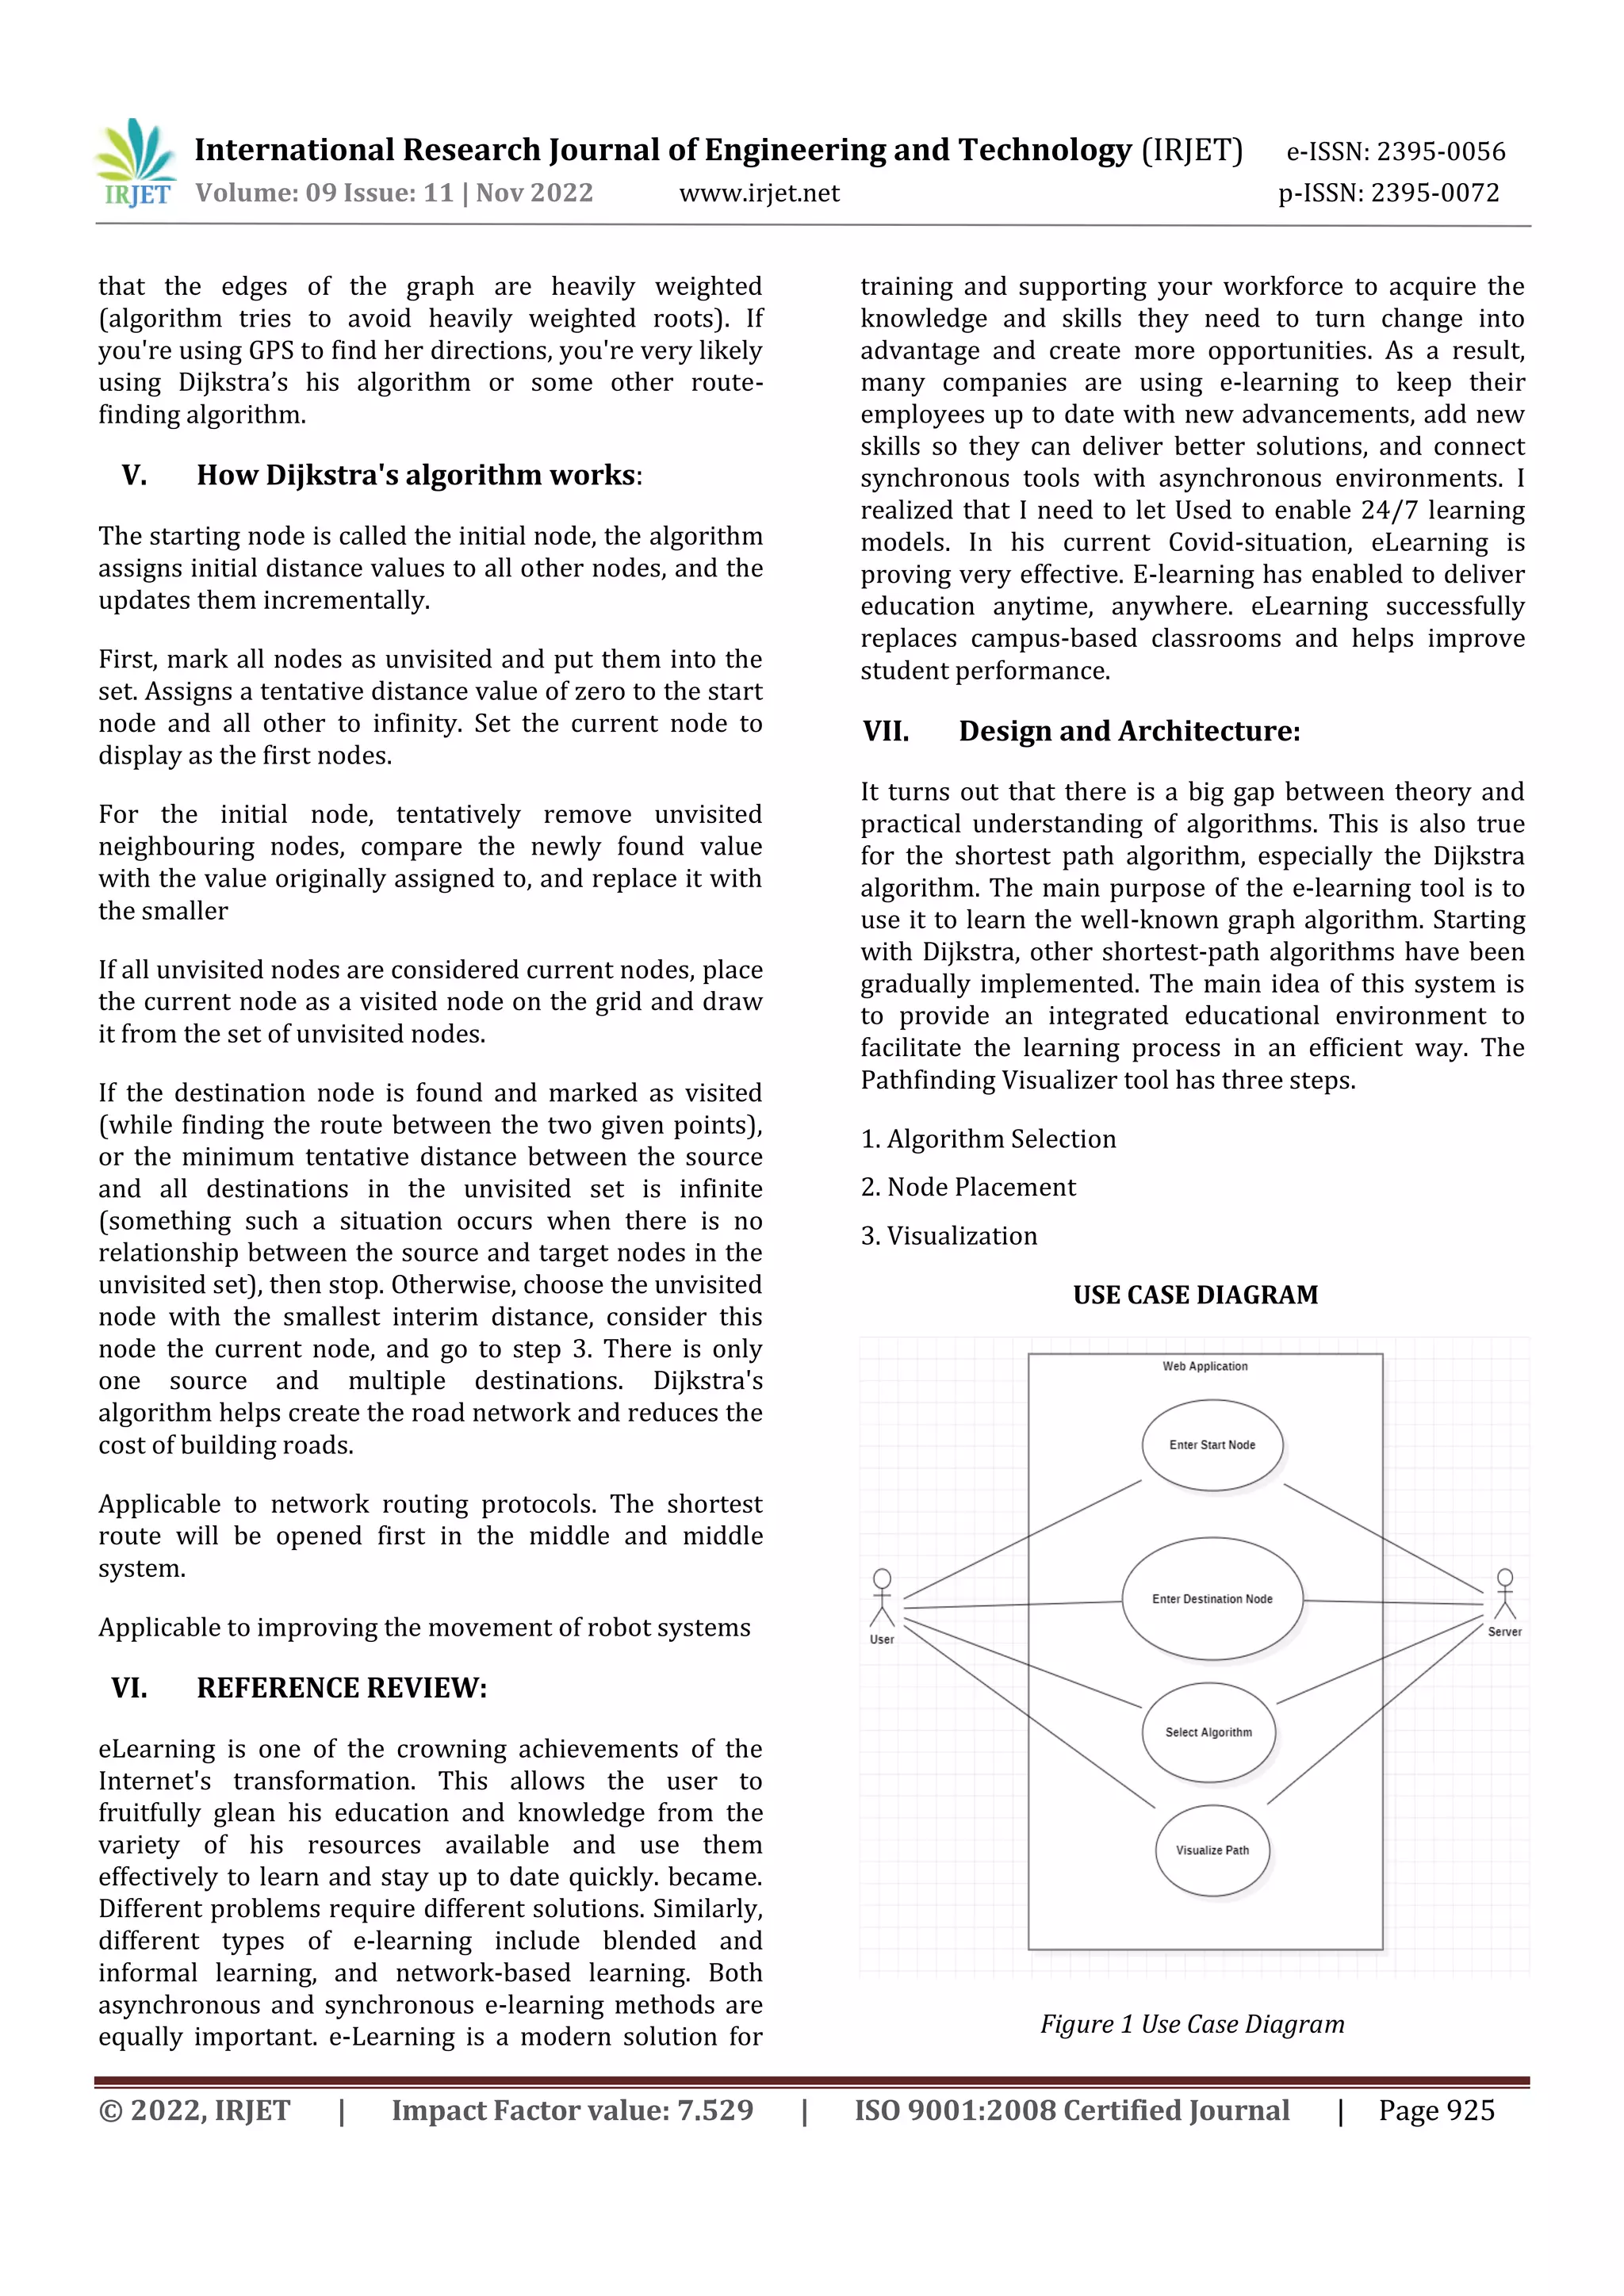
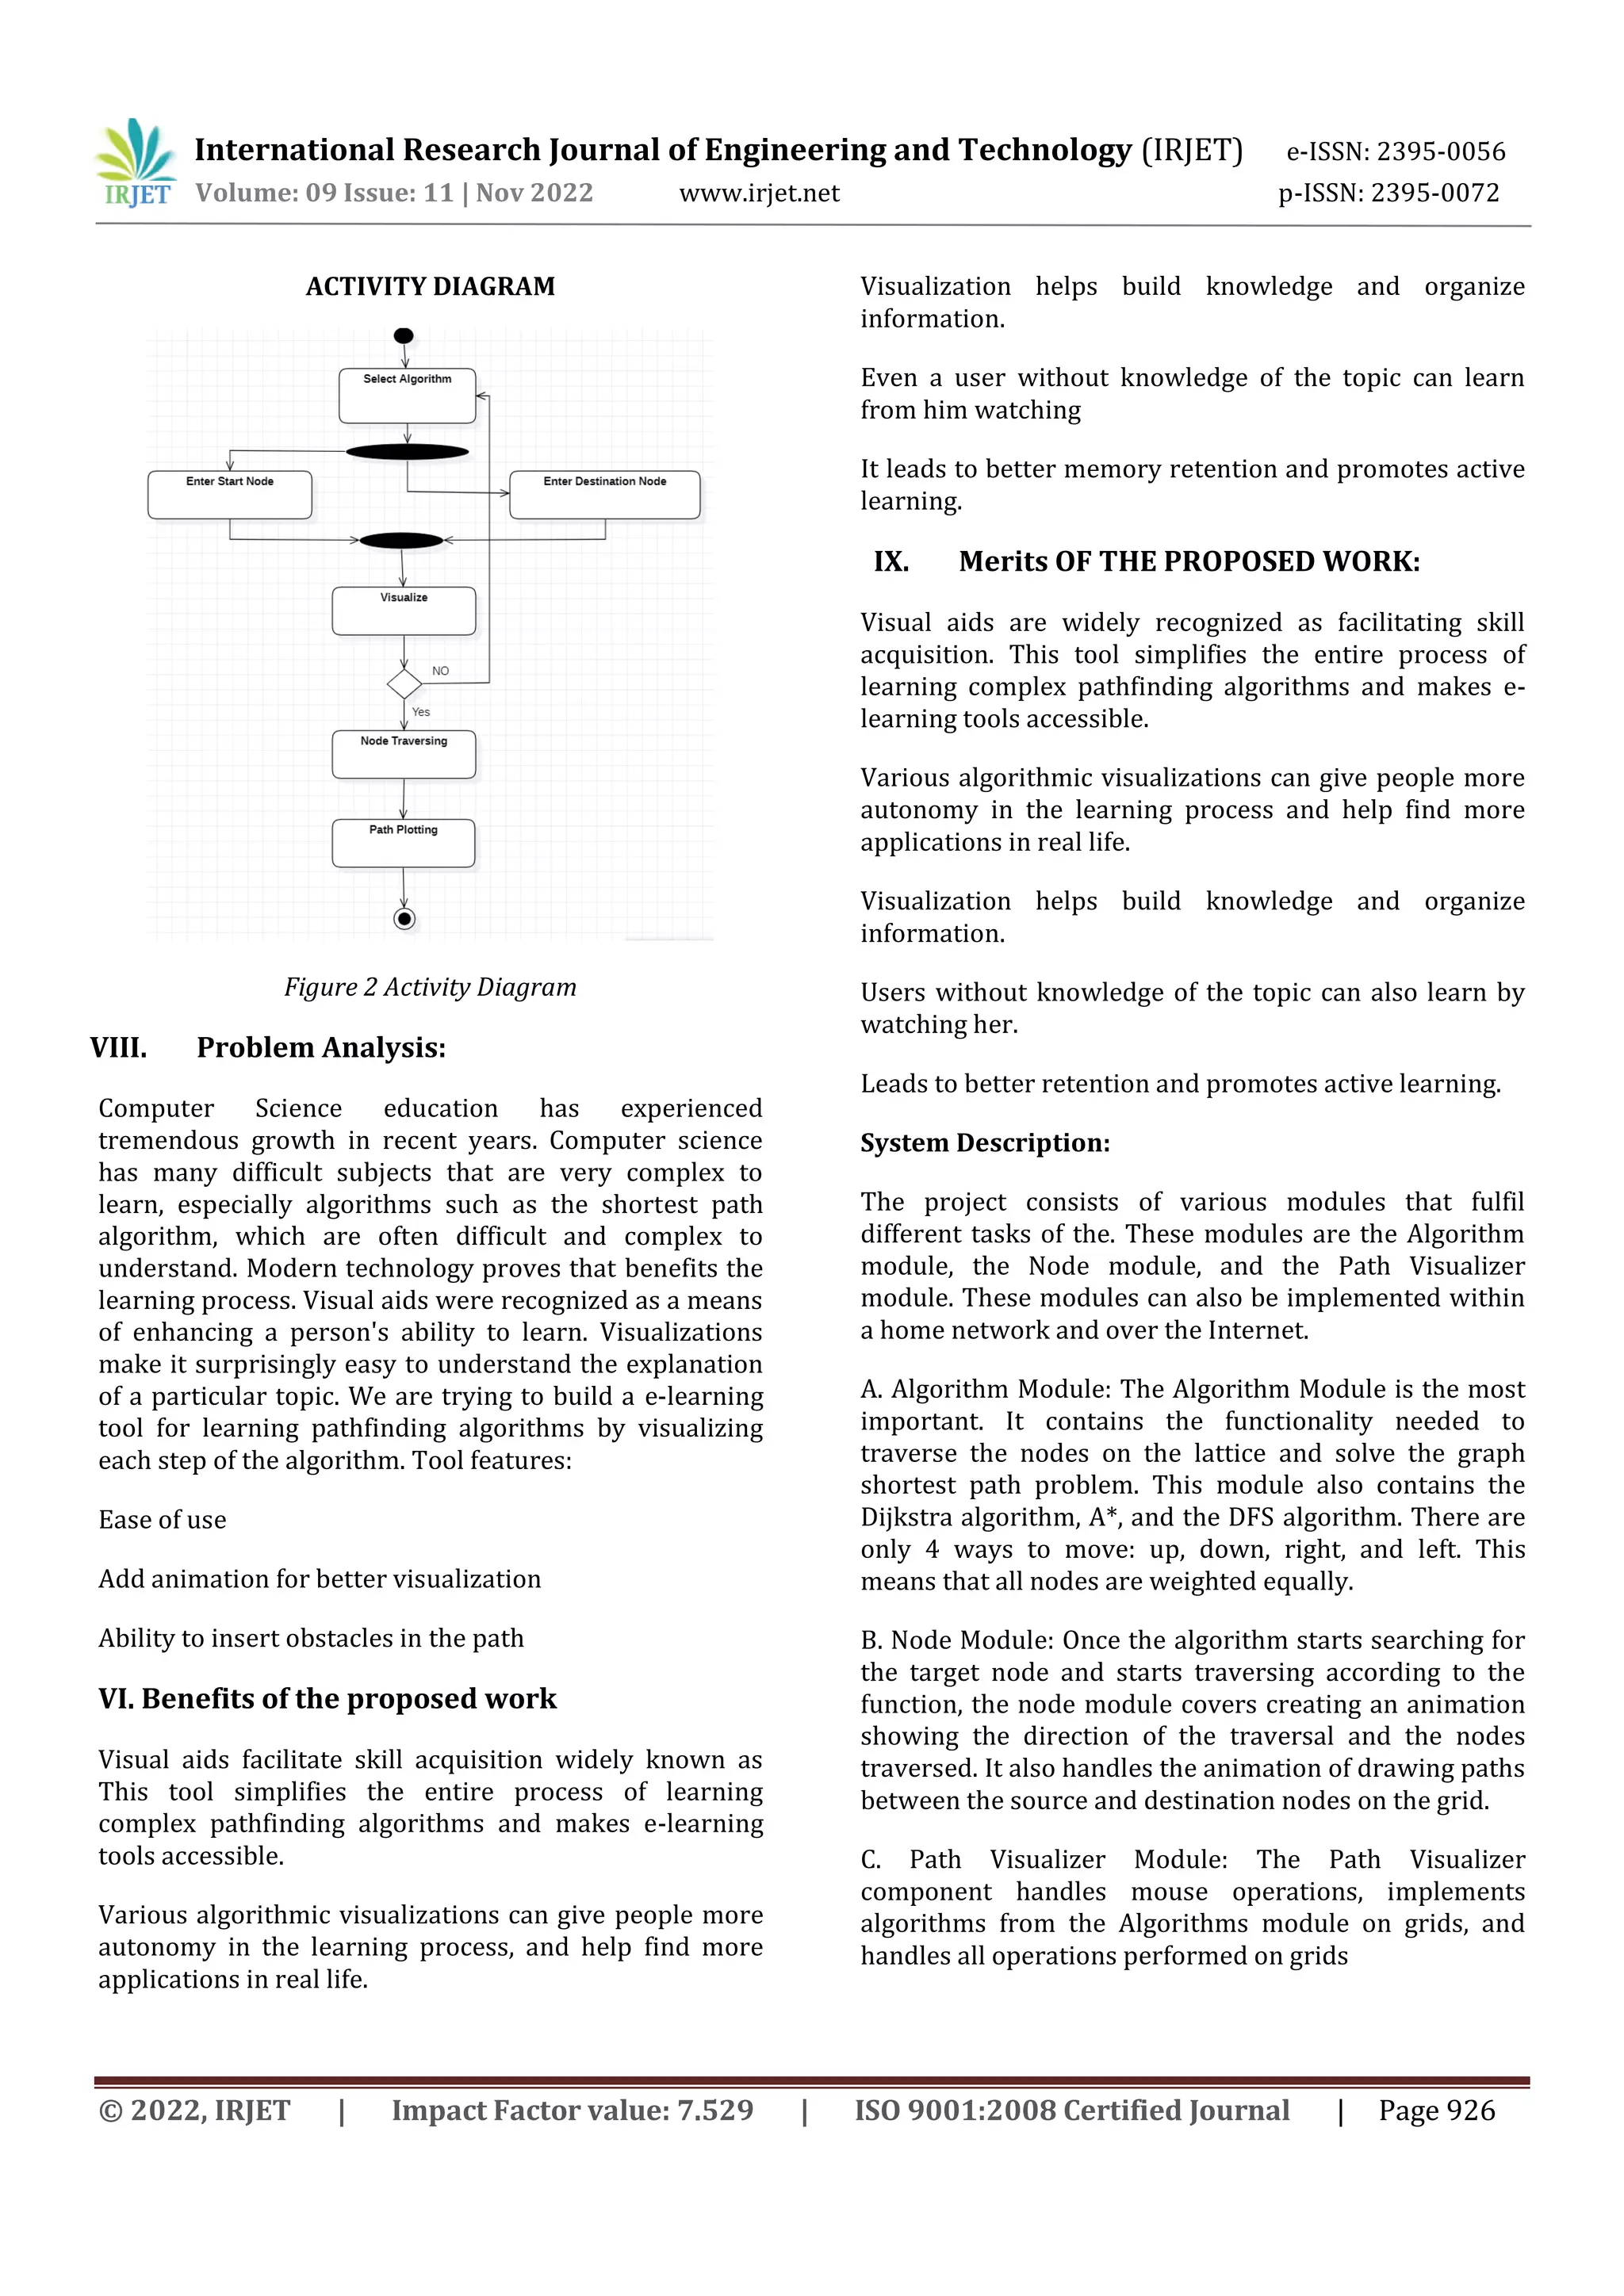
This document describes a project to create a web-based e-learning tool called the Pathfinding Visualizer to visualize shortest path algorithms like Dijkstra's algorithm. The tool allows users to select an algorithm, place nodes on a grid, and visualize each step of the algorithm to find the shortest path. This helps improve understanding of complex graph algorithms through interactive visualization. The tool is intended to make computer science education more effective by bridging the gap between theoretical algorithms and practical understanding.