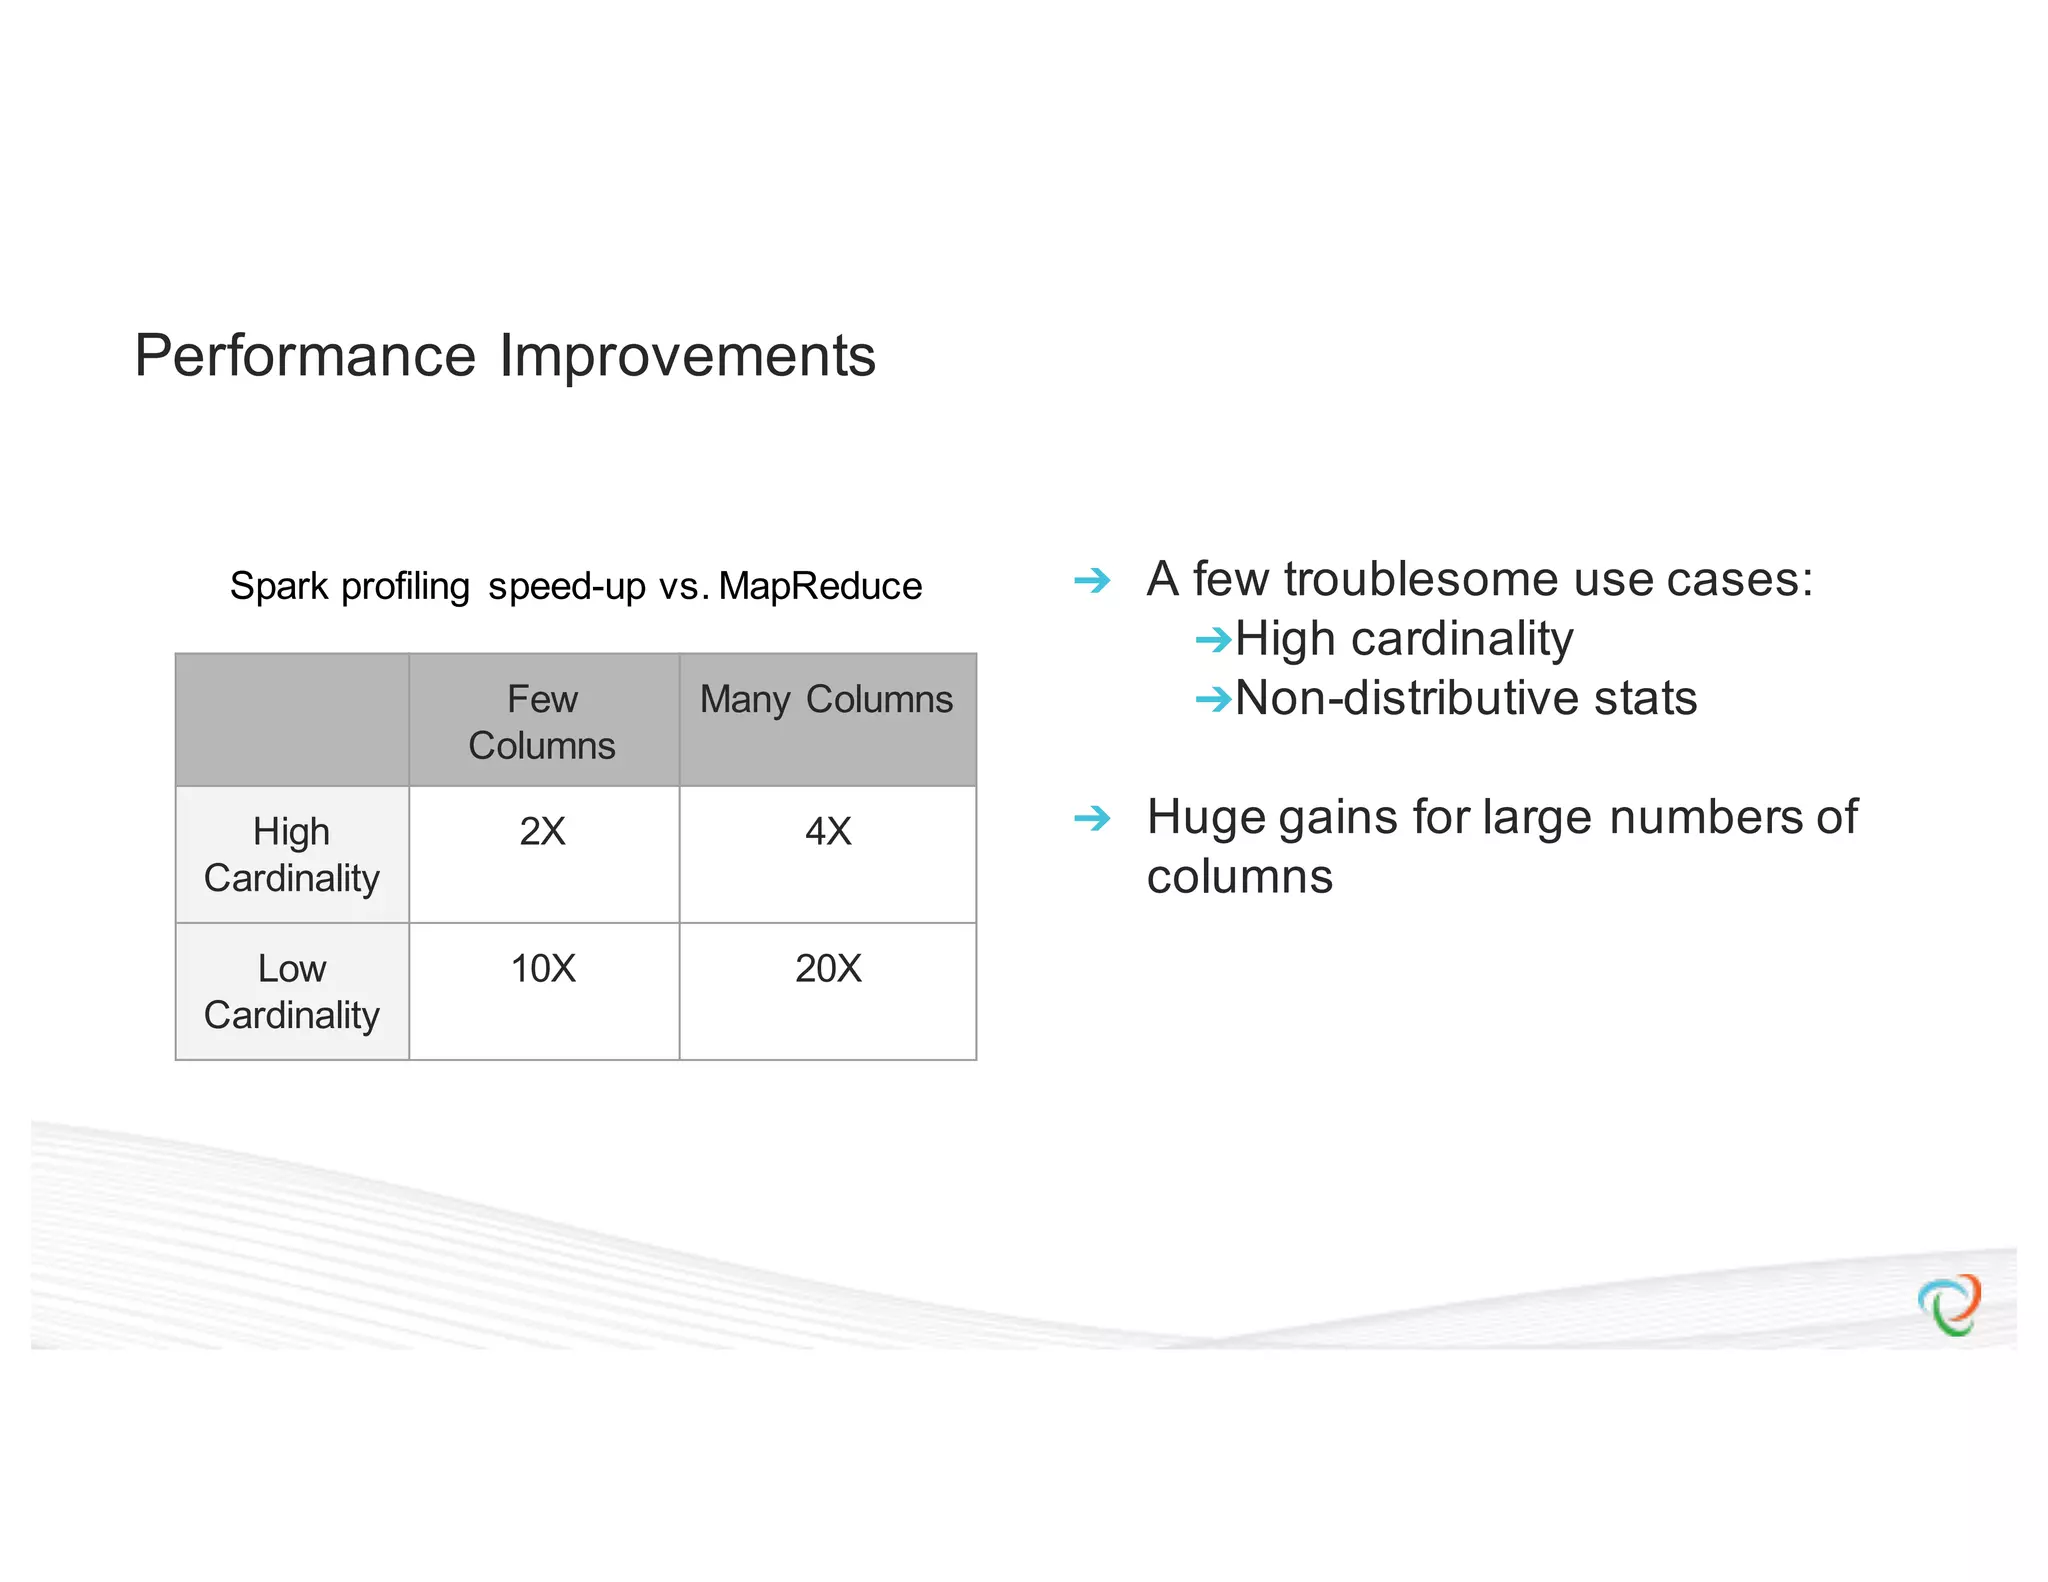
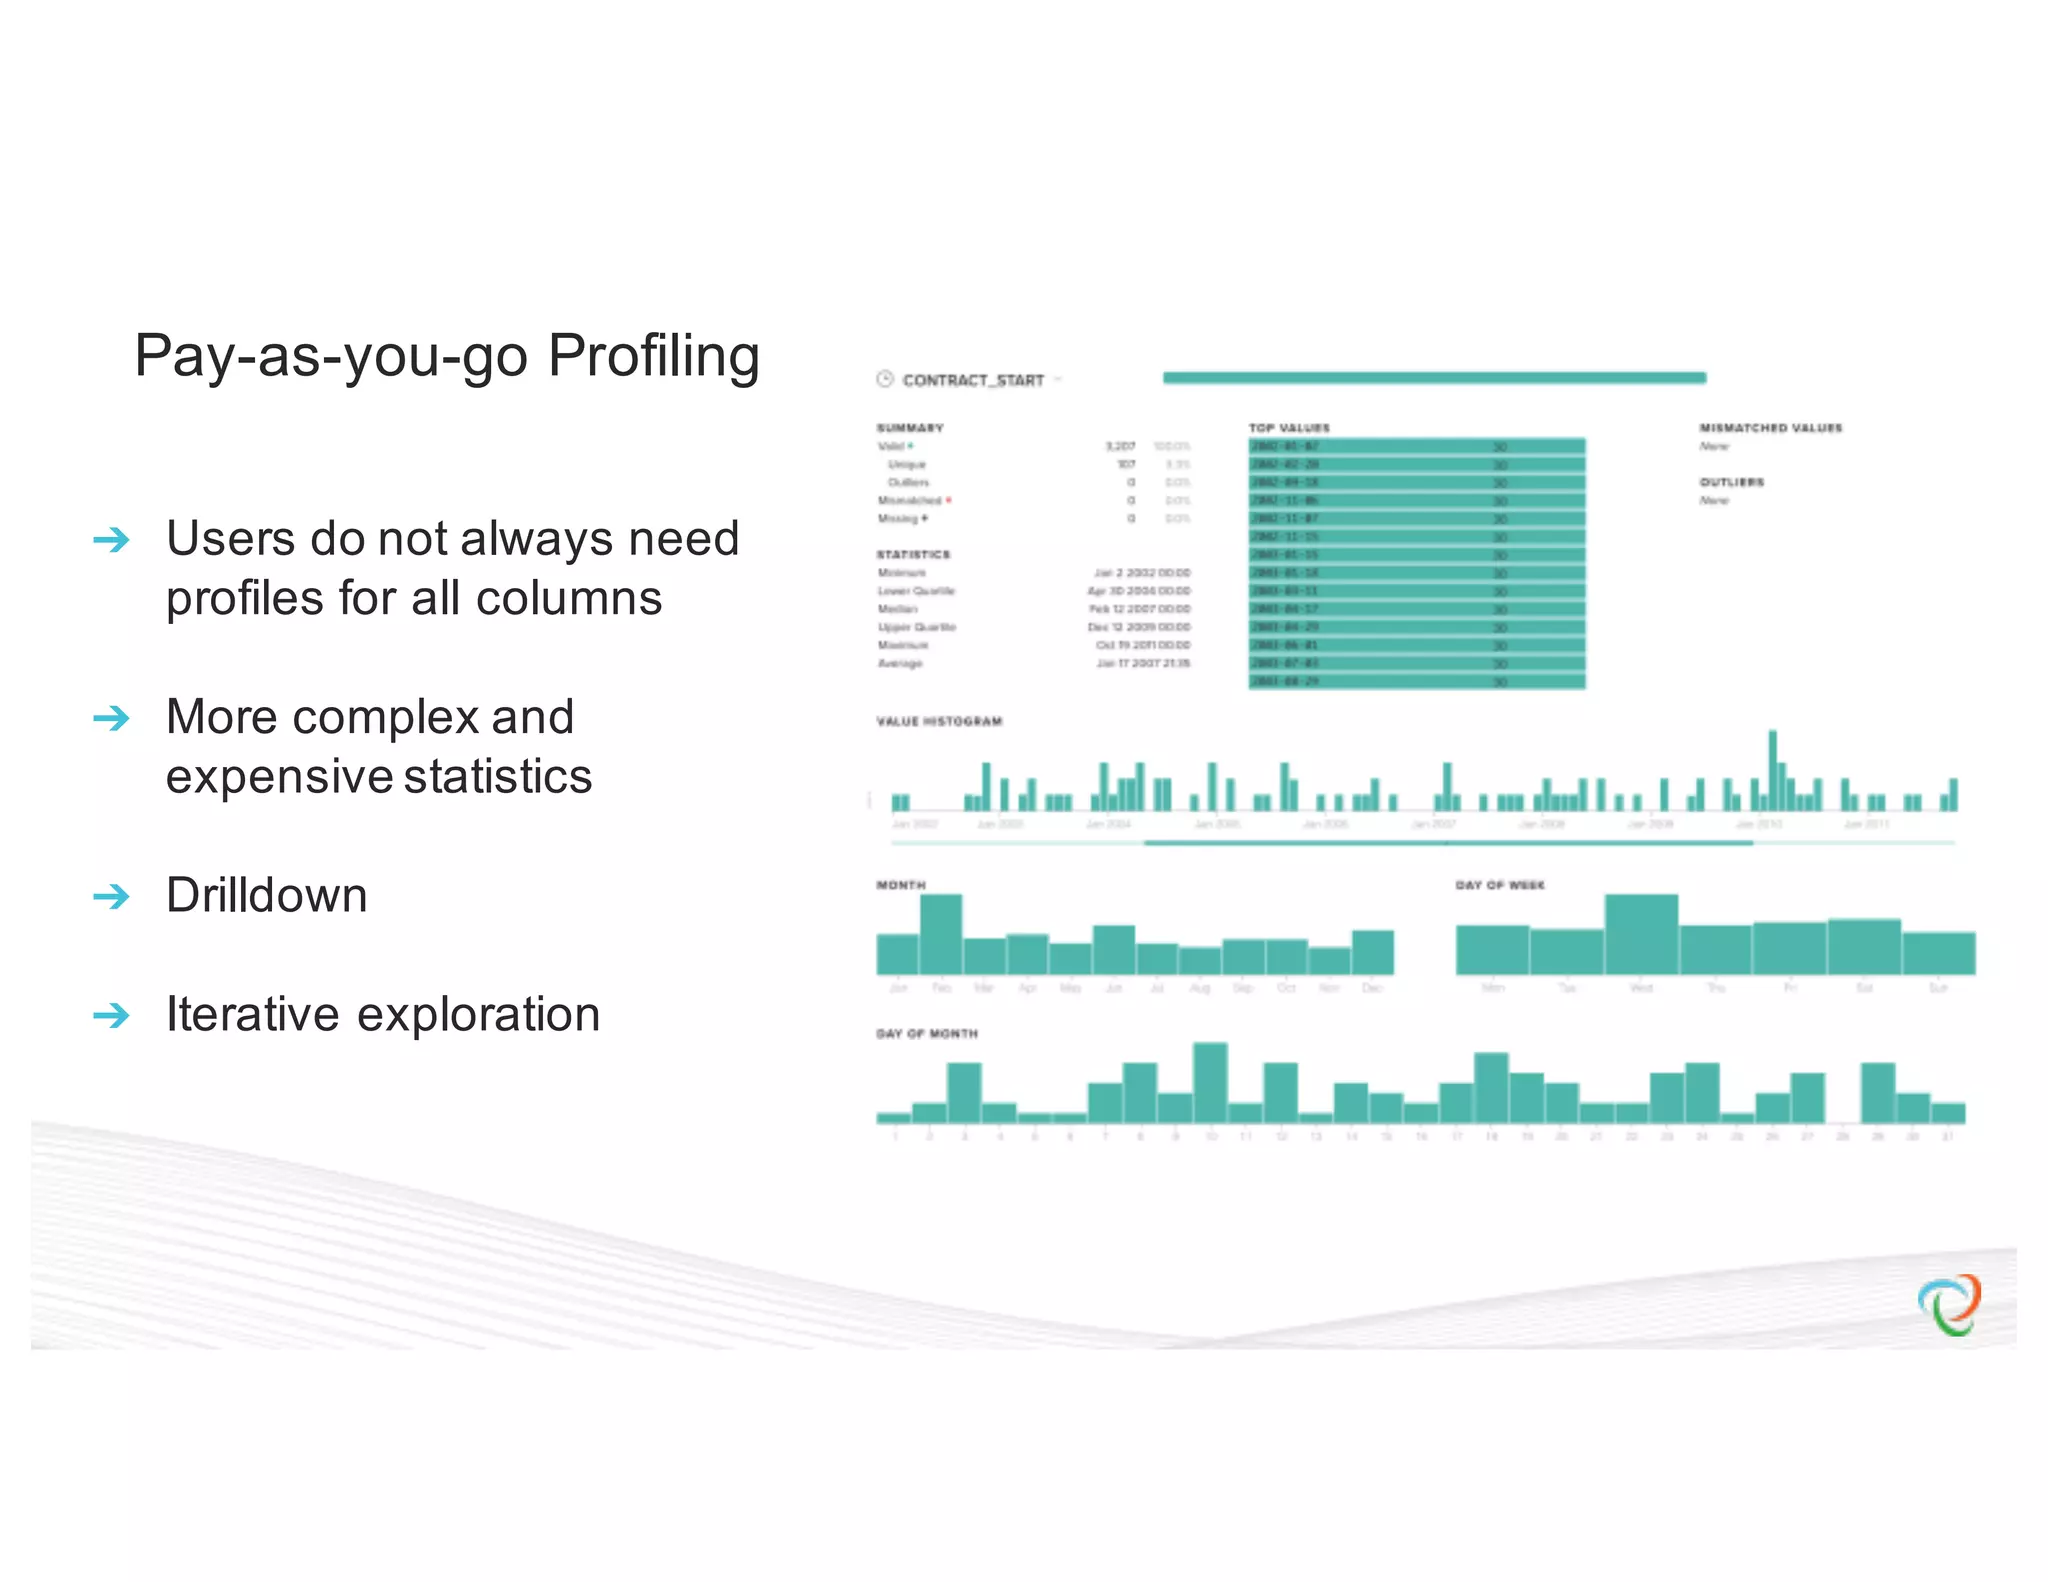
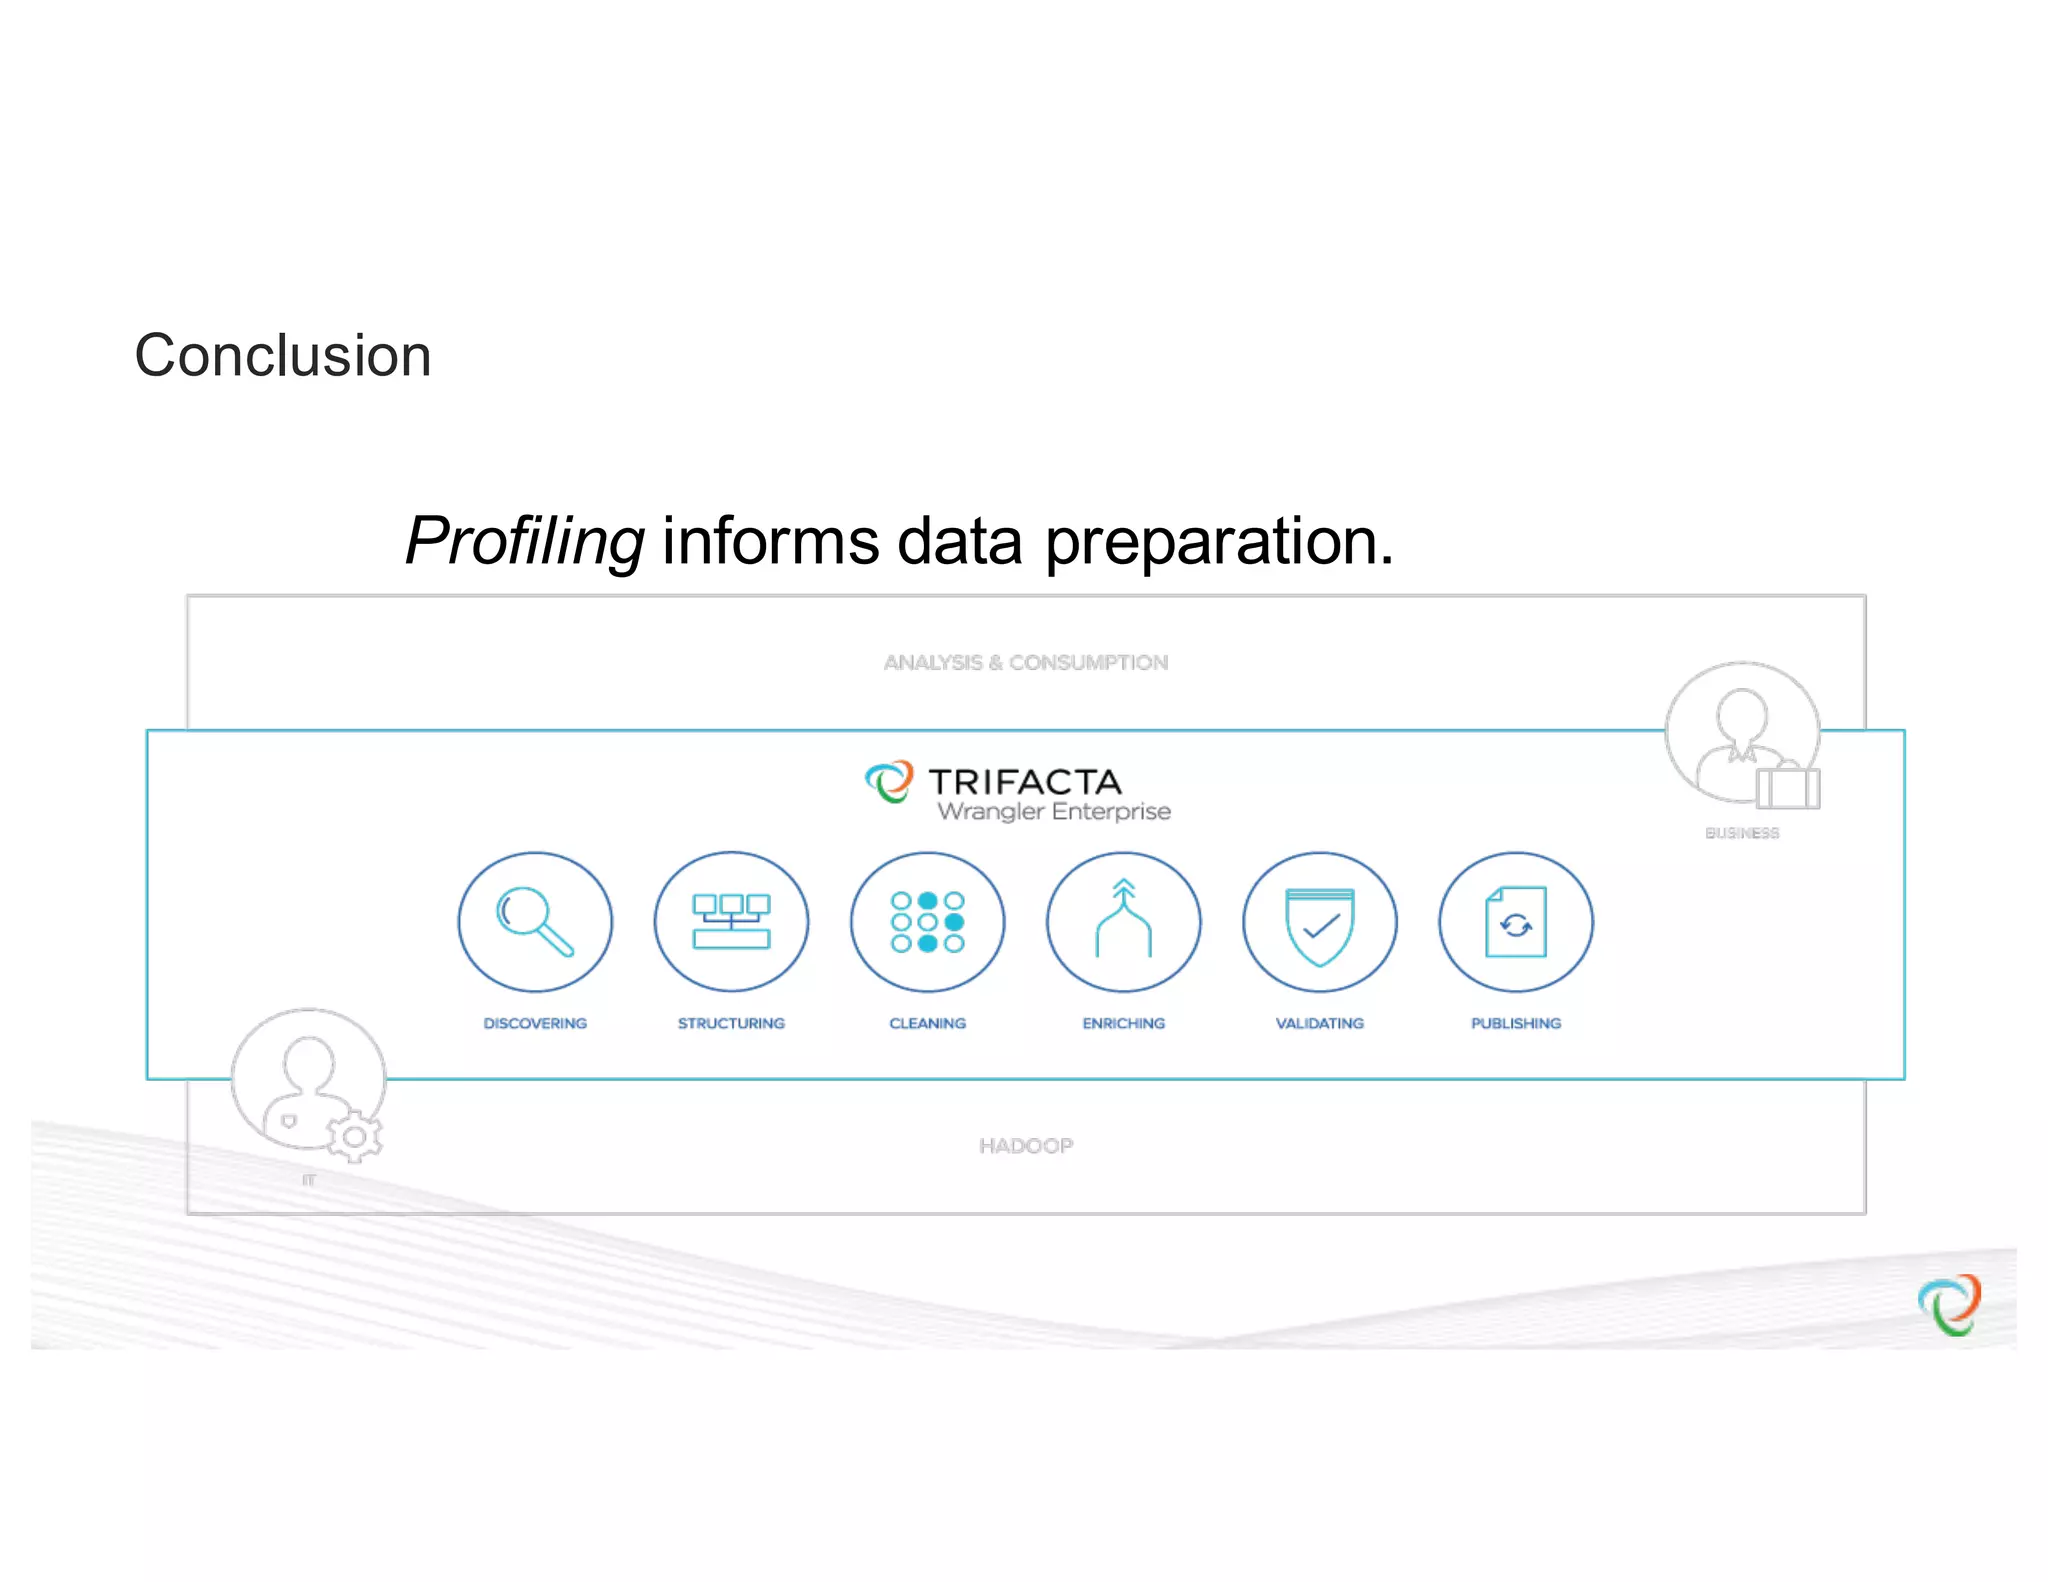
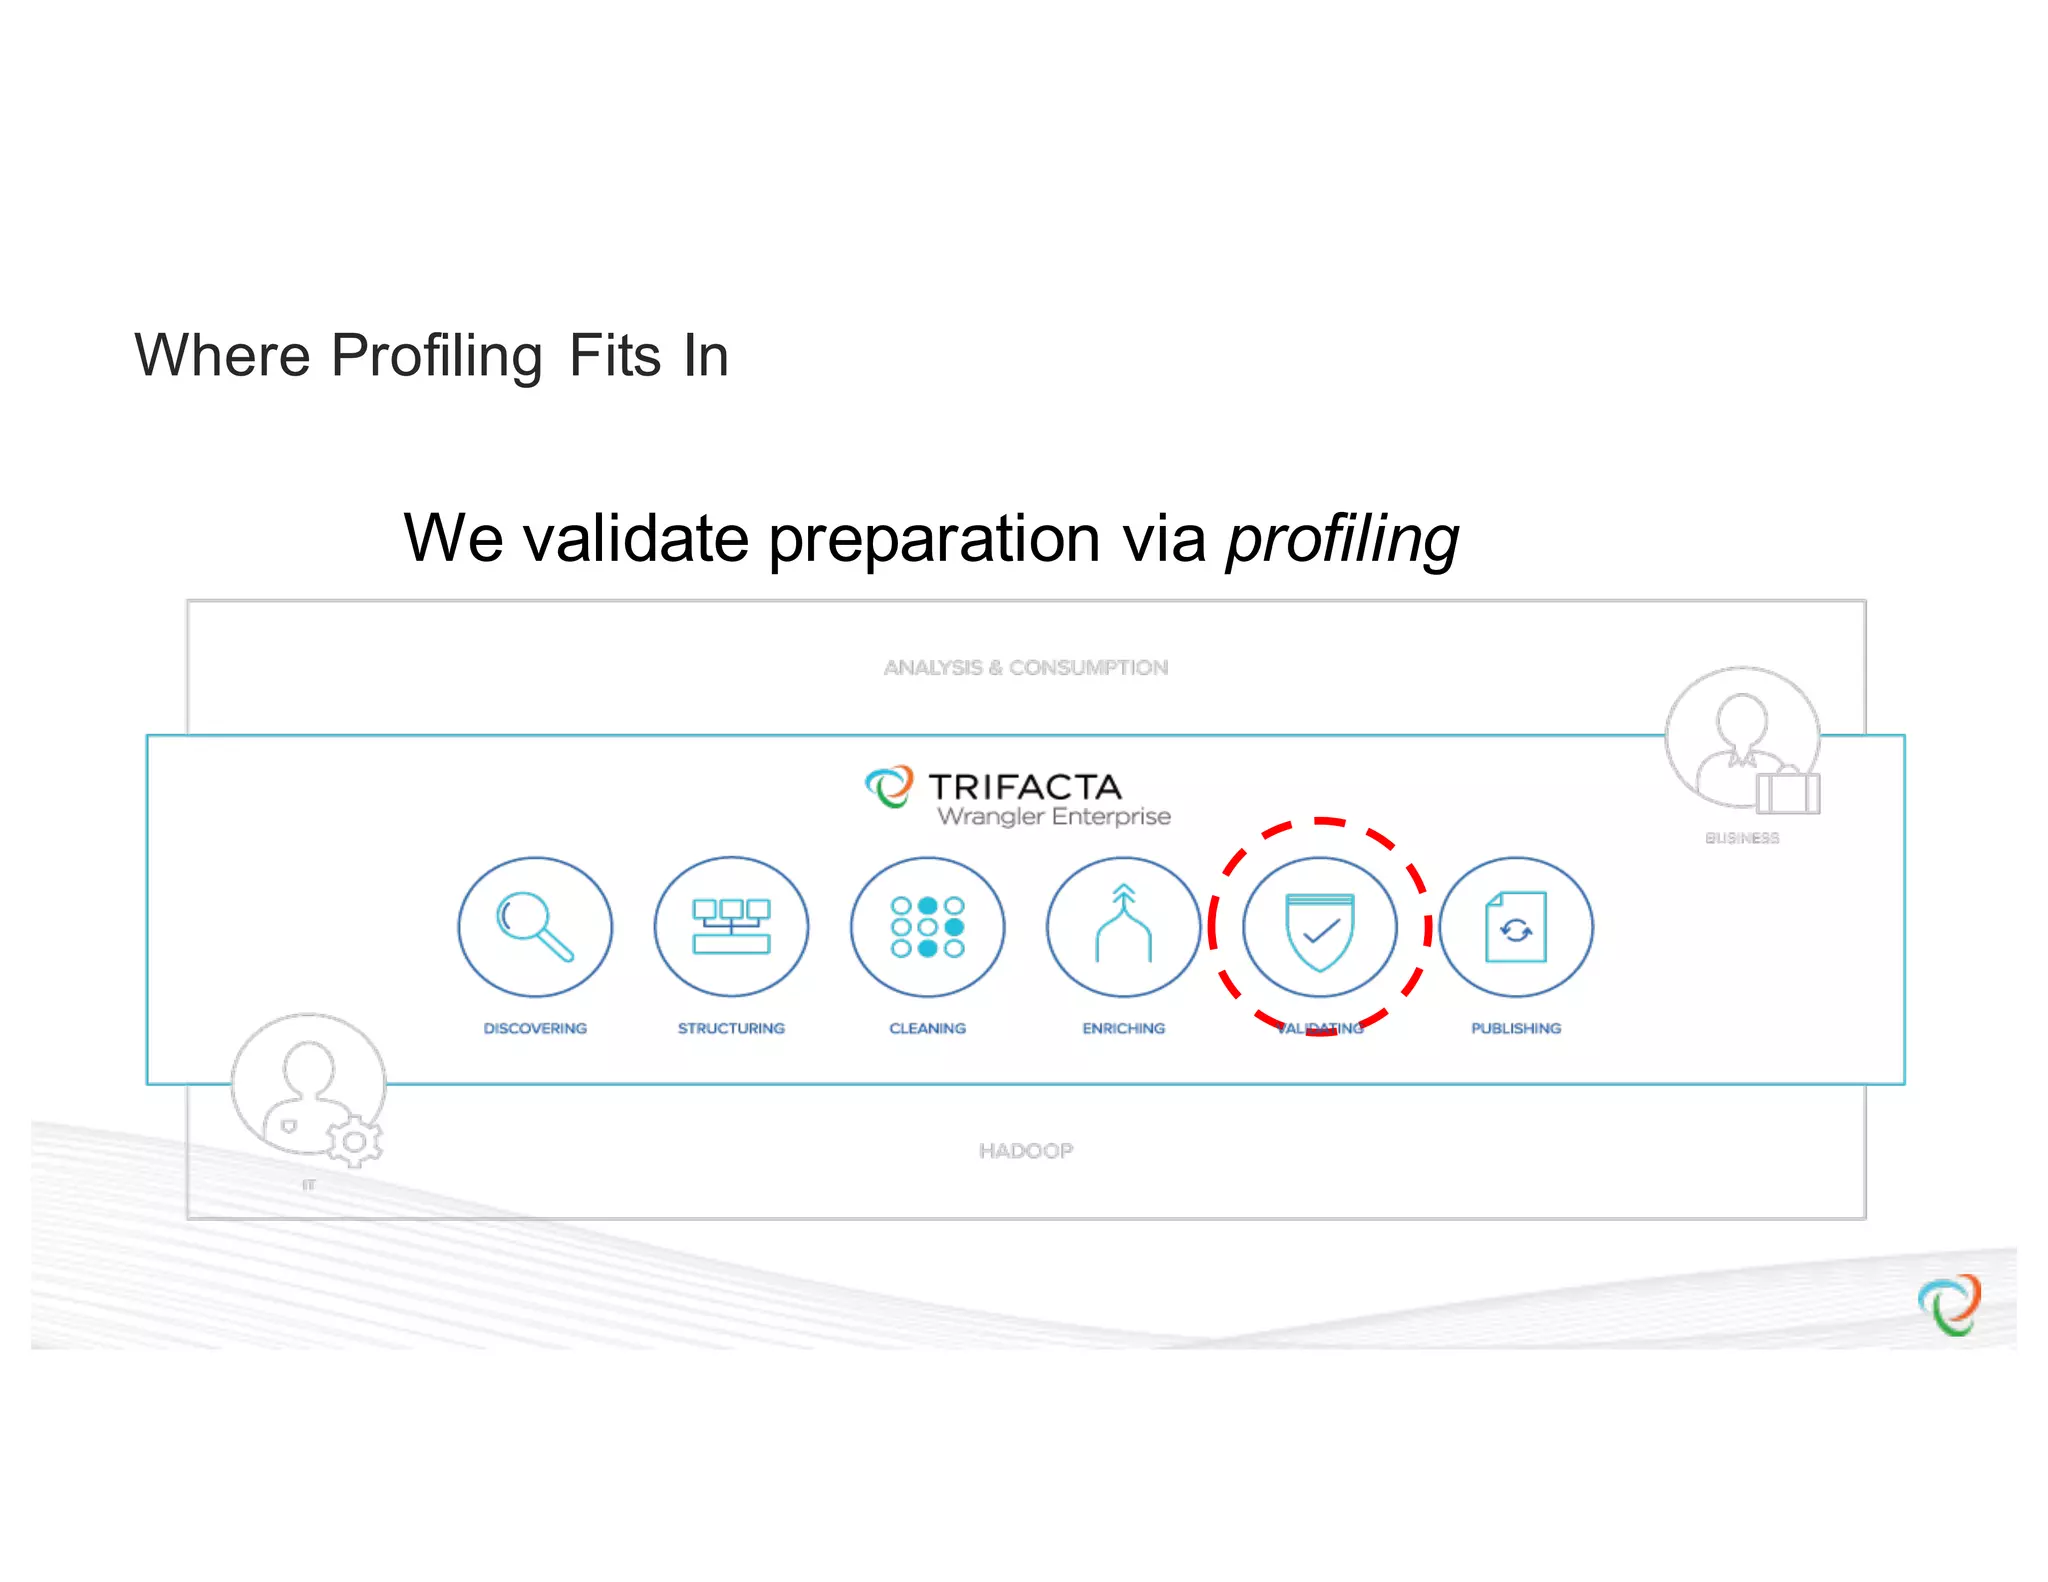
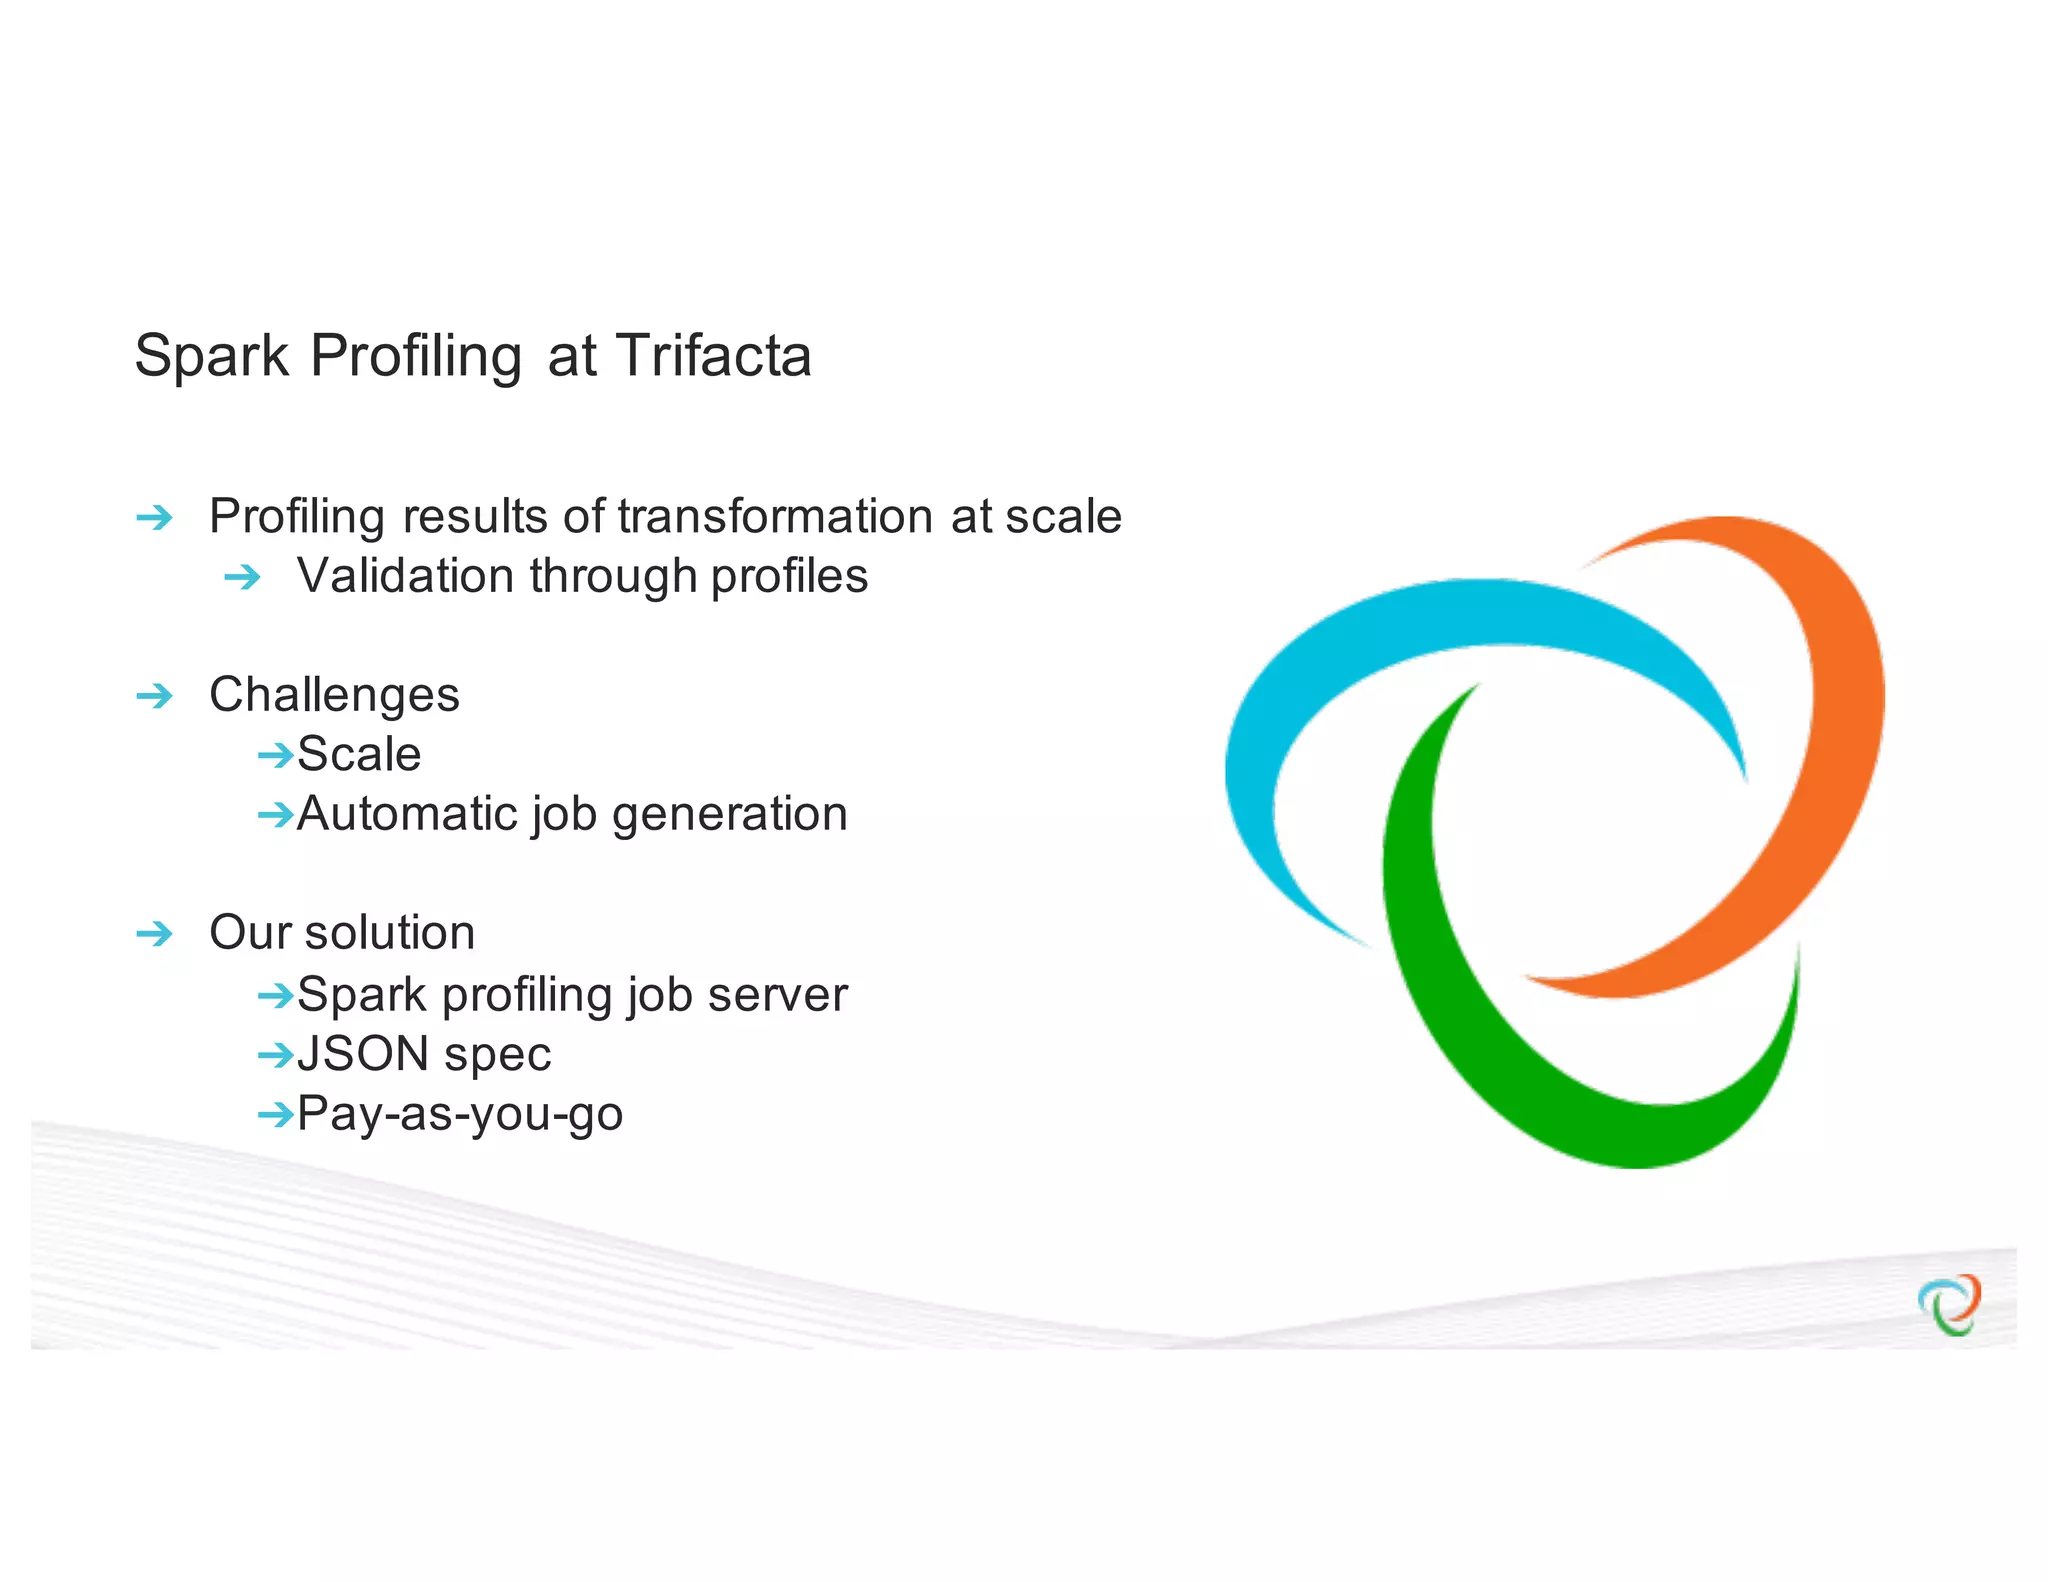
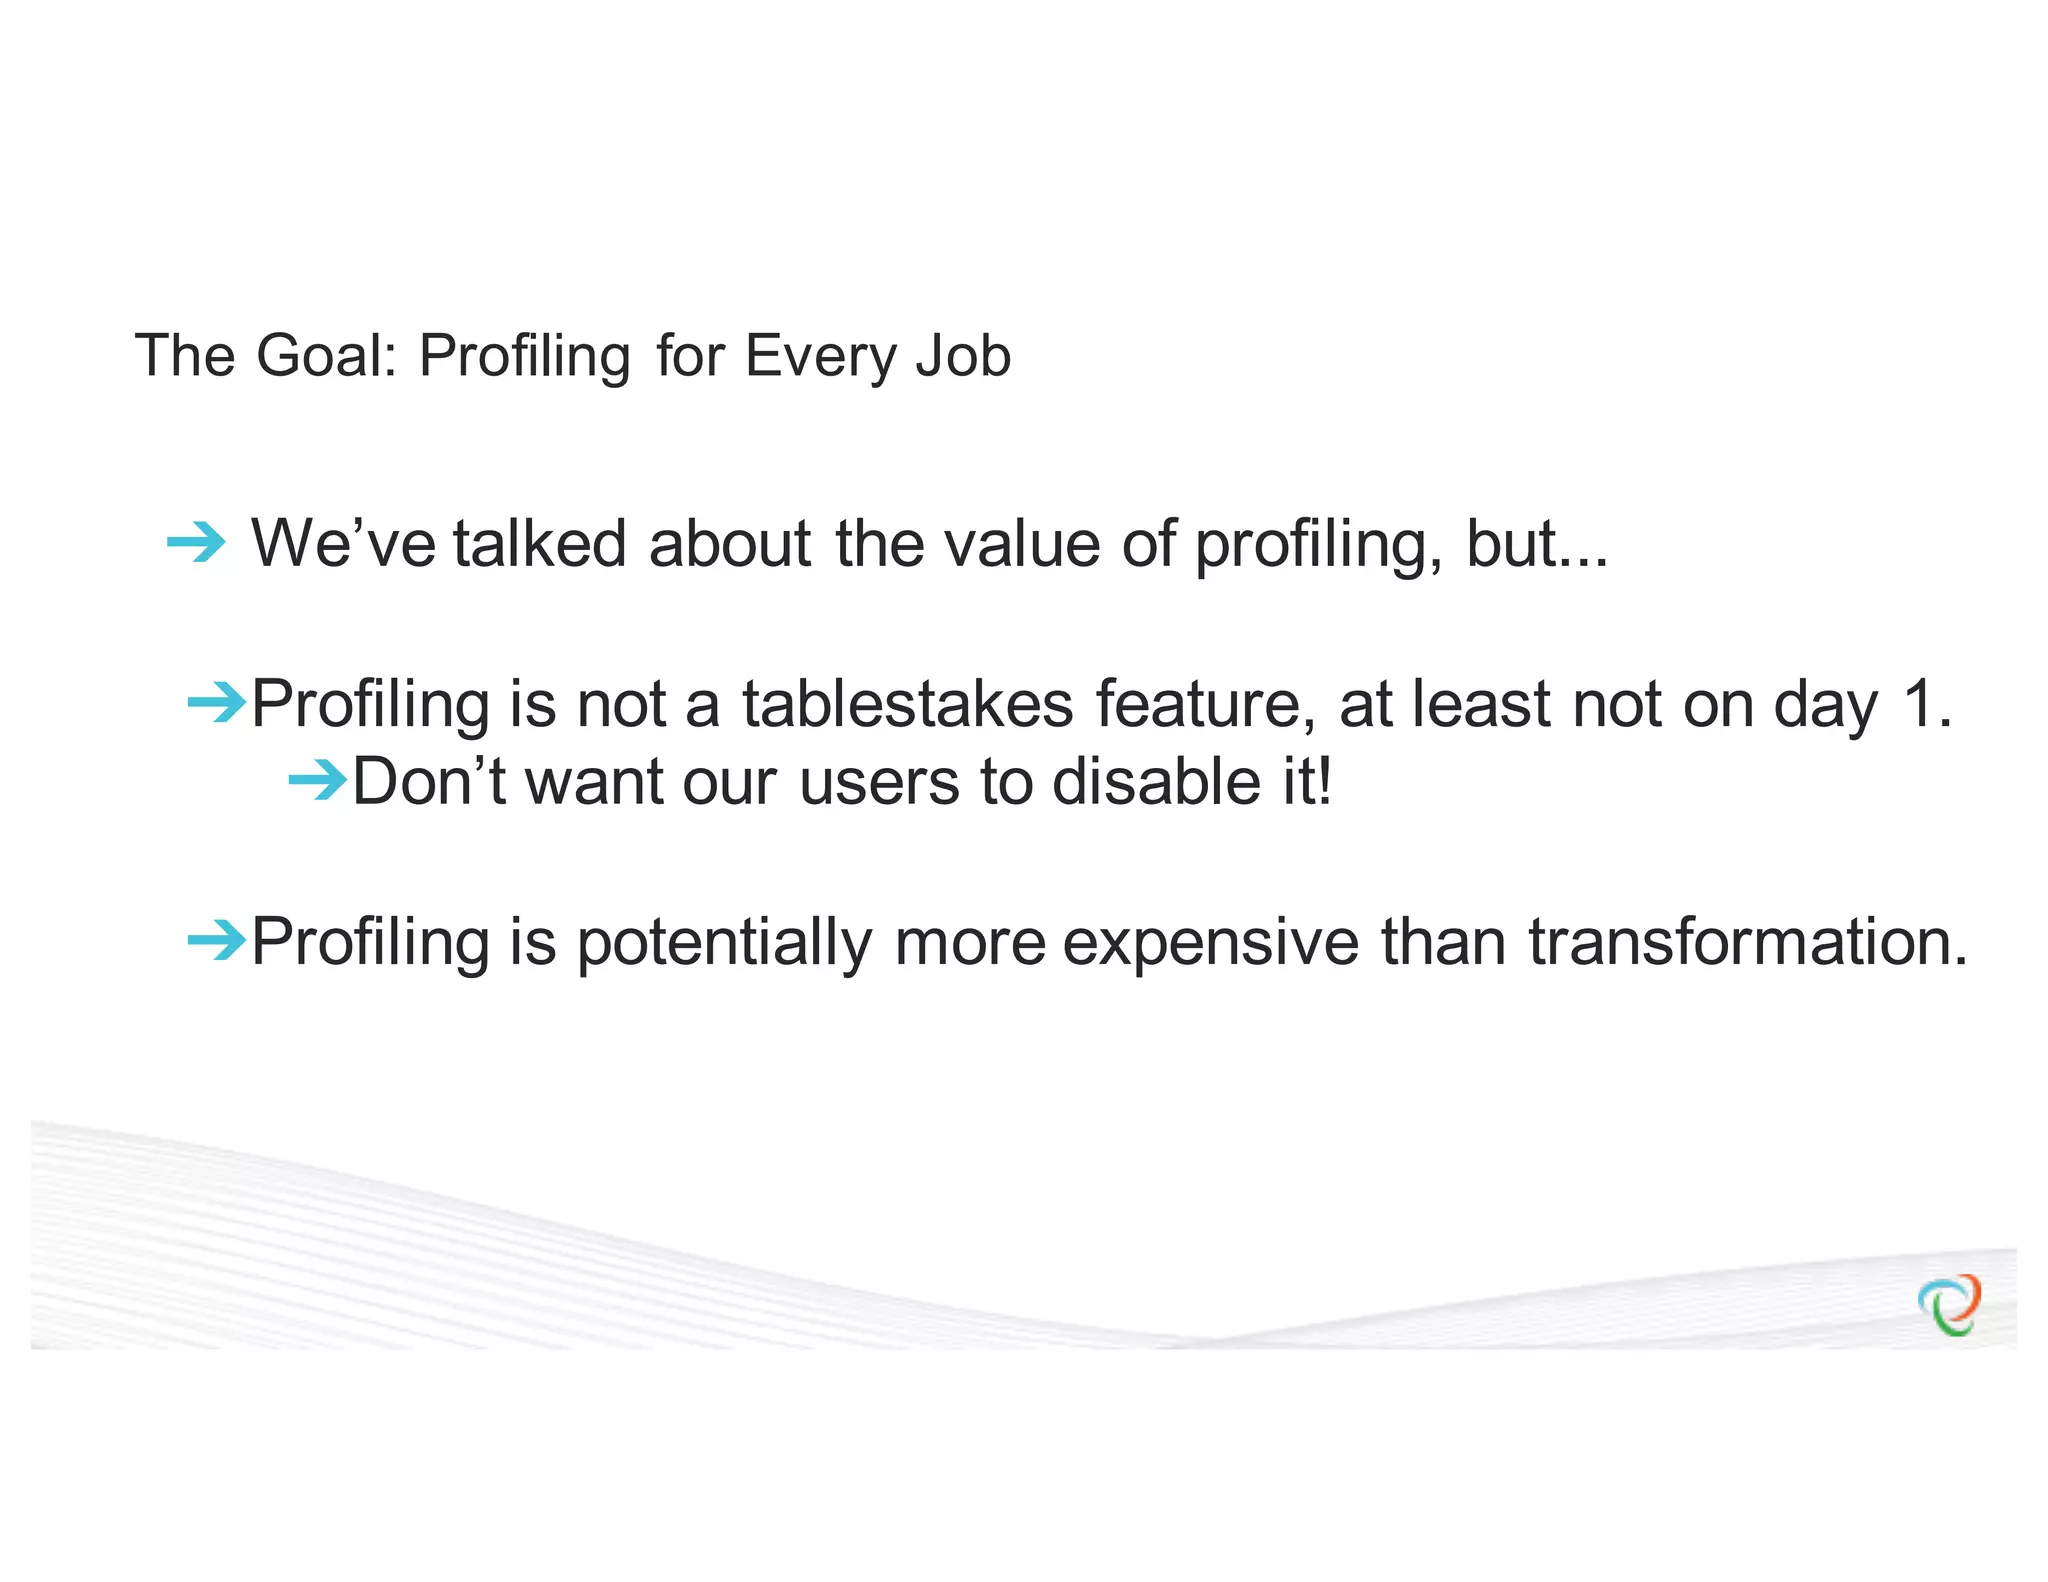
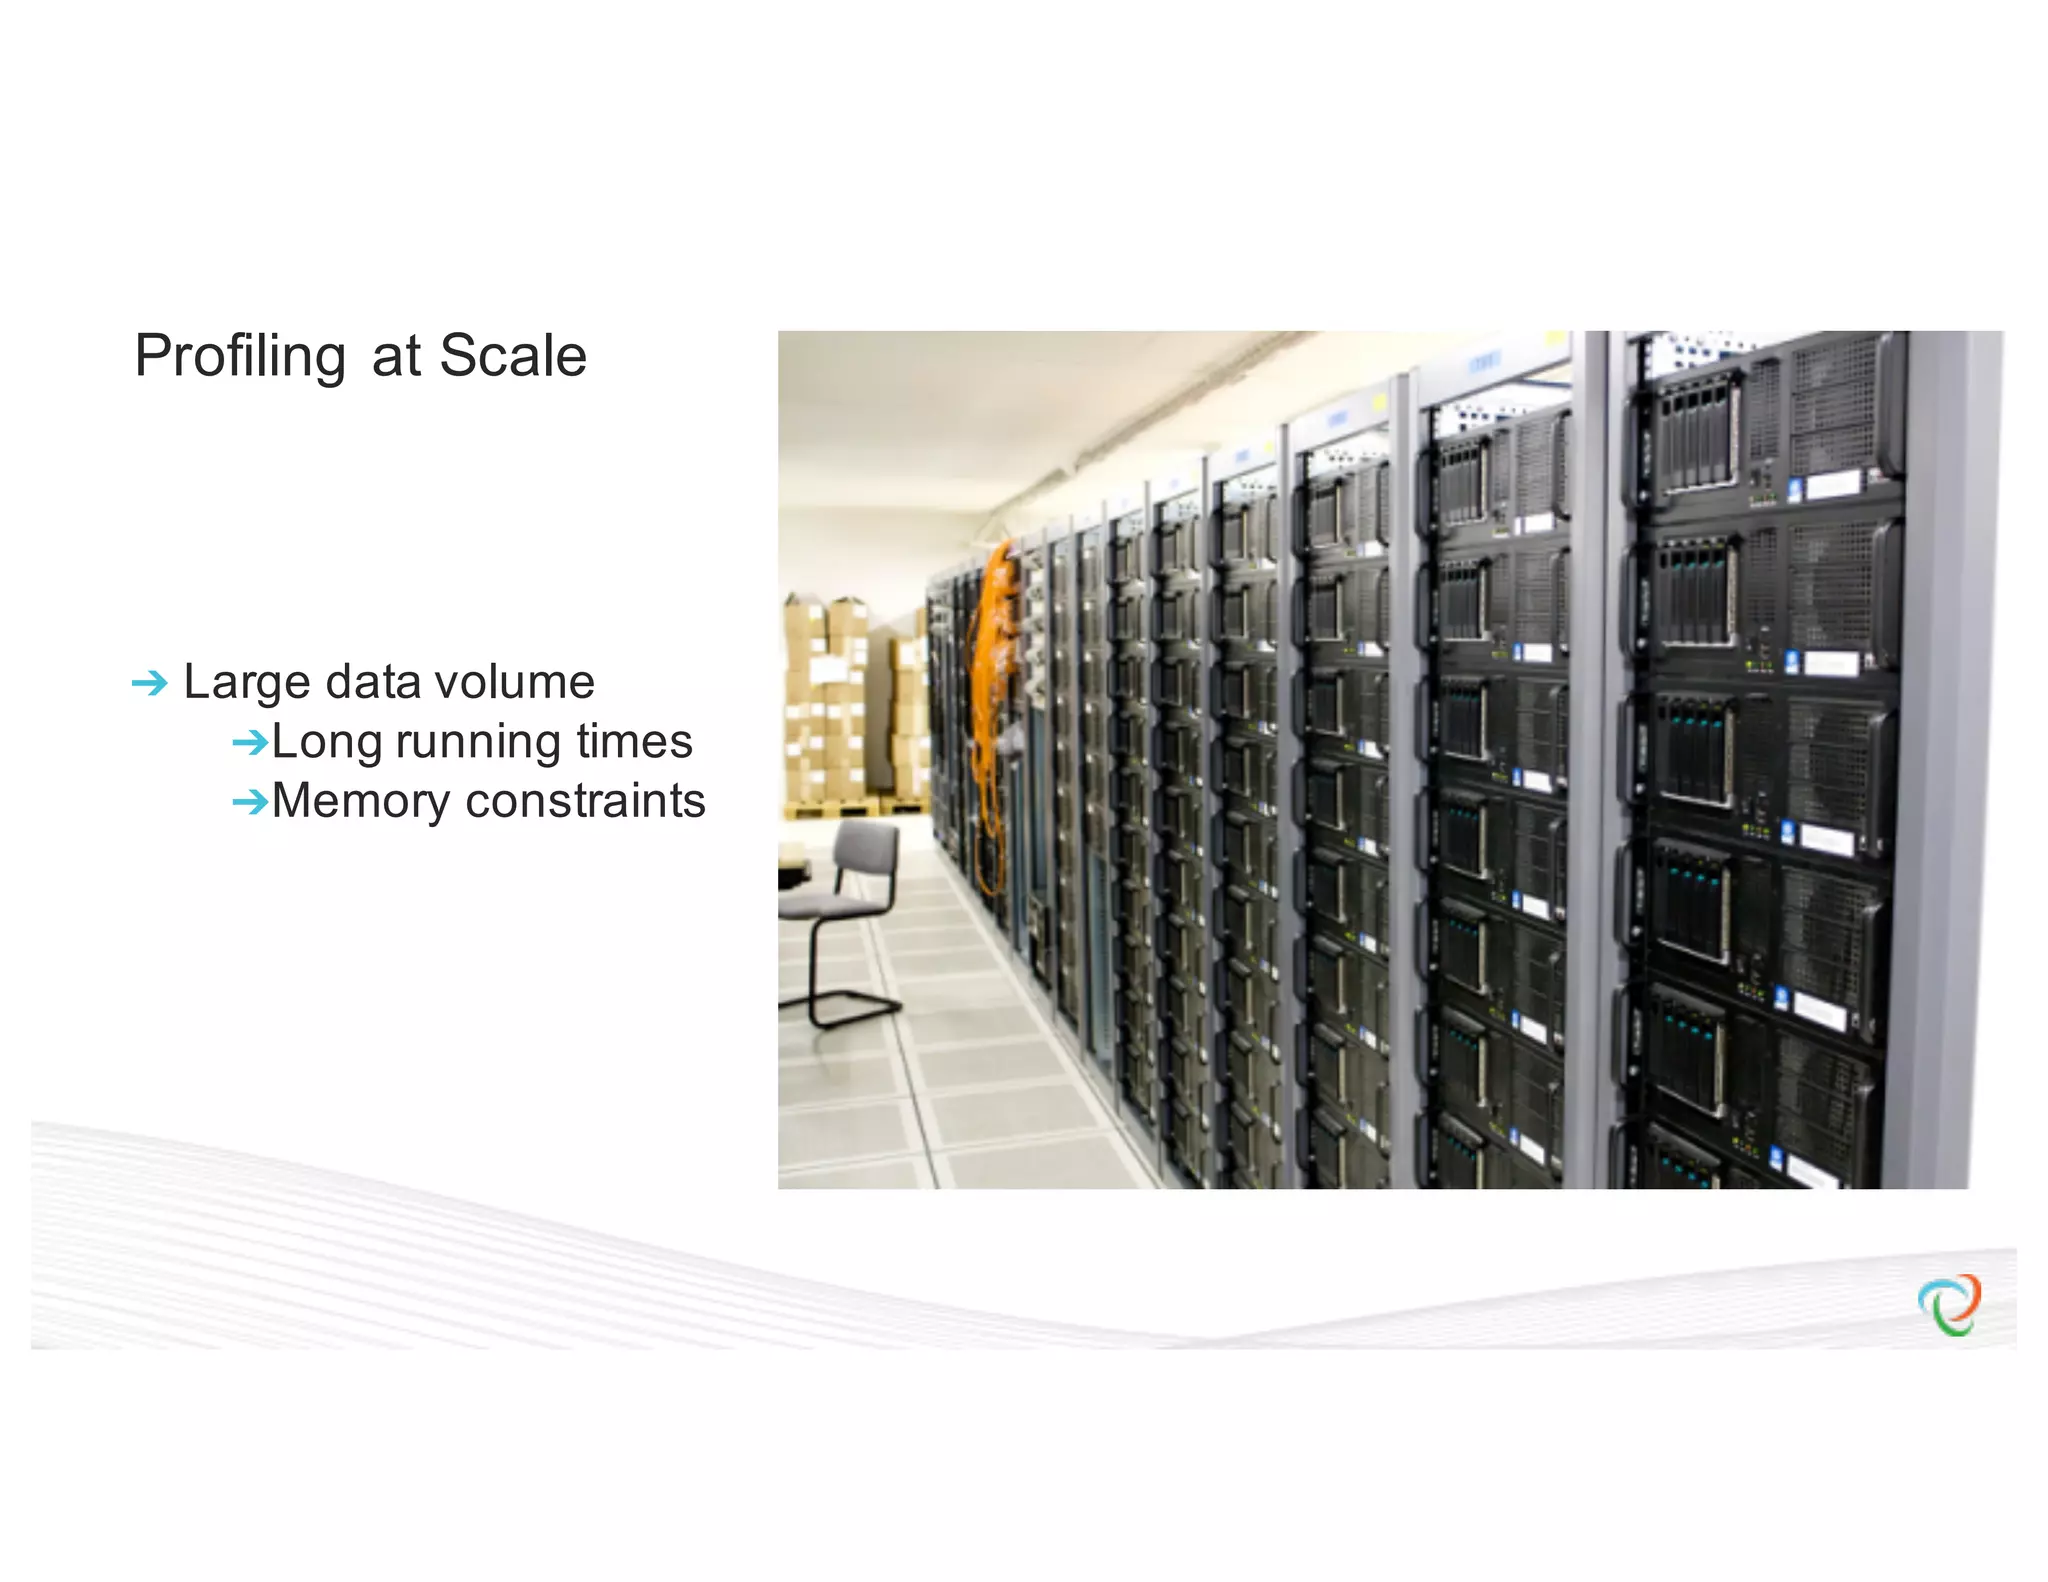
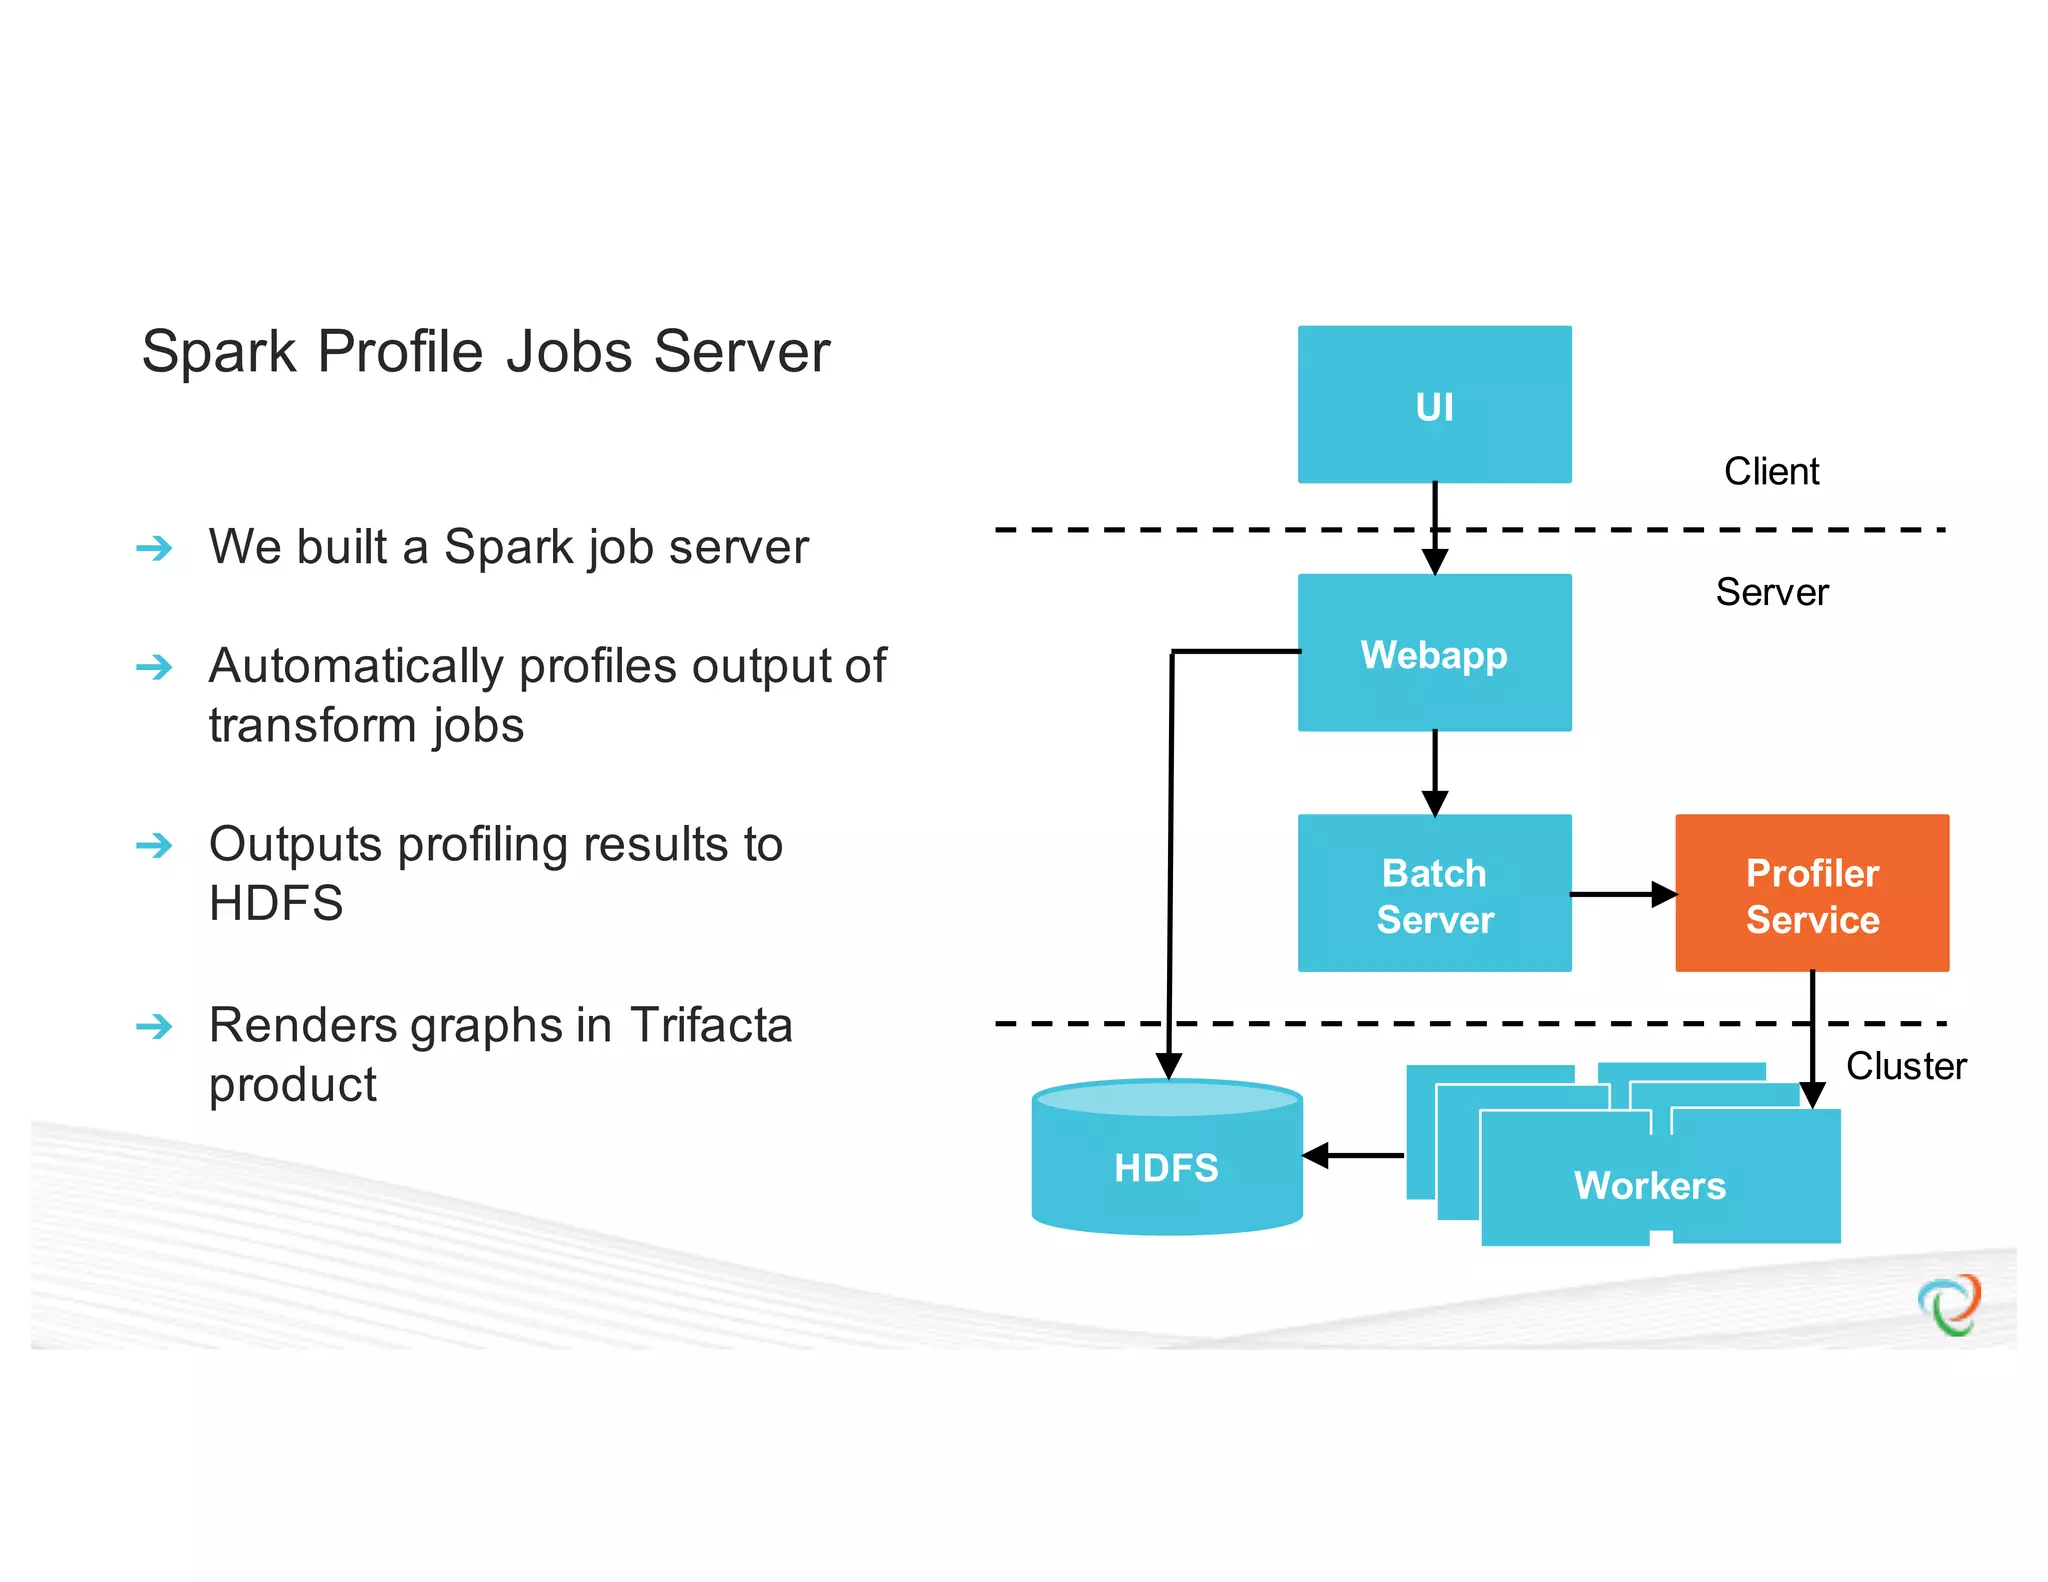
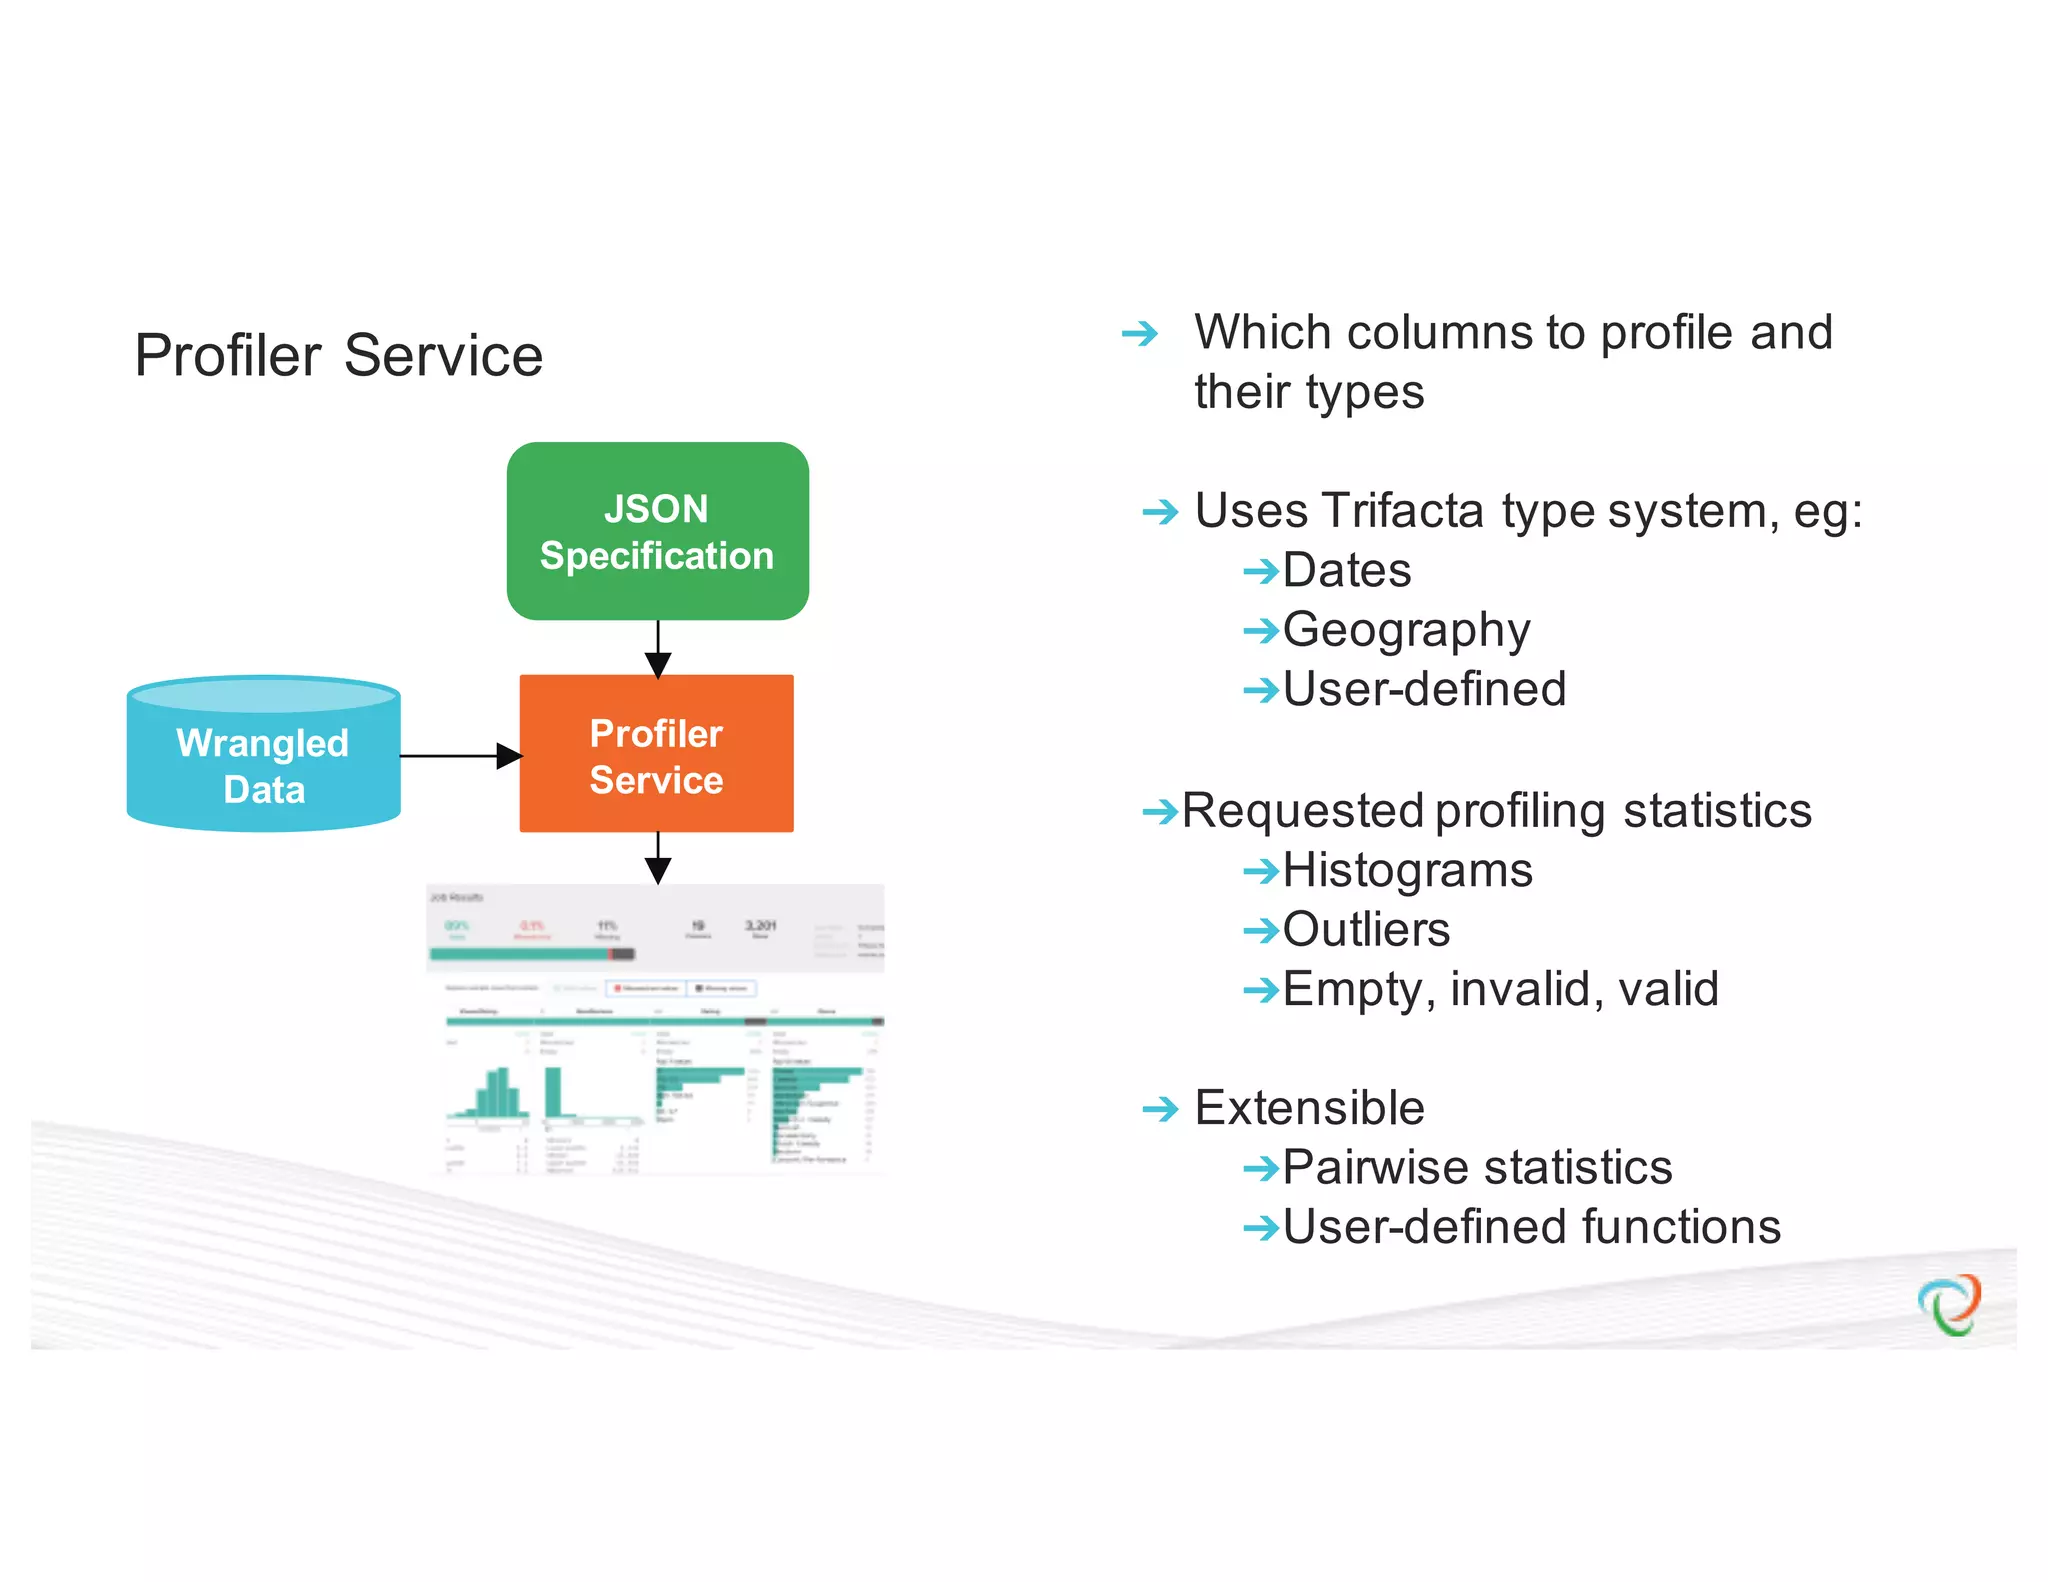
Scalable and Incremental Data Profiling with Spark Amelia Arbisser Adam Silberstein
Trifacta: Self-service data preparation What data analysts hope to achieve in data projects Analysis & Consumption MACHINE LEARNING VISUALIZATION STATISTICS
Trifacta: Self-service data preparation What data analysts hope to achieve in data projects 80% of time spent cleaning and preparing the data to be analyzed Analysis & Consumption MACHINE LEARNING VISUALIZATION STATISTICS
Trifacta: Self-service data preparation We speed up and take the pain out of preparation
Transforming Data in Trifacta
Predictive Interaction and Immediate Feedback
Predictive Interaction
Immediate Feedback
Transforming Data in Trifacta
Where Profiling Fits In We validate preparation via profiling
Spark Profiling at Trifacta ➔ Profiling results of transformation at scale ➔ Validation through profiles ➔ Challenges ➔Scale ➔Automatic job generation ➔ Our solution ➔Spark profiling job server ➔JSON spec ➔Pay-as-you-go
The Case for Profiling
Transforming Data in Trifacta
Job Results ➔ Even clean raw data is not informative. ➔Especially when it is too large to inspect manually. ➔Need a summary representation. ➔Statistical and visual ➔ Generate profile programmatically.
Visual Result Validation ➔ Similar to the profiling we saw above the data grid. ➔ Applied at scale, to the full result. ➔ Reveals mismatched, missing values.
Visual Result Validation
Challenges
The Goal: Profiling for Every Job ➔ We’ve talked about the value of profiling, but... ➔Profiling is not a tablestakes feature, at least not on day 1. ➔Don’t want our users to disable it! ➔Profiling is potentially more expensive than transformation.
Profiling at Scale ➔ Large data volume ➔Long running times ➔Memory constraints
Performance vs. Accuracy ➔Approximation brings performance gains while still meeting profiler summarization requirements. ➔Off-the-shelf libraries (count-min-sketch, T-digest) great for approximating counts and non-distributive stats. ➔Not a silver bullet though...sometimes approximations are confusing.
Flexible Job Generation ➔Profile for all users, all use cases: not a one-off ➔Diverse schemas ➔Any number of columns ➔ Calculate statistics for all data types ➔Numeric vs. categorical ➔Container types (maps, arrays,...) ➔User-defined
Transformation vs. Profiling ➔ Transformation is primarily row-based. ➔ Profiling is column-based. ➔ Different execution concerns.
Solution: Spark in the Trifacta System
Why Spark ➔ Effective at OLAP ➔ Flexible enough for UDFs ➔ Not tied to distributions ➔ Mass adoption ➔ Low latency
Spark Profile Jobs Server UI Webapp Batch Server Profiler Service Client Server Cluster HDFS ➔ We built a Spark job server ➔ Automatically profiles output of transform jobs ➔ Outputs profiling results to HDFS ➔ Renders graphs in Trifacta product Batch ServerBatSBatS Workers
Profiler Service ➔ Which columns to profile and their types ➔ Uses Trifacta type system, eg: ➔Dates ➔Geography ➔User-defined ➔Requested profiling statistics ➔Histograms ➔Outliers ➔Empty, invalid, valid ➔ Extensible ➔Pairwise statistics ➔User-defined functions Profiler Service JSON Specification Wrangled Data
{ “input”: “hdfs://hadoop.trifacta-dev.net:8020:/trifacta…”, “schema”: { “order”: [“column1”, “column2”, “column3”], “types”: { “column1”: [“Datetime”, {“regexes”: , “groupLocs”: {...}}], “column2”: [...], “column3”: [...] } }, “commands”: [ { “column”: “*”, “output”: “hdfs://hadoop.trifacta-dev.net:8020:/trifacta…”, “profiler-type”: “histogram”, “params”: {...} }, { “column”: “column1”, “output”: “hdfs://hadoop.trifacta-dev.net:8020:/trifacta…”, “profiler-type”: “type-check”, “params”: {...} } ] } Profiling DSL
Performance Improvements ➔ A few troublesome use cases: ➔High cardinality ➔Non-distributive stats ➔ Huge gains for large numbers of columns Few Columns Many Columns High Cardinality 2X 4X Low Cardinality 10X 20X Spark profiling speed-up vs. MapReduce
Pay-as-you-go Profiling ➔ Users do not always need profiles for all columns ➔ More complex and expensive statistics ➔ Drilldown ➔ Iterative exploration
Conclusion Profiling informs data preparation.
Questions?

Scalable And Incremental Data Profiling With Spark

  • 1.
    Scalable and Incremental DataProfiling with Spark Amelia Arbisser Adam Silberstein
  • 2.
    Trifacta: Self-service datapreparation What data analysts hope to achieve in data projects Analysis & Consumption MACHINE LEARNING VISUALIZATION STATISTICS
  • 3.
    Trifacta: Self-service datapreparation What data analysts hope to achieve in data projects 80% of time spent cleaning and preparing the data to be analyzed Analysis & Consumption MACHINE LEARNING VISUALIZATION STATISTICS
  • 4.
    Trifacta: Self-service datapreparation We speed up and take the pain out of preparation
  • 5.
  • 6.
  • 7.
    Predictive Interaction andImmediate Feedback
  • 8.
  • 9.
  • 10.
  • 11.
  • 14.
    Where Profiling FitsIn We validate preparation via profiling
  • 15.
    Spark Profiling atTrifacta ➔ Profiling results of transformation at scale ➔ Validation through profiles ➔ Challenges ➔Scale ➔Automatic job generation ➔ Our solution ➔Spark profiling job server ➔JSON spec ➔Pay-as-you-go
  • 16.
    The Case forProfiling
  • 17.
  • 18.
    Job Results ➔ Evenclean raw data is not informative. ➔Especially when it is too large to inspect manually. ➔Need a summary representation. ➔Statistical and visual ➔ Generate profile programmatically.
  • 19.
    Visual Result Validation ➔Similar to the profiling we saw above the data grid. ➔ Applied at scale, to the full result. ➔ Reveals mismatched, missing values.
  • 20.
    Visual Result Validation ➔Similar to the profiling we saw above the data grid. ➔ Applied at scale, to the full result. ➔ Reveals mismatched, missing values.
  • 21.
  • 22.
  • 23.
    The Goal: Profilingfor Every Job ➔ We’ve talked about the value of profiling, but... ➔Profiling is not a tablestakes feature, at least not on day 1. ➔Don’t want our users to disable it! ➔Profiling is potentially more expensive than transformation.
  • 24.
    Profiling at Scale ➔Large data volume ➔Long running times ➔Memory constraints
  • 25.
    Performance vs. Accuracy ➔Approximationbrings performance gains while still meeting profiler summarization requirements. ➔Off-the-shelf libraries (count-min-sketch, T-digest) great for approximating counts and non-distributive stats. ➔Not a silver bullet though...sometimes approximations are confusing.
  • 26.
    Flexible Job Generation ➔Profilefor all users, all use cases: not a one-off ➔Diverse schemas ➔Any number of columns ➔ Calculate statistics for all data types ➔Numeric vs. categorical ➔Container types (maps, arrays,...) ➔User-defined
  • 27.
    Flexible Job Generation ➔Profilefor all users, all use cases: not a one-off ➔Diverse schemas ➔Any number of columns ➔ Calculate statistics for all data types ➔Numeric vs. categorical ➔Container types (maps, arrays,...) ➔User-defined
  • 28.
    Transformation vs. Profiling ➔Transformation is primarily row-based. ➔ Profiling is column-based. ➔ Different execution concerns.
  • 29.
    Solution: Spark inthe Trifacta System
  • 30.
    Why Spark ➔ Effectiveat OLAP ➔ Flexible enough for UDFs ➔ Not tied to distributions ➔ Mass adoption ➔ Low latency
  • 31.
    Spark Profile JobsServer UI Webapp Batch Server Profiler Service Client Server Cluster HDFS ➔ We built a Spark job server ➔ Automatically profiles output of transform jobs ➔ Outputs profiling results to HDFS ➔ Renders graphs in Trifacta product Batch ServerBatSBatS Workers
  • 32.
    Profiler Service ➔Which columns to profile and their types ➔ Uses Trifacta type system, eg: ➔Dates ➔Geography ➔User-defined ➔Requested profiling statistics ➔Histograms ➔Outliers ➔Empty, invalid, valid ➔ Extensible ➔Pairwise statistics ➔User-defined functions Profiler Service JSON Specification Wrangled Data
  • 33.
    { “input”: “hdfs://hadoop.trifacta-dev.net:8020:/trifacta…”, “schema”: { “order”:[“column1”, “column2”, “column3”], “types”: { “column1”: [“Datetime”, {“regexes”: , “groupLocs”: {...}}], “column2”: [...], “column3”: [...] } }, “commands”: [ { “column”: “*”, “output”: “hdfs://hadoop.trifacta-dev.net:8020:/trifacta…”, “profiler-type”: “histogram”, “params”: {...} }, { “column”: “column1”, “output”: “hdfs://hadoop.trifacta-dev.net:8020:/trifacta…”, “profiler-type”: “type-check”, “params”: {...} } ] } Profiling DSL
  • 34.
    { “input”: “hdfs://hadoop.trifacta-dev.net:8020:/trifacta…”, “schema”: { “order”:[“column1”, “column2”, “column3”], “types”: { “column1”: [“Datetime”, {“regexes”: , “groupLocs”: {...}}], “column2”: [...], “column3”: [...] } }, “commands”: [ { “column”: “*”, “output”: “hdfs://hadoop.trifacta-dev.net:8020:/trifacta…”, “profiler-type”: “histogram”, “params”: {...} }, { “column”: “column1”, “output”: “hdfs://hadoop.trifacta-dev.net:8020:/trifacta…”, “profiler-type”: “type-check”, “params”: {...} } ] } Profiling DSL
  • 35.
    { “input”: “hdfs://hadoop.trifacta-dev.net:8020:/trifacta…”, “schema”: { “order”:[“column1”, “column2”, “column3”], “types”: { “column1”: [“Datetime”, {“regexes”: , “groupLocs”: {...}}], “column2”: [...], “column3”: [...] } }, “commands”: [ { “column”: “*”, “output”: “hdfs://hadoop.trifacta-dev.net:8020:/trifacta…”, “profiler-type”: “histogram”, “params”: {...} }, { “column”: “column1”, “output”: “hdfs://hadoop.trifacta-dev.net:8020:/trifacta…”, “profiler-type”: “type-check”, “params”: {...} } ] } Profiling DSL
  • 36.
    { “input”: “hdfs://hadoop.trifacta-dev.net:8020:/trifacta…”, “schema”: { “order”:[“column1”, “column2”, “column3”], “types”: { “column1”: [“Datetime”, {“regexes”: , “groupLocs”: {...}}], “column2”: [...], “column3”: [...] } }, “commands”: [ { “column”: “*”, “output”: “hdfs://hadoop.trifacta-dev.net:8020:/trifacta…”, “profiler-type”: “histogram”, “params”: {...} }, { “column”: “column1”, “output”: “hdfs://hadoop.trifacta-dev.net:8020:/trifacta…”, “profiler-type”: “type-check”, “params”: {...} } ] } Profiling DSL
  • 37.
    Performance Improvements ➔ Afew troublesome use cases: ➔High cardinality ➔Non-distributive stats ➔ Huge gains for large numbers of columns Few Columns Many Columns High Cardinality 2X 4X Low Cardinality 10X 20X Spark profiling speed-up vs. MapReduce
  • 38.
    Pay-as-you-go Profiling ➔ Usersdo not always need profiles for all columns ➔ More complex and expensive statistics ➔ Drilldown ➔ Iterative exploration
  • 39.
  • 40.