Download as PDF, PPTX
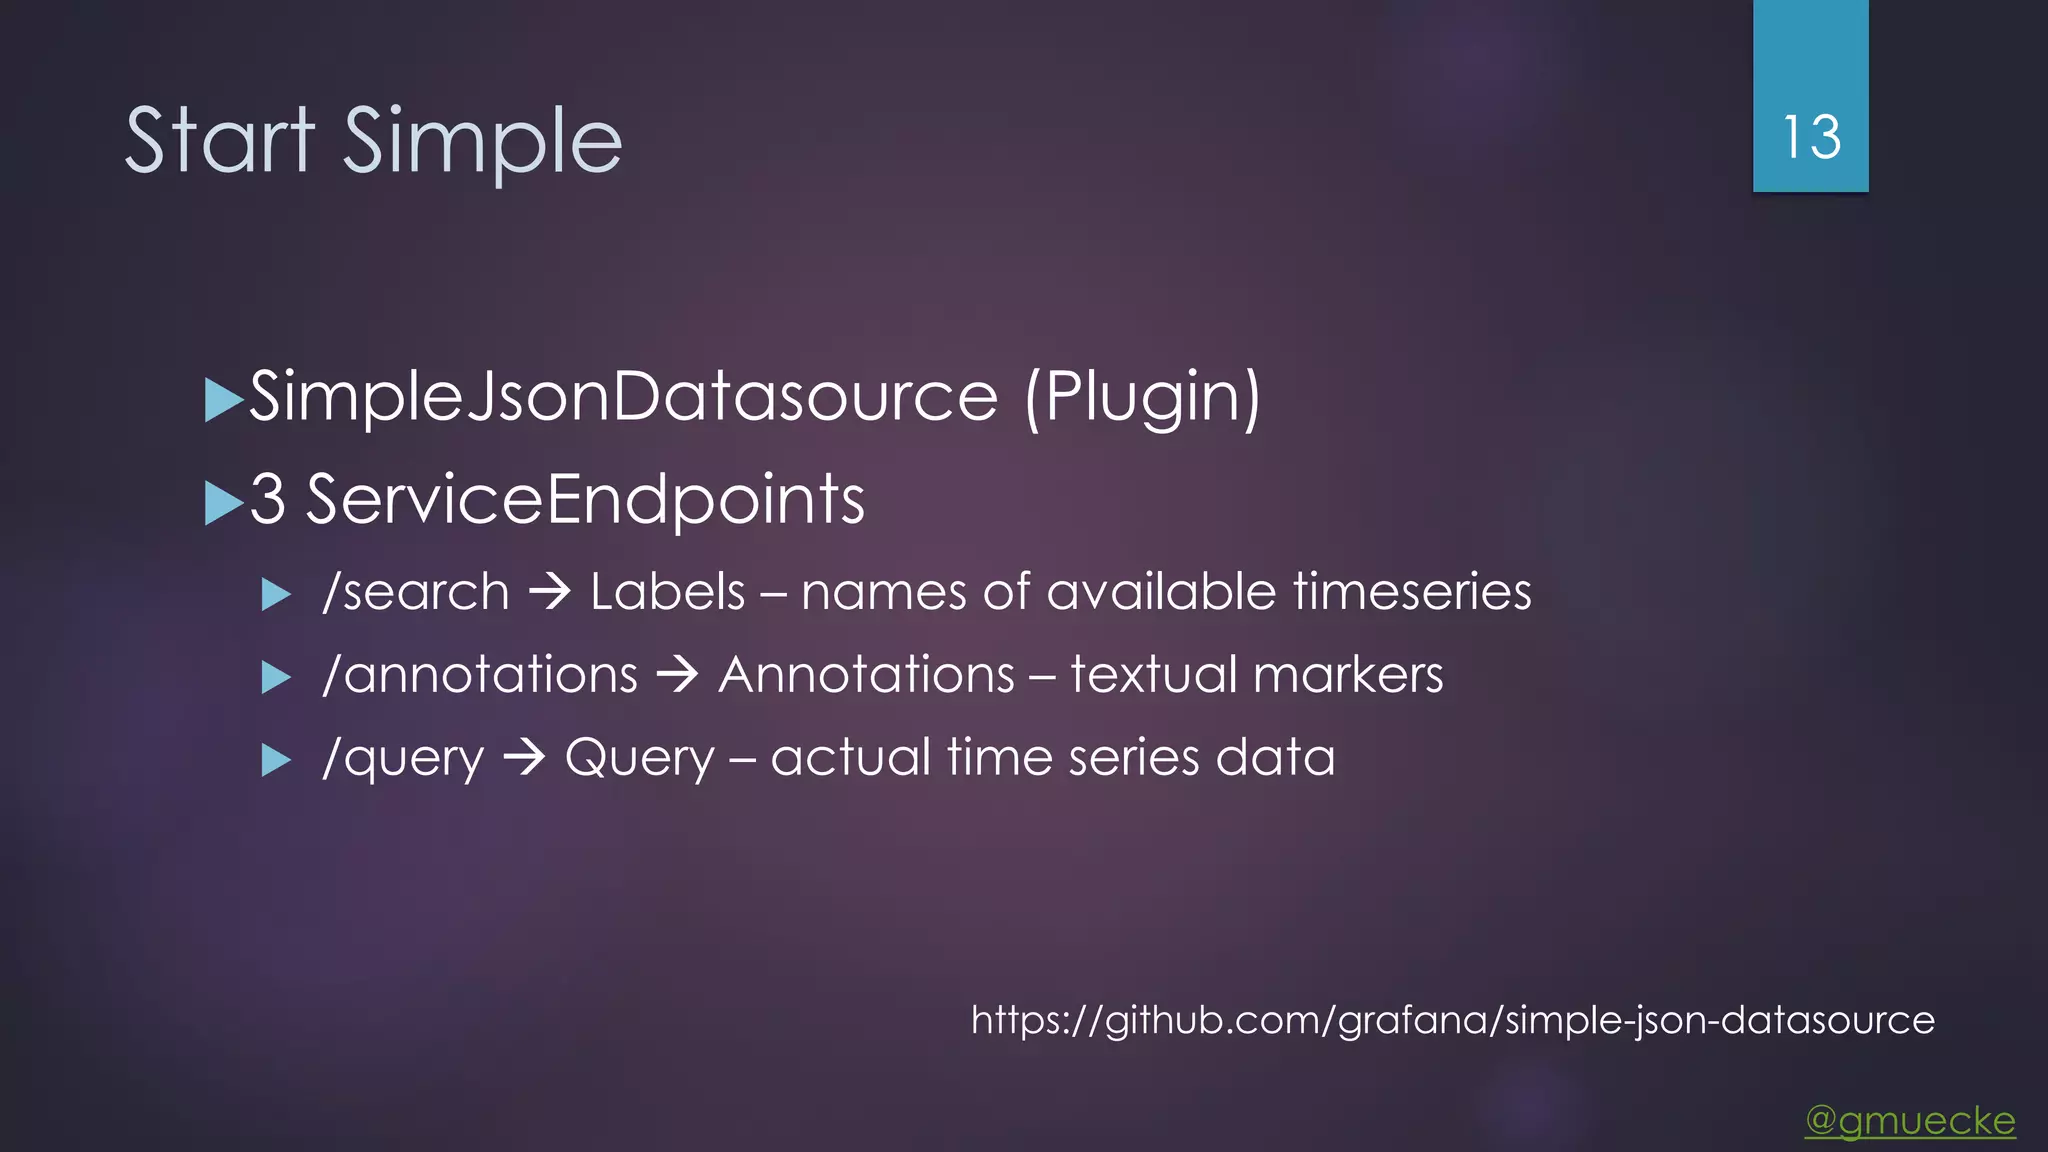
![@gmuecke /search Format Request { "target" : "select metric", "refId" : "E" } Response [ "Metric Name 1", "Metric Name2", ] An array of strings 14](https://image.slidesharecdn.com/reactivedata-analysiswithvert-171205152234/75/Reactive-data-analysis-with-vert-x-14-2048.jpg)
![@gmuecke /annotations Format Request { "annotation" : { "name" : "Test", "iconColor" : "rgba(255, 96, 96, 1)", "datasource" : "Simple Example DS", "enable" : true, "query" : "{"name":"Timeseries A"}" }, "range" : { "from" : "2016-06-13T12:23:47.387Z", "to" : "2016-06-13T12:24:19.217Z" }, "rangeRaw" : { "from" : "2016-06-13T12:23:47.387Z", "to" : "2016-06-13T12:24:19.217Z" } } Response [ { "annotation": { "name": "Test", "iconColor": "rgba(255, 96, 96, 1)", "datasource": "Simple Example DS", "enable": true, "query": "{"name":"Timeseries A"}" }, "time": 1465820629774, "title": "Marker", "tags": [ "Tag 1", "Tag 2" ] } ] 15](https://image.slidesharecdn.com/reactivedata-analysiswithvert-171205152234/75/Reactive-data-analysis-with-vert-x-15-2048.jpg)
![@gmuecke /query Format Request { "panelId" : 1, "maxDataPoints" : 1904, "format" : "json", "range" : { "from" : "2016-06-13T12:23:47.387Z", "to" : "2016-06-13T12:24:19.217Z" }, "rangeRaw" : { "from" : "2016-06-13T12:23:47.387Z", "to" : "2016-06-13T12:24:19.217Z" }, "interval" : "20ms", "targets" : [ { "target" : "Time series A", "refId" : "A" },] } Response [ { "target":"Timeseries A", "datapoints":[ [1936,1465820629774], [2105,1465820632673], [4187,1465820635570], [30001,1465820645243] }, { "target":"Timeseries B", "datapoints":[ ] } ] 16](https://image.slidesharecdn.com/reactivedata-analysiswithvert-171205152234/75/Reactive-data-analysis-with-vert-x-16-2048.jpg)


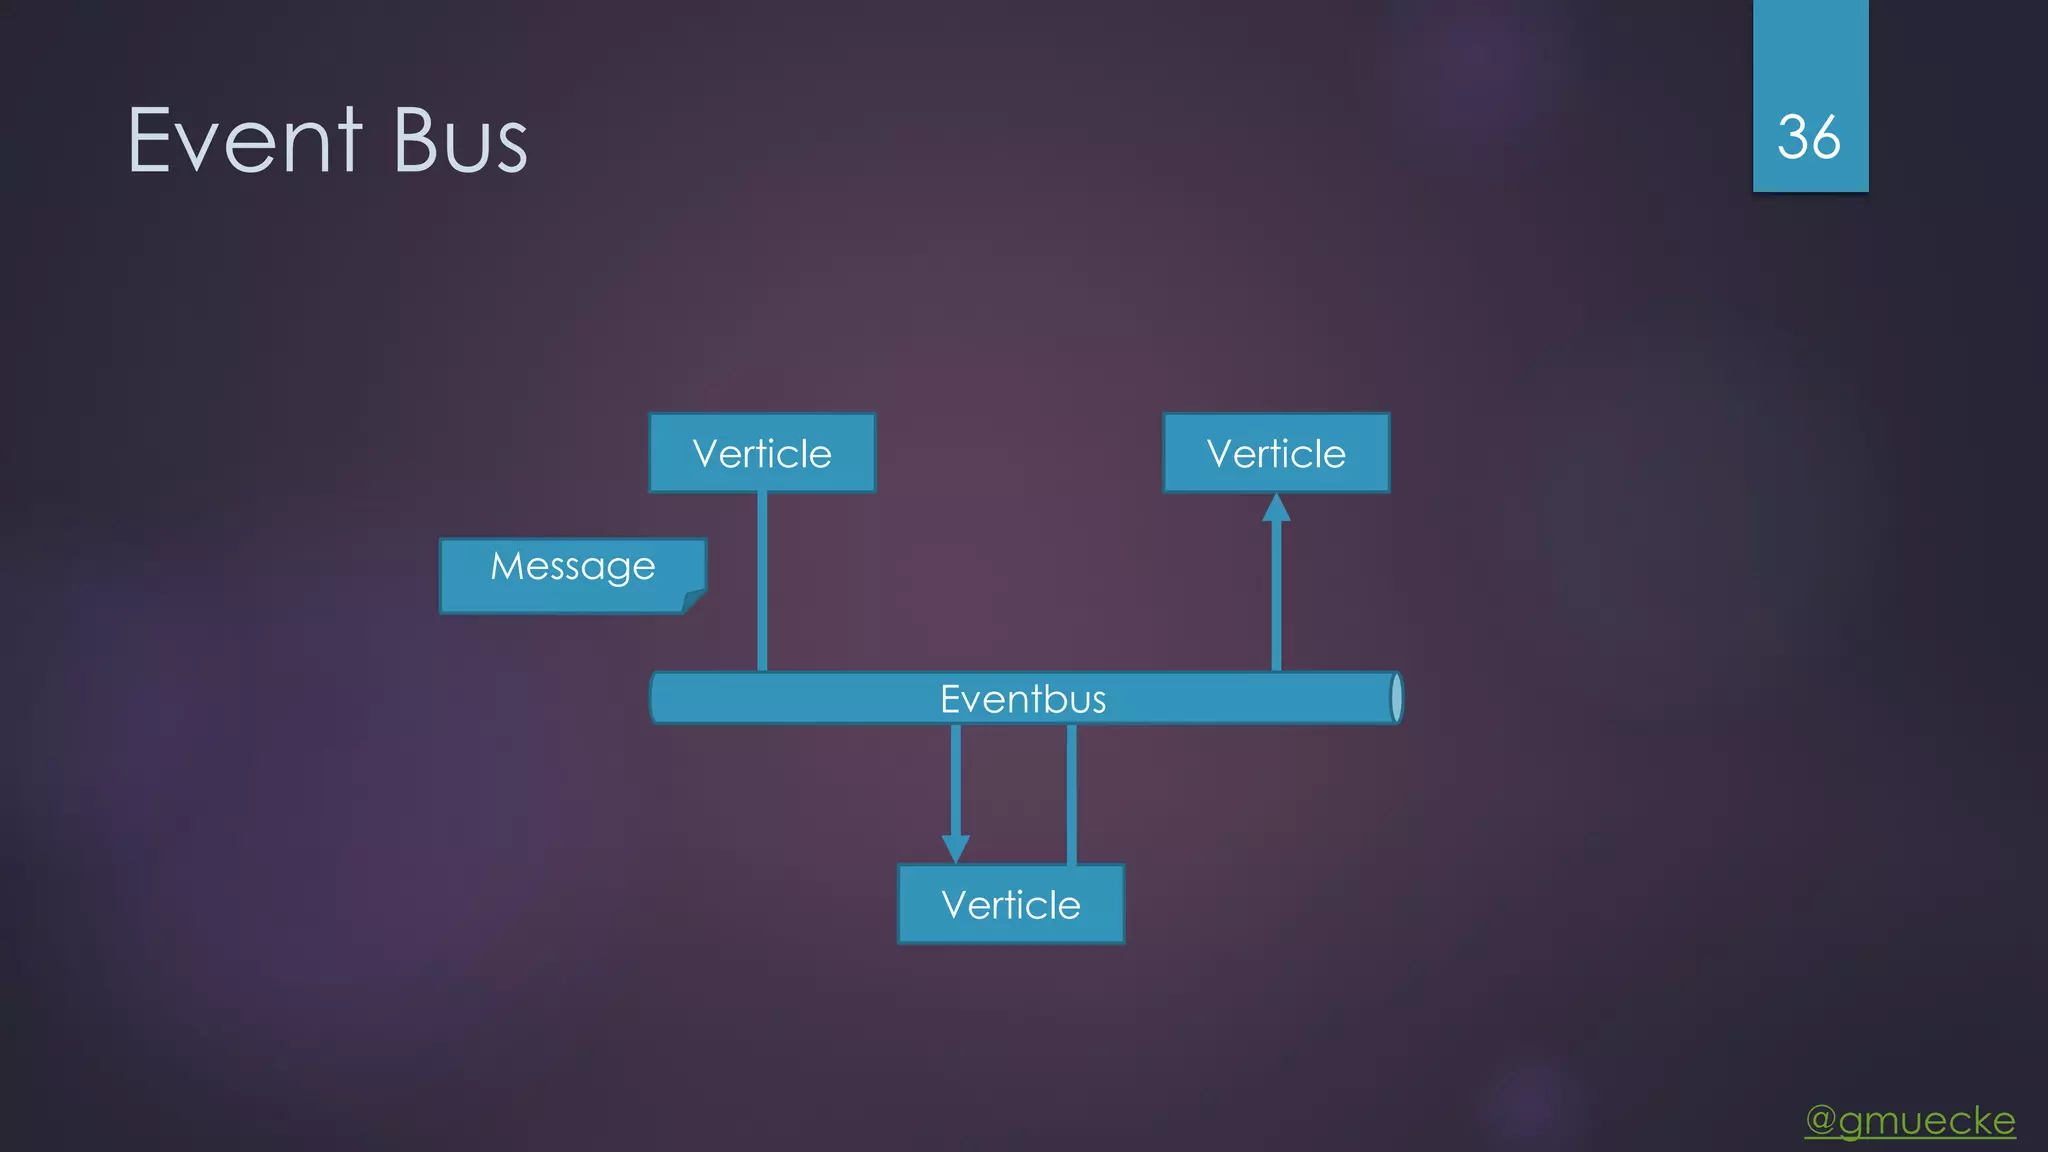

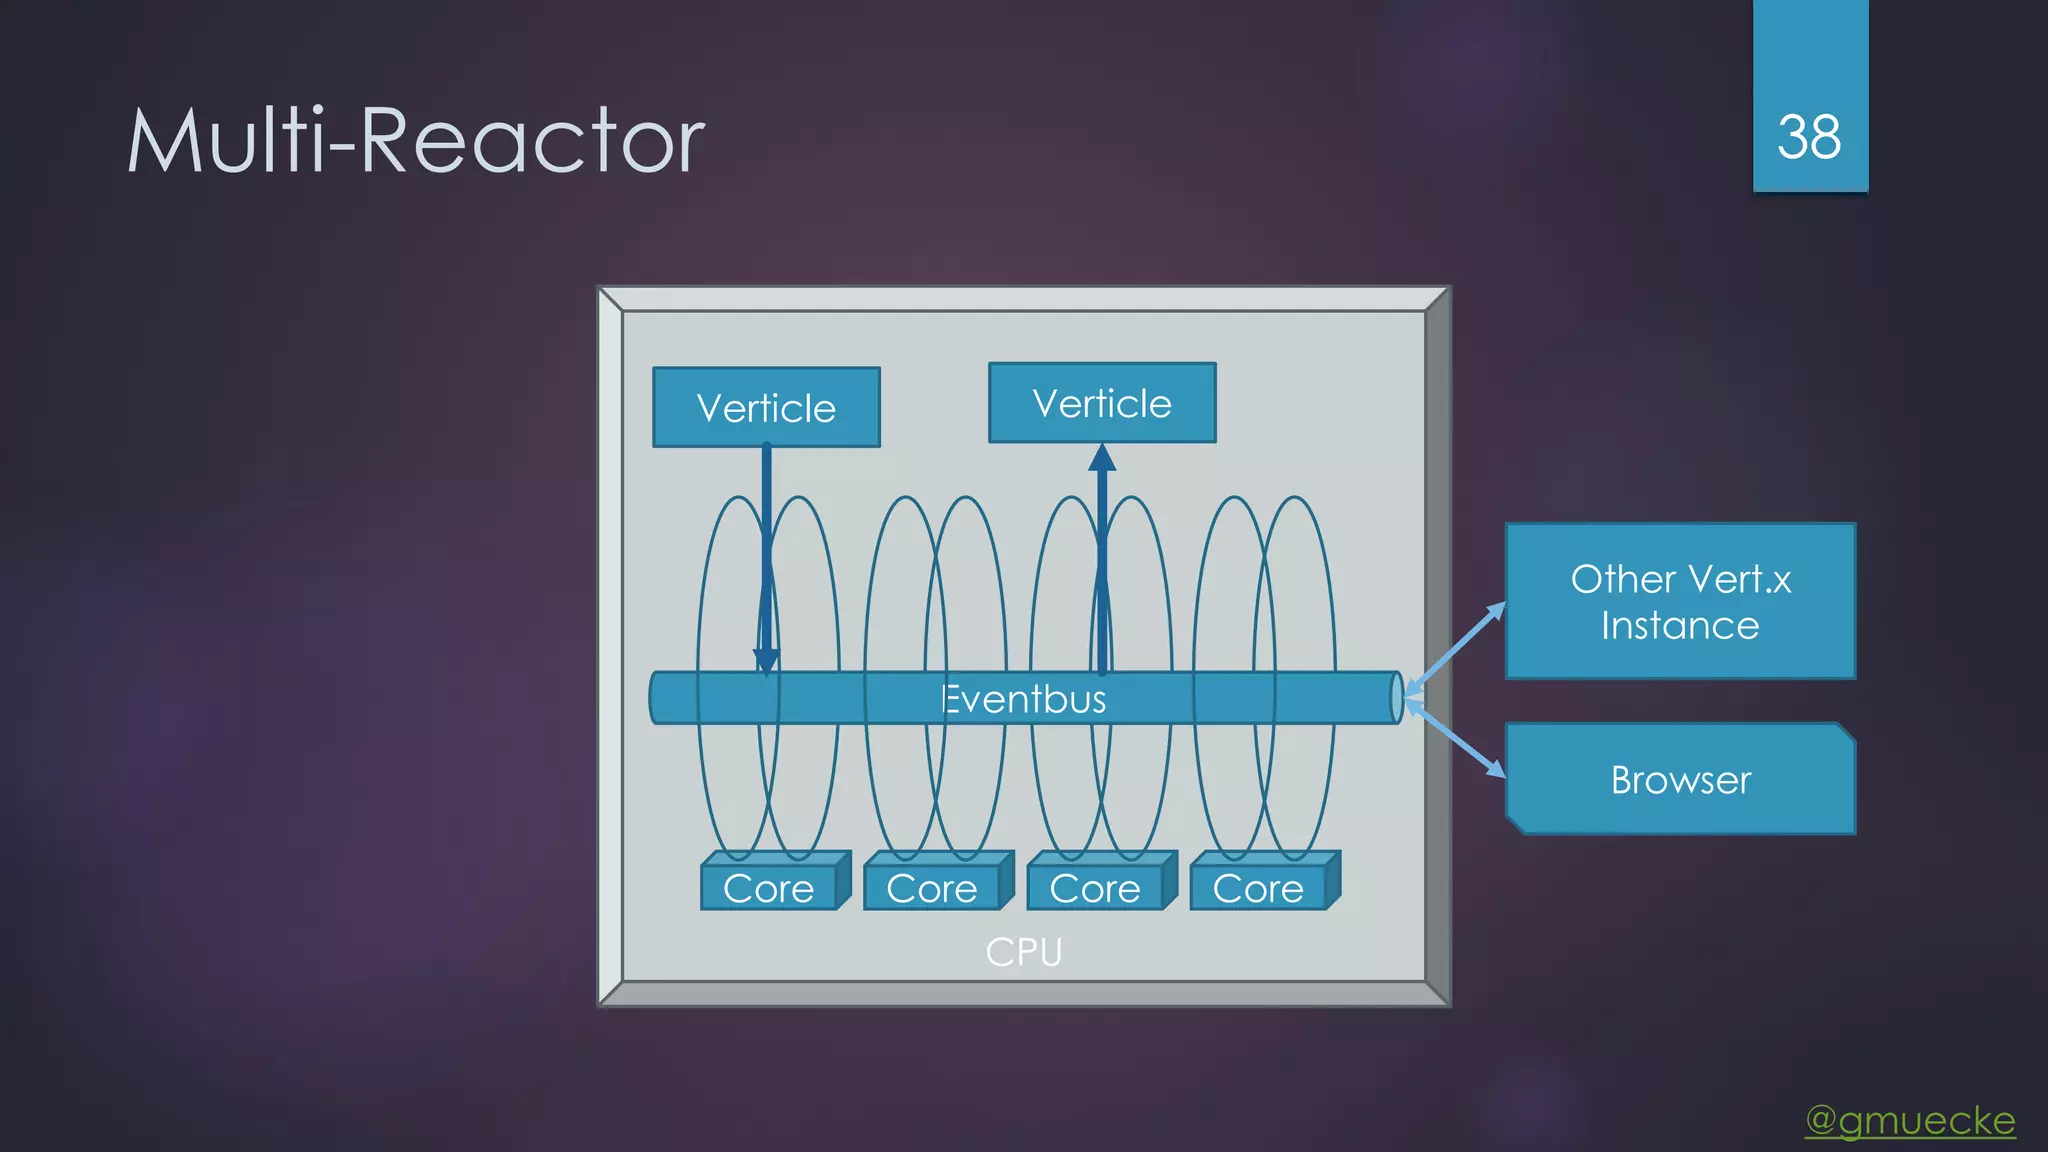
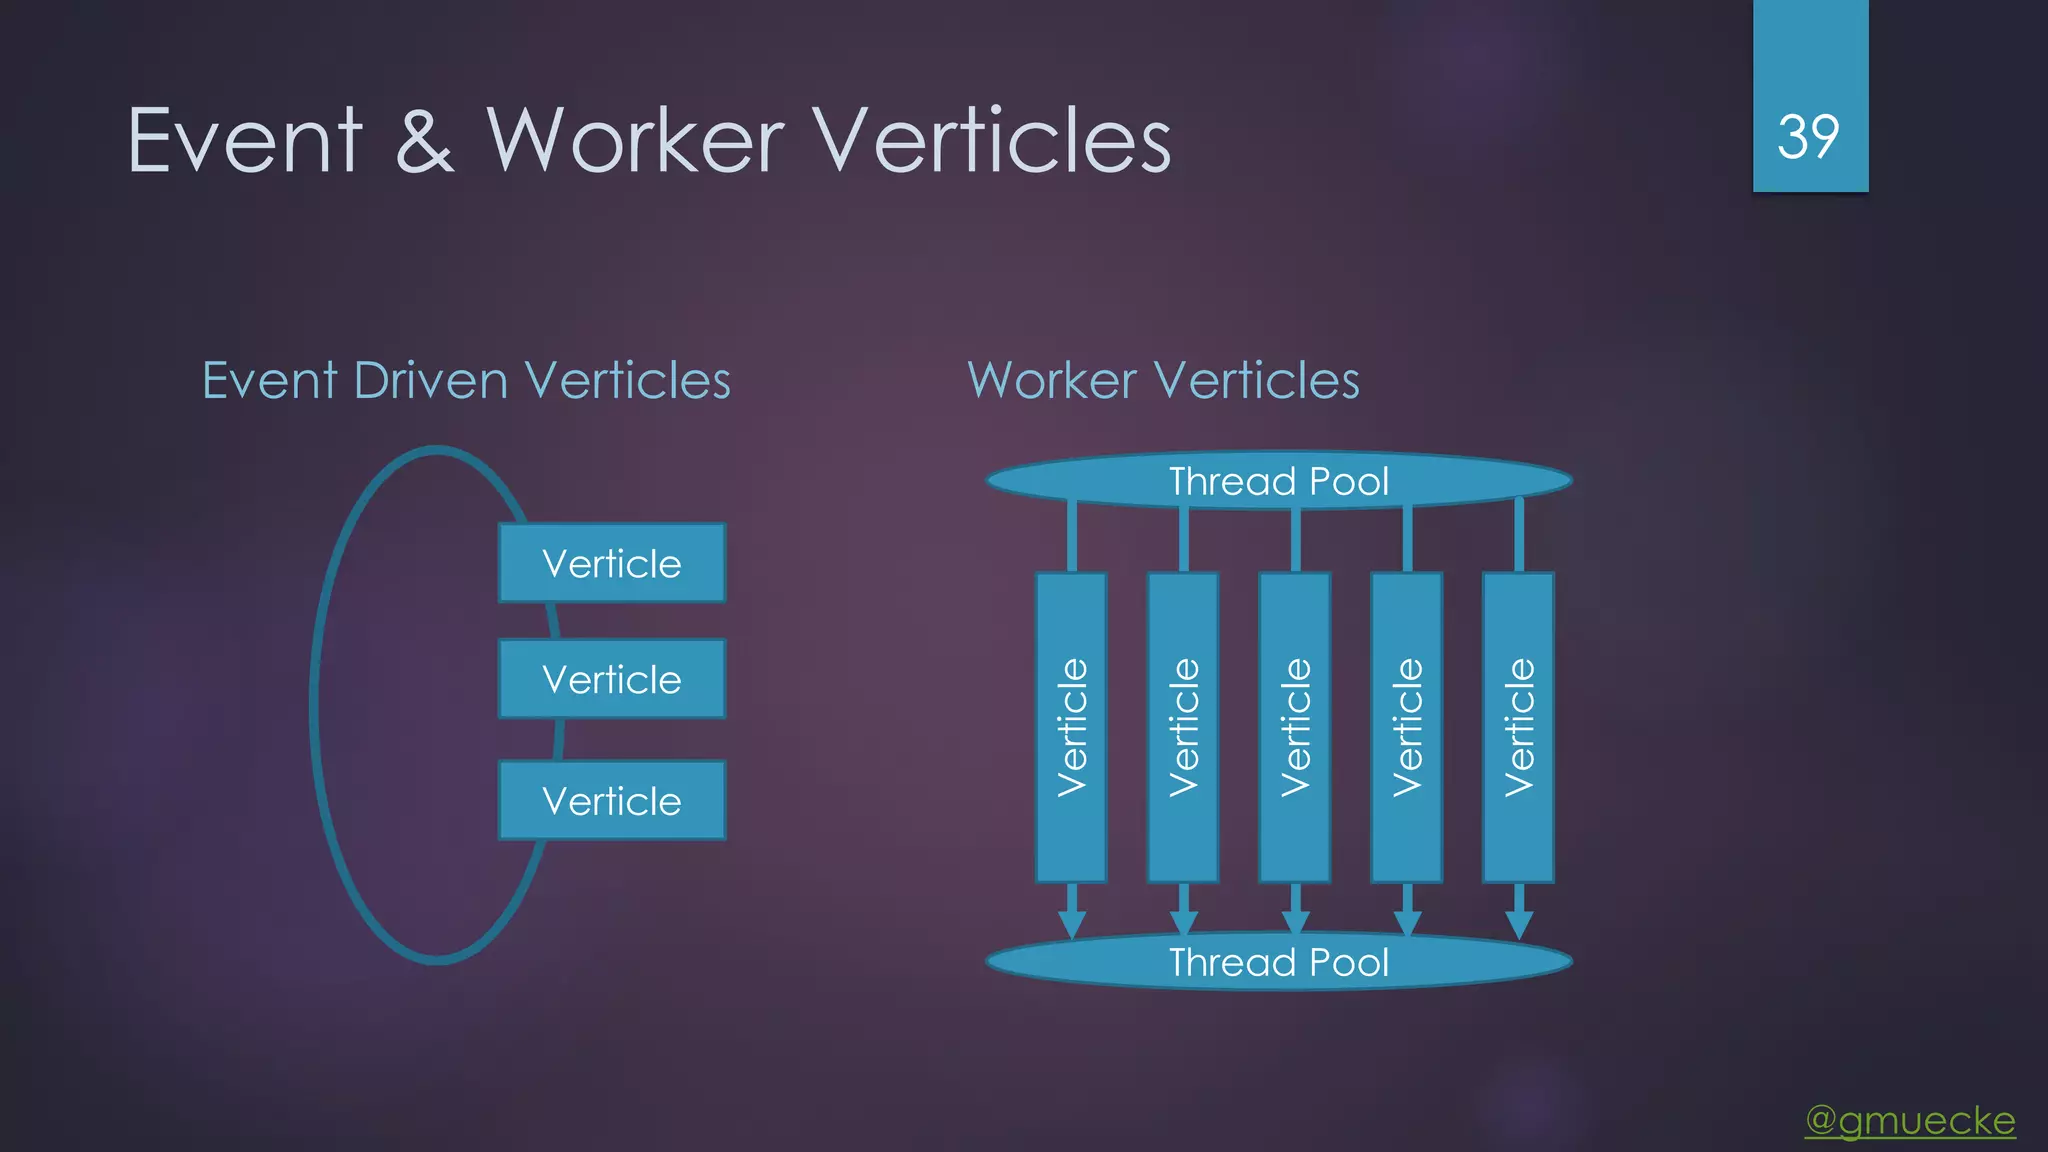

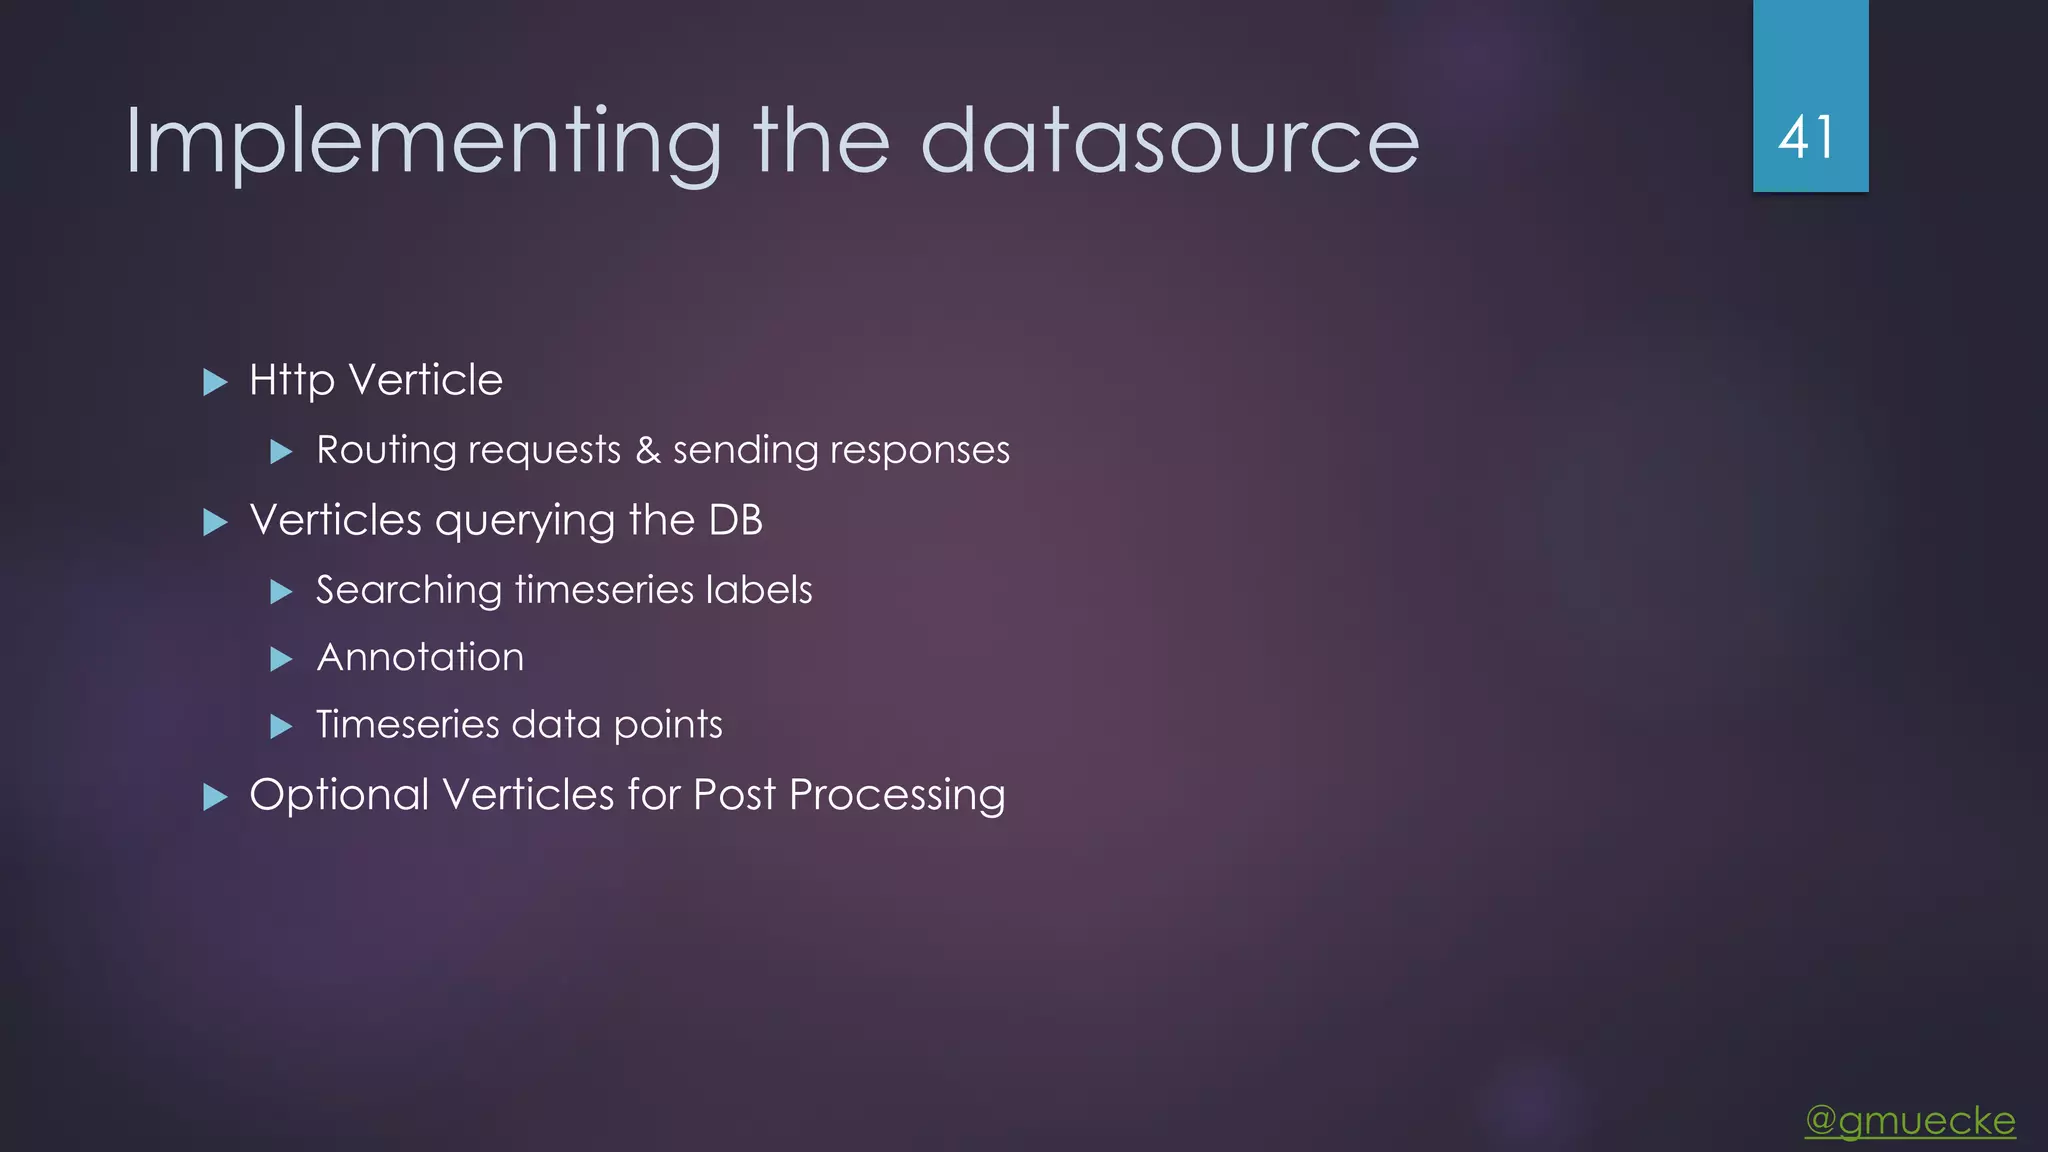
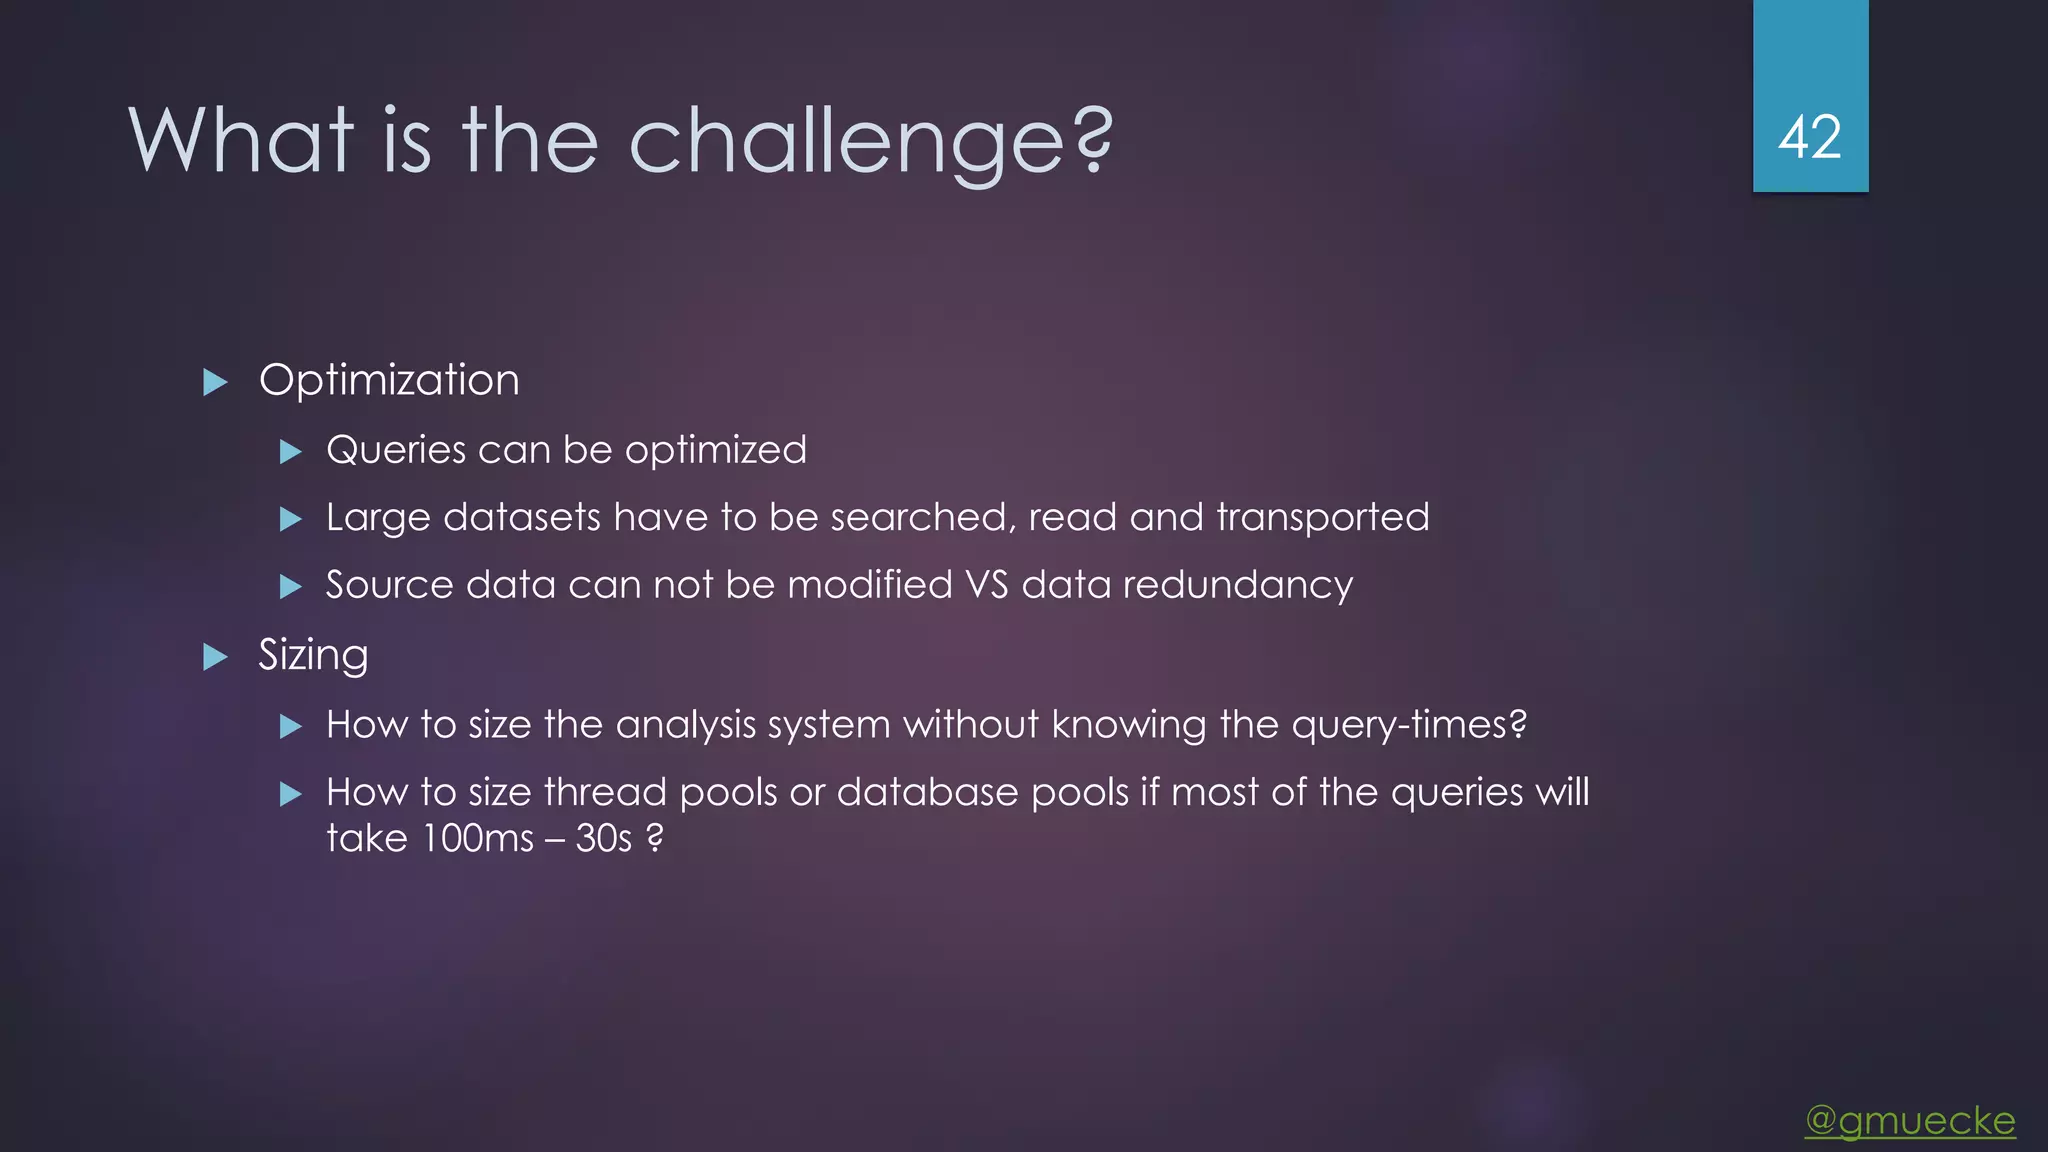
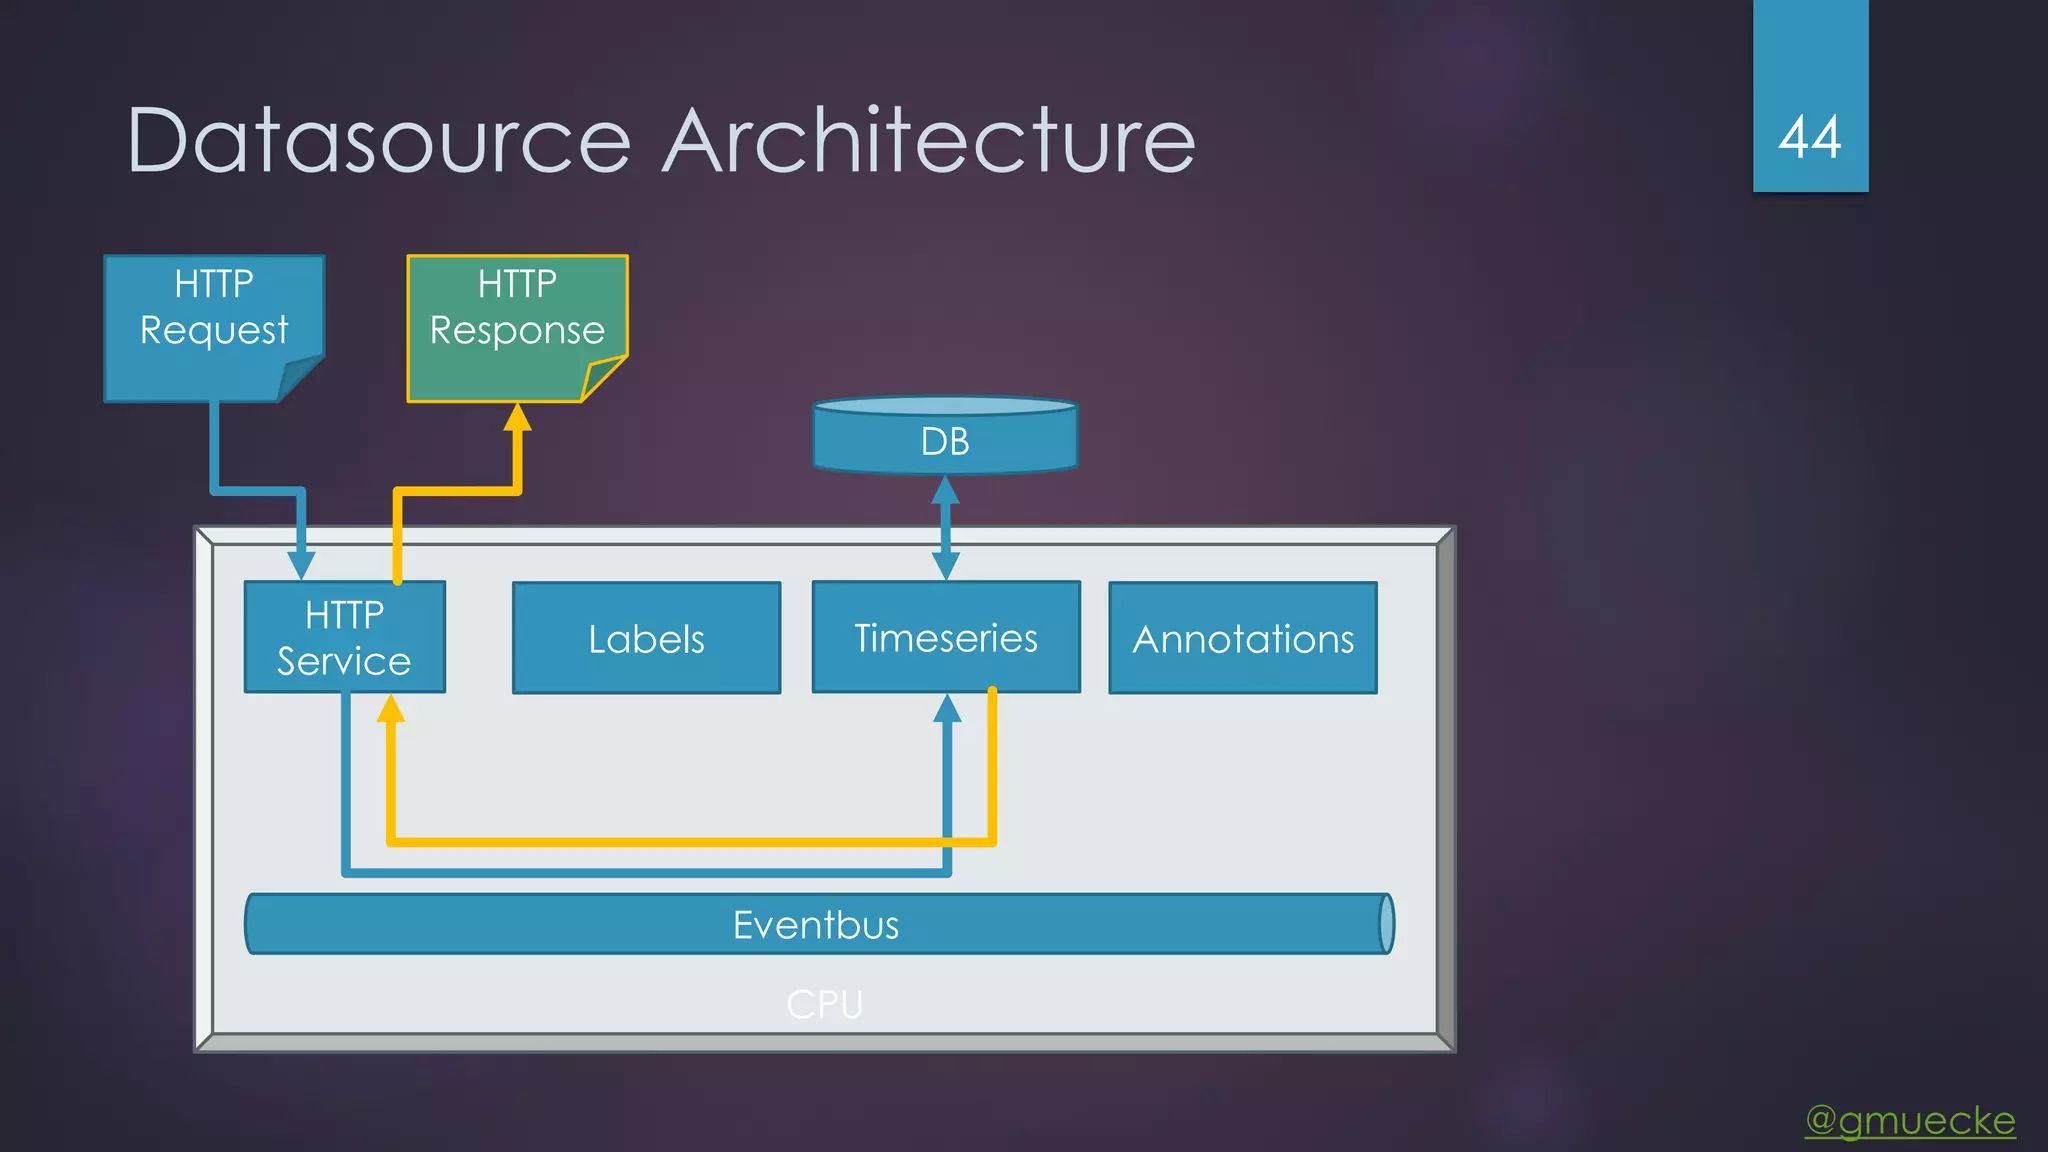

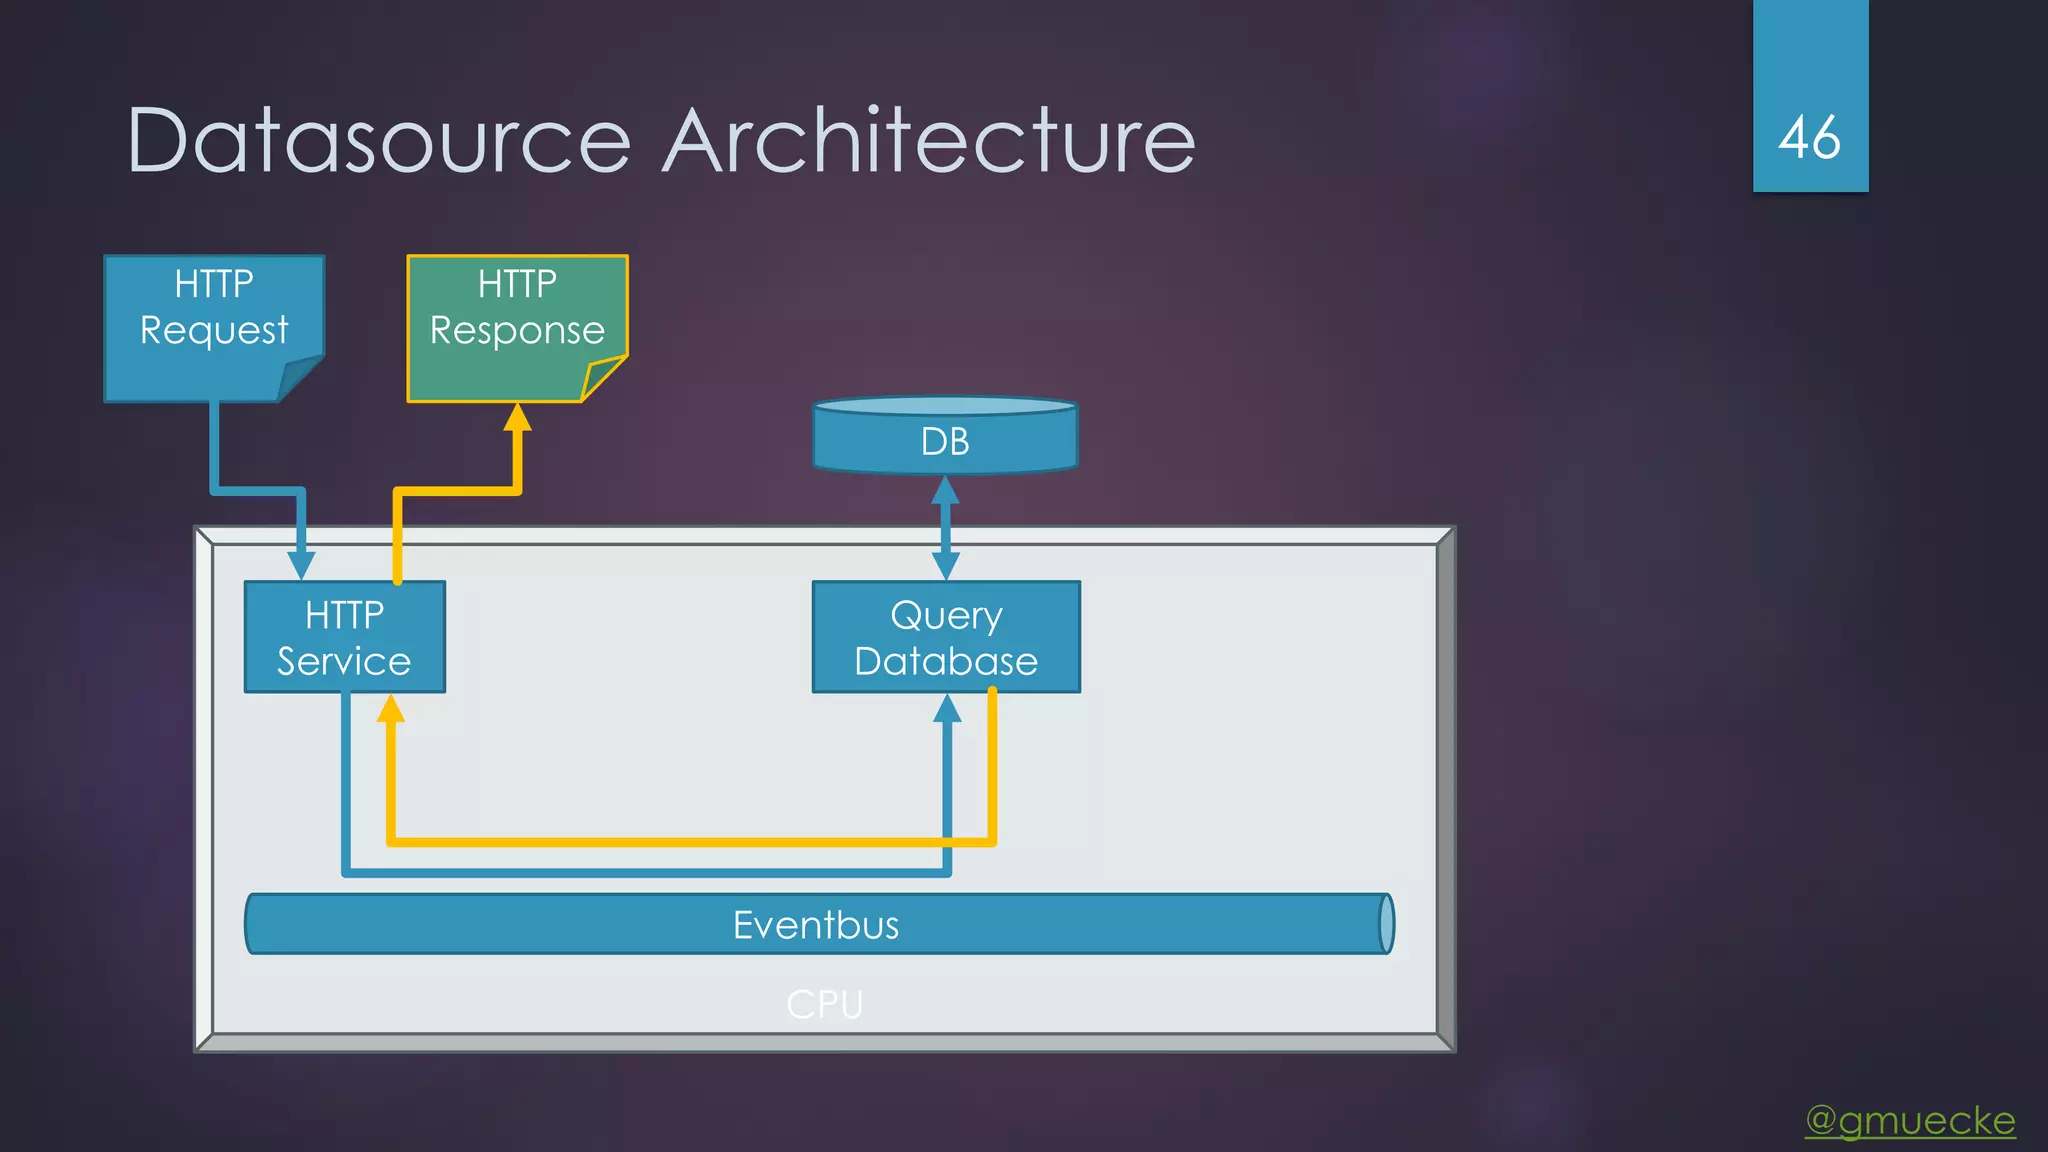
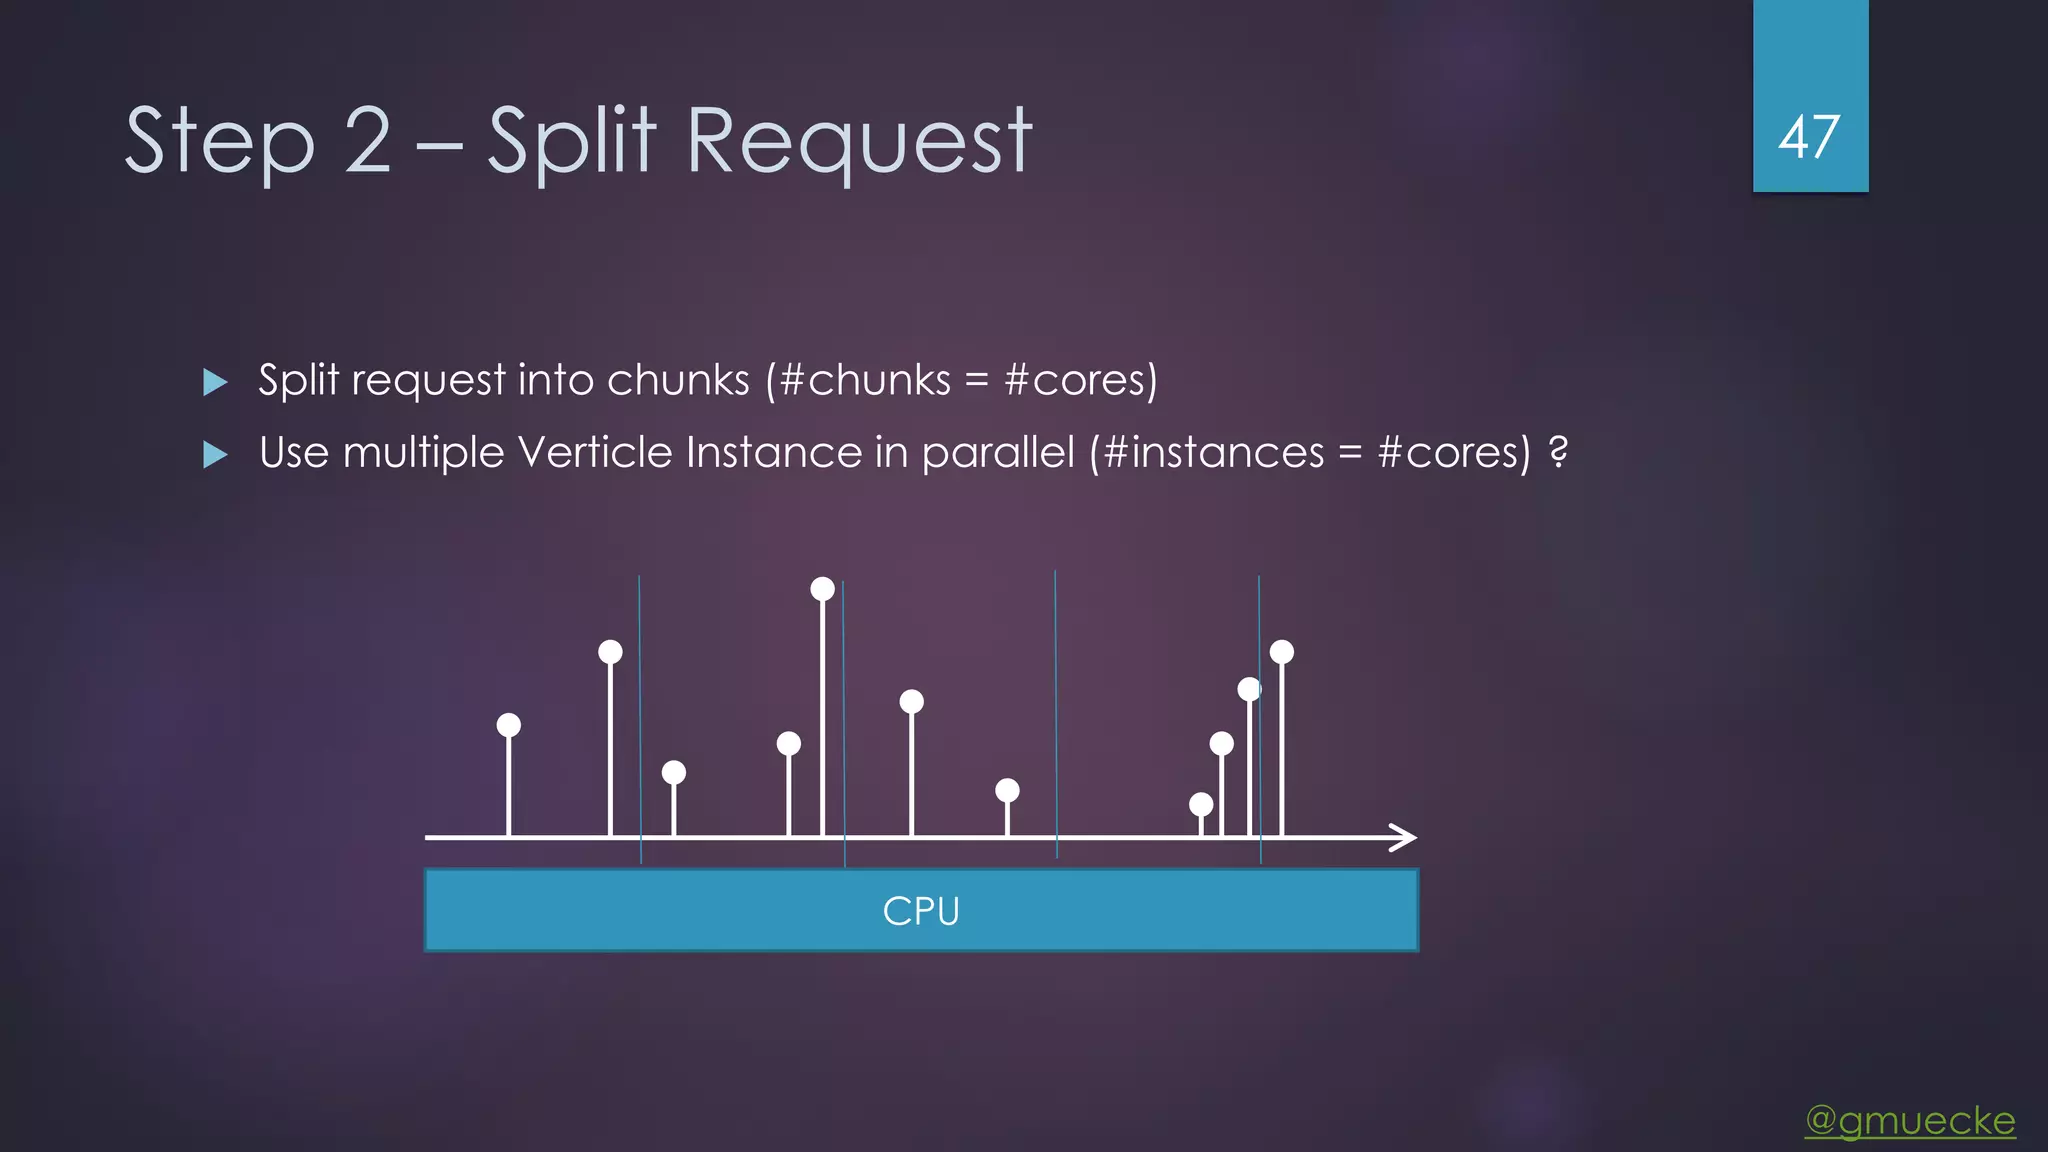
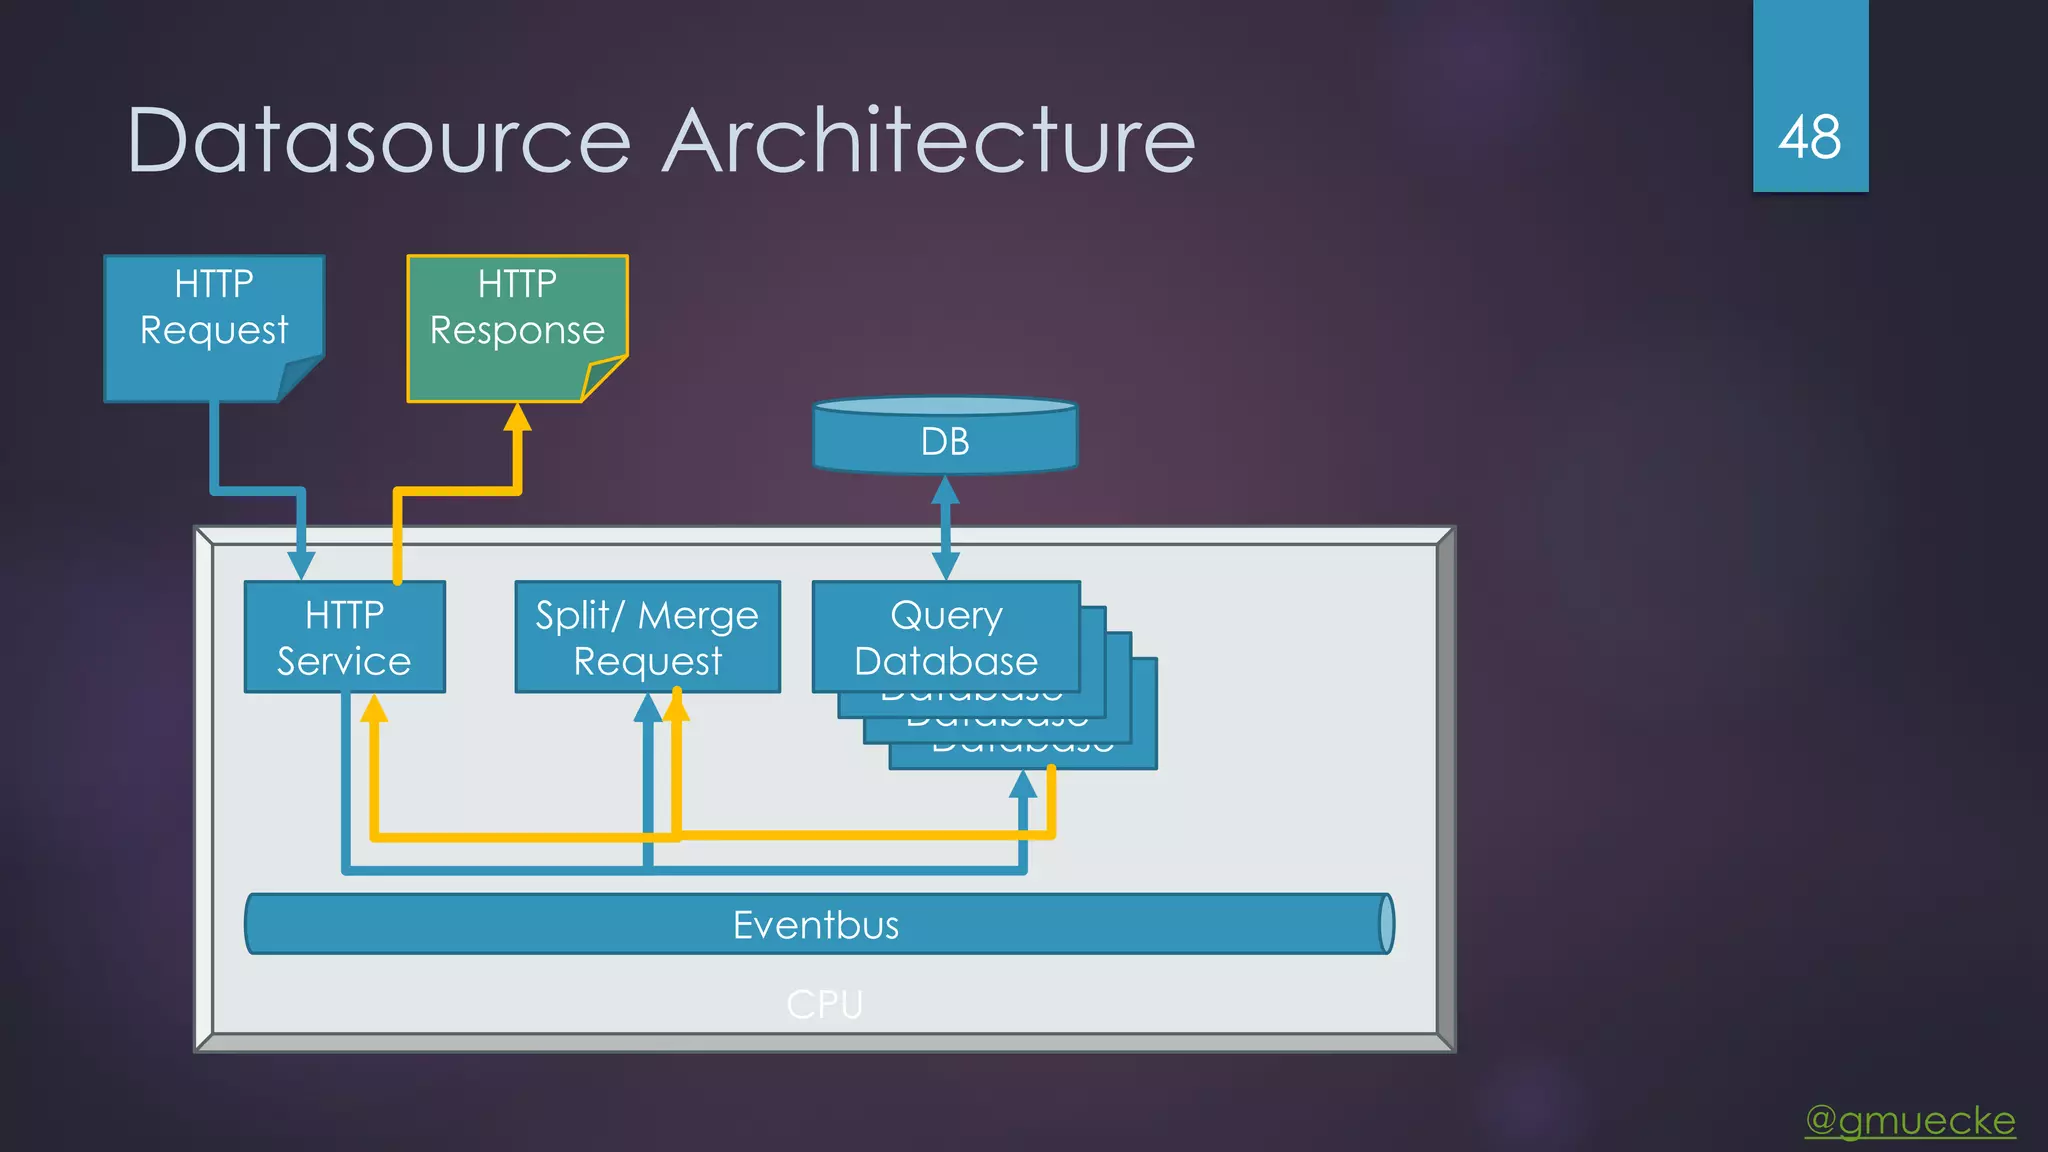
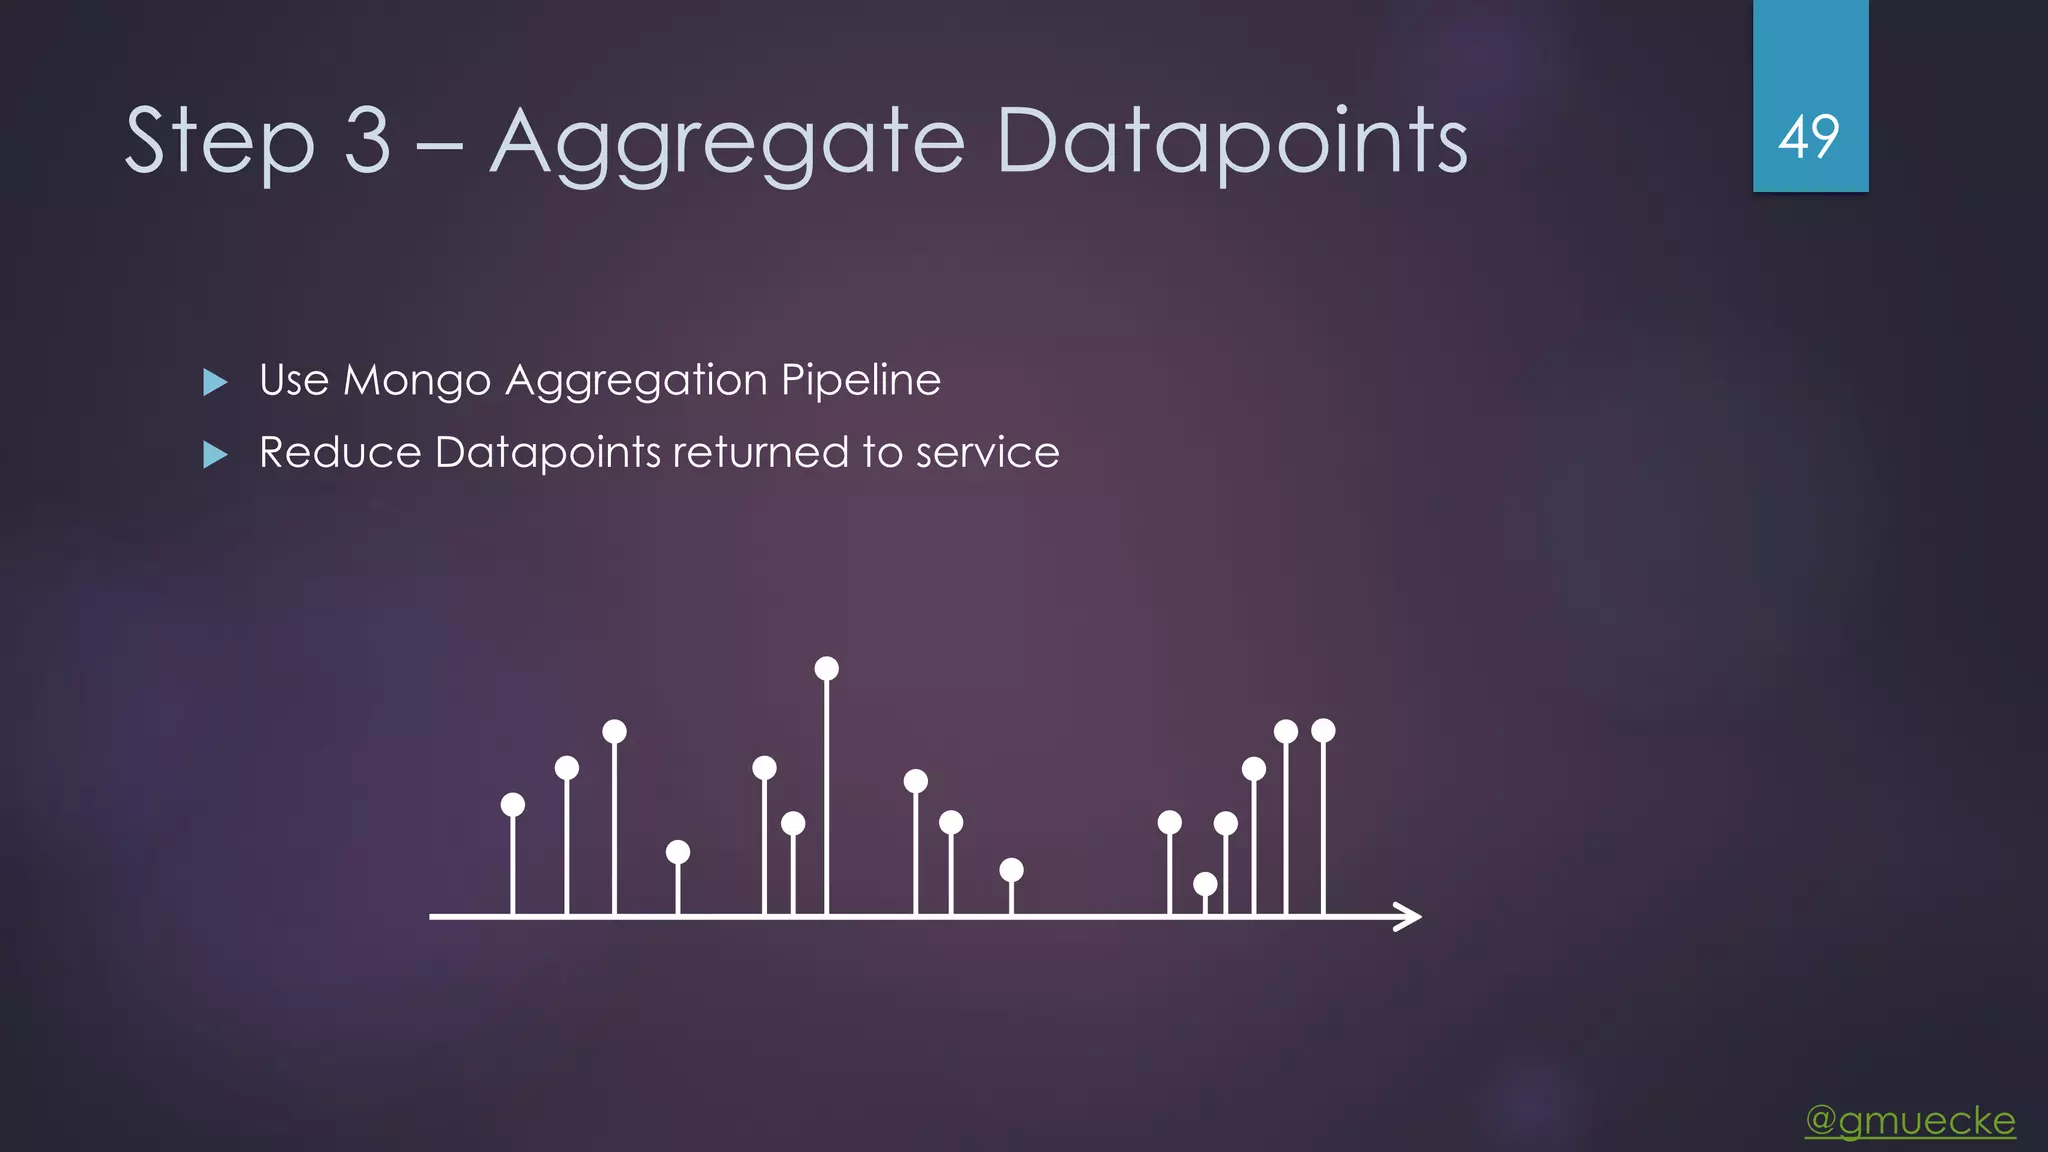
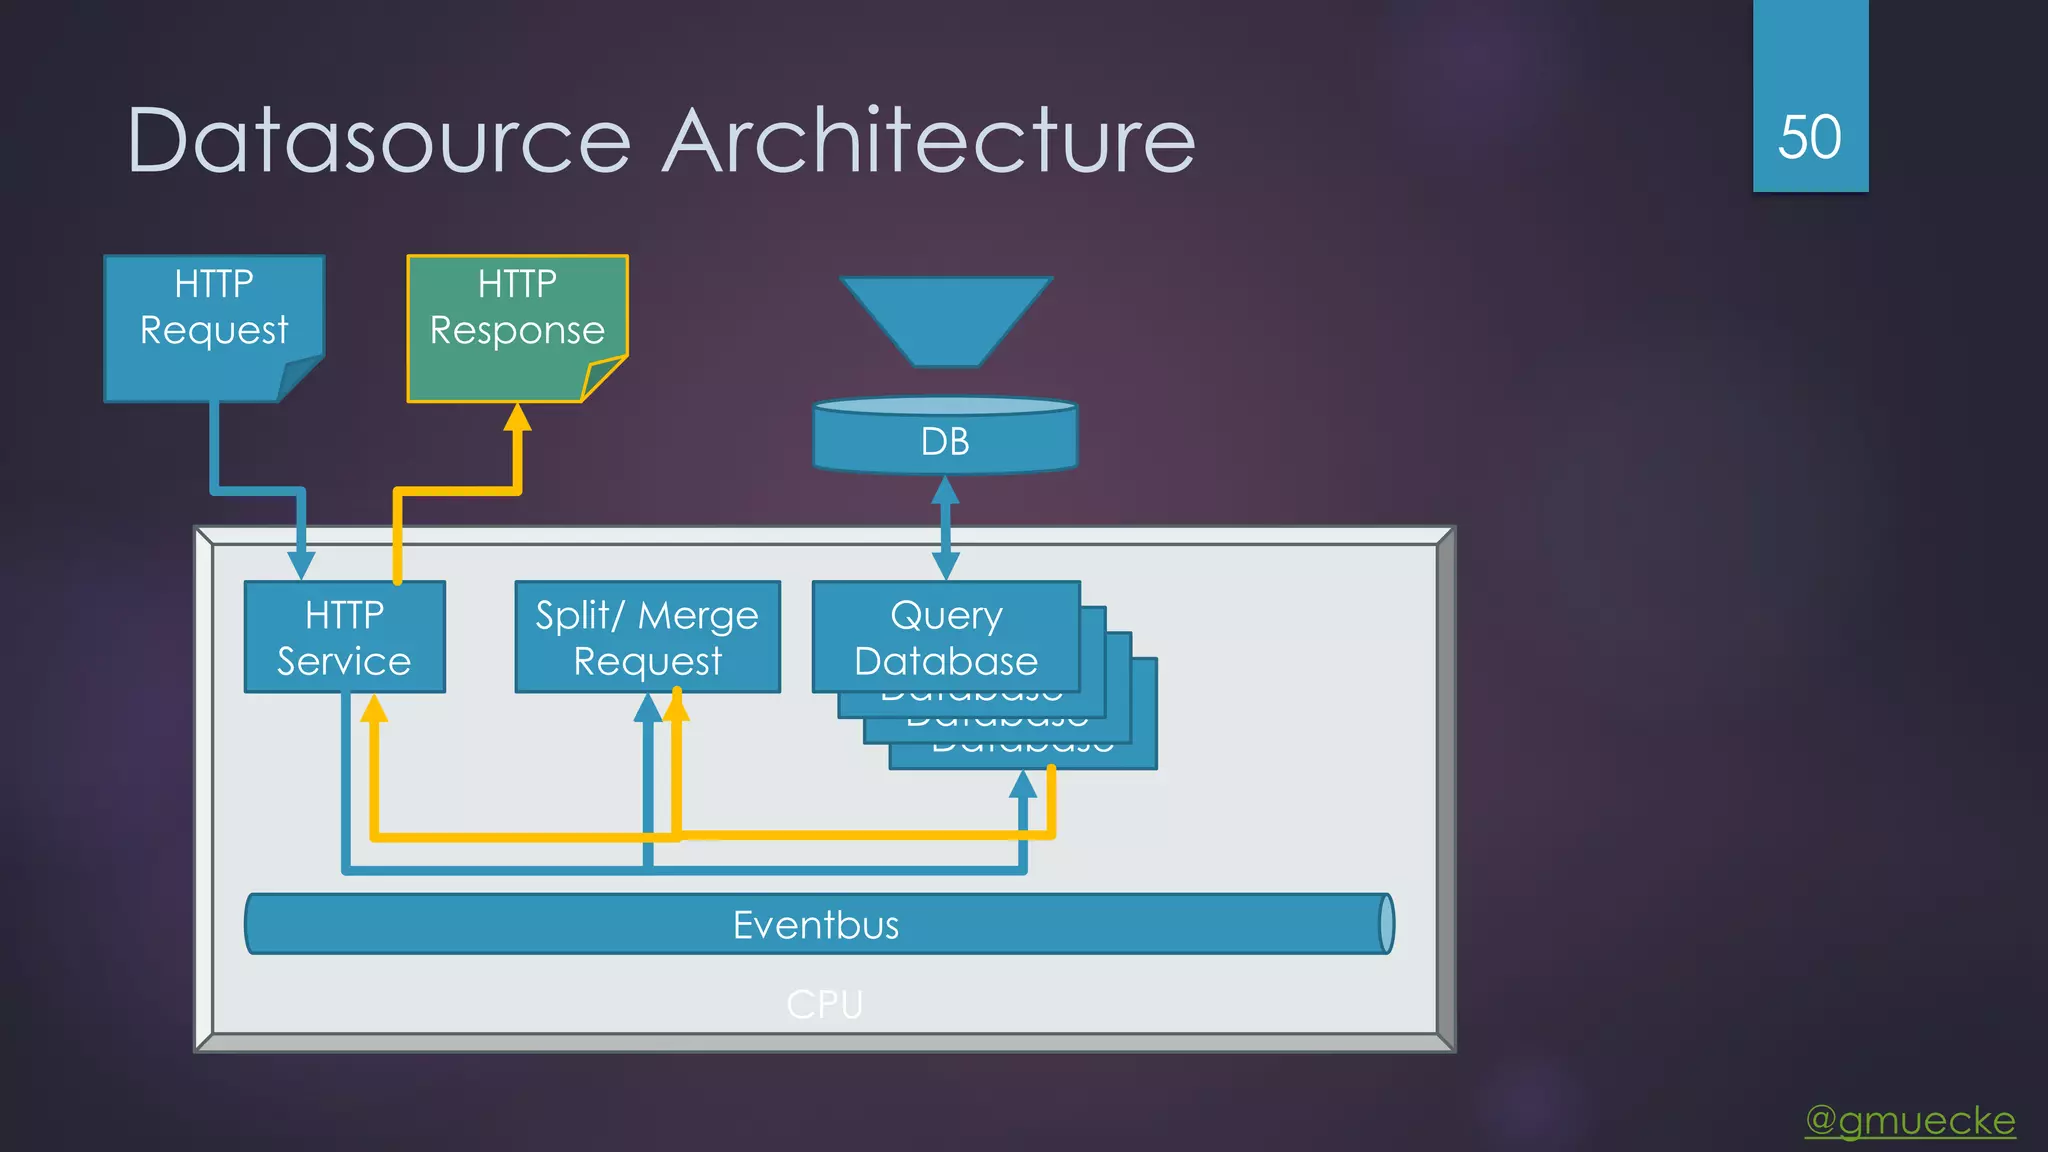
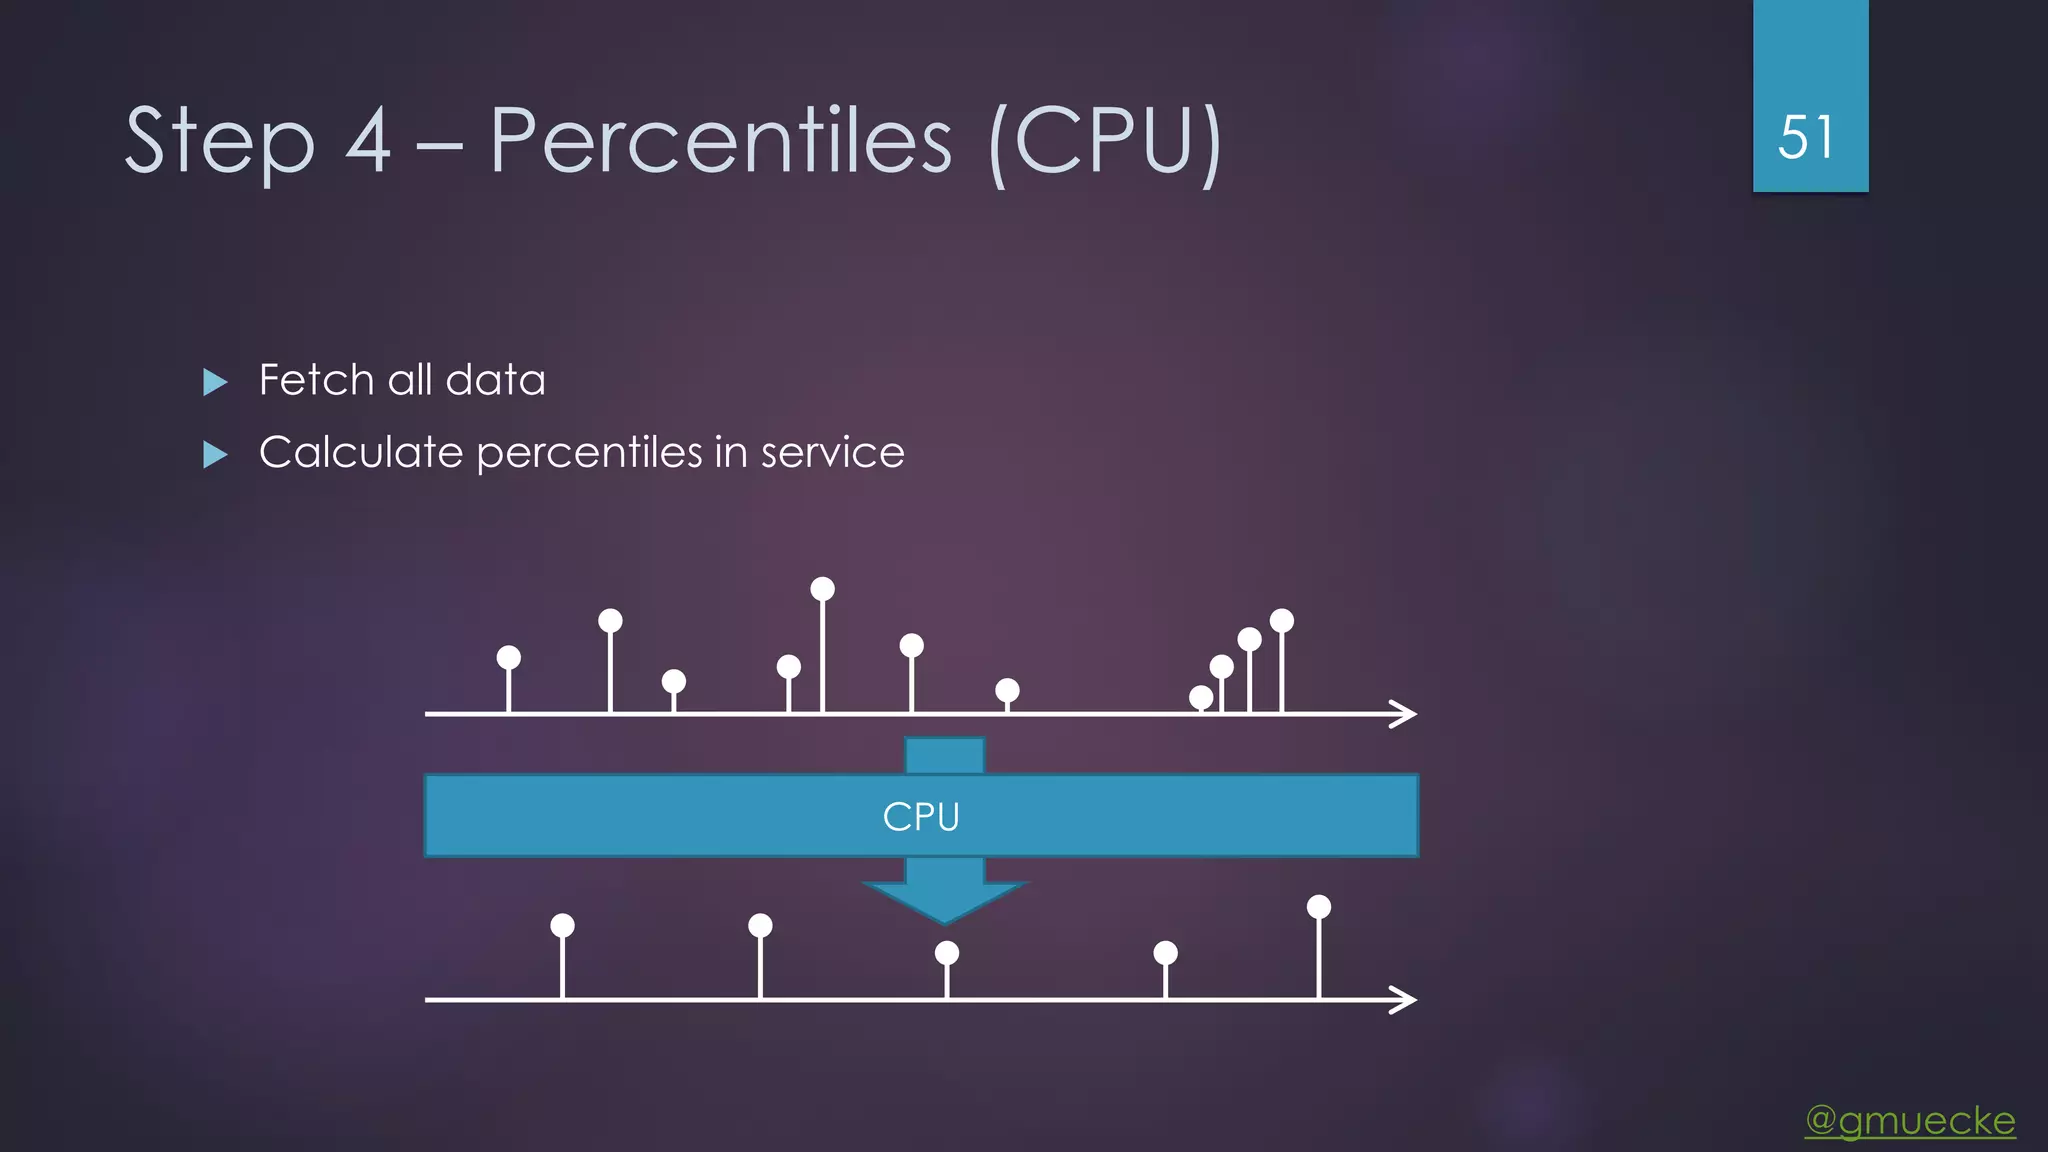
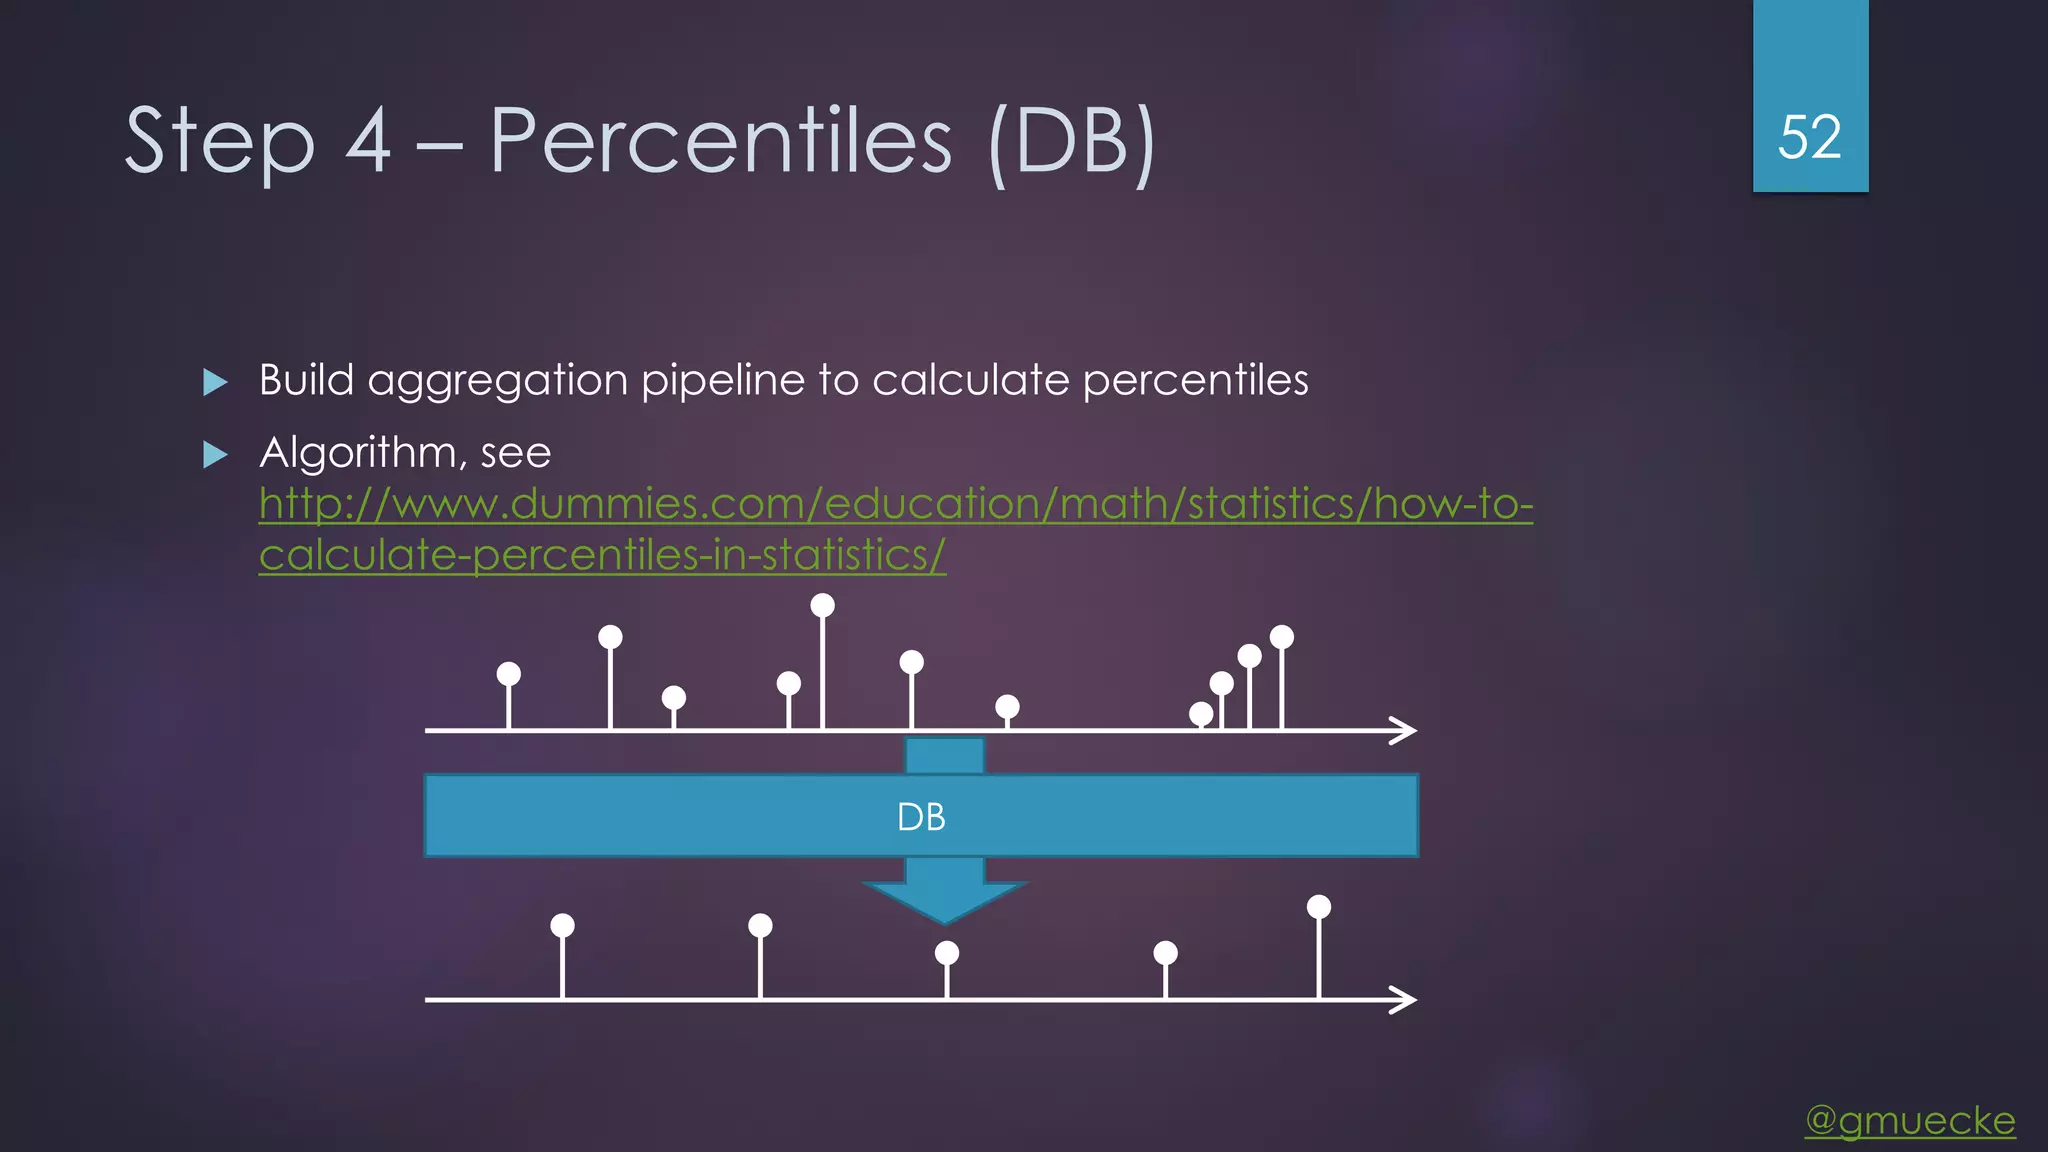

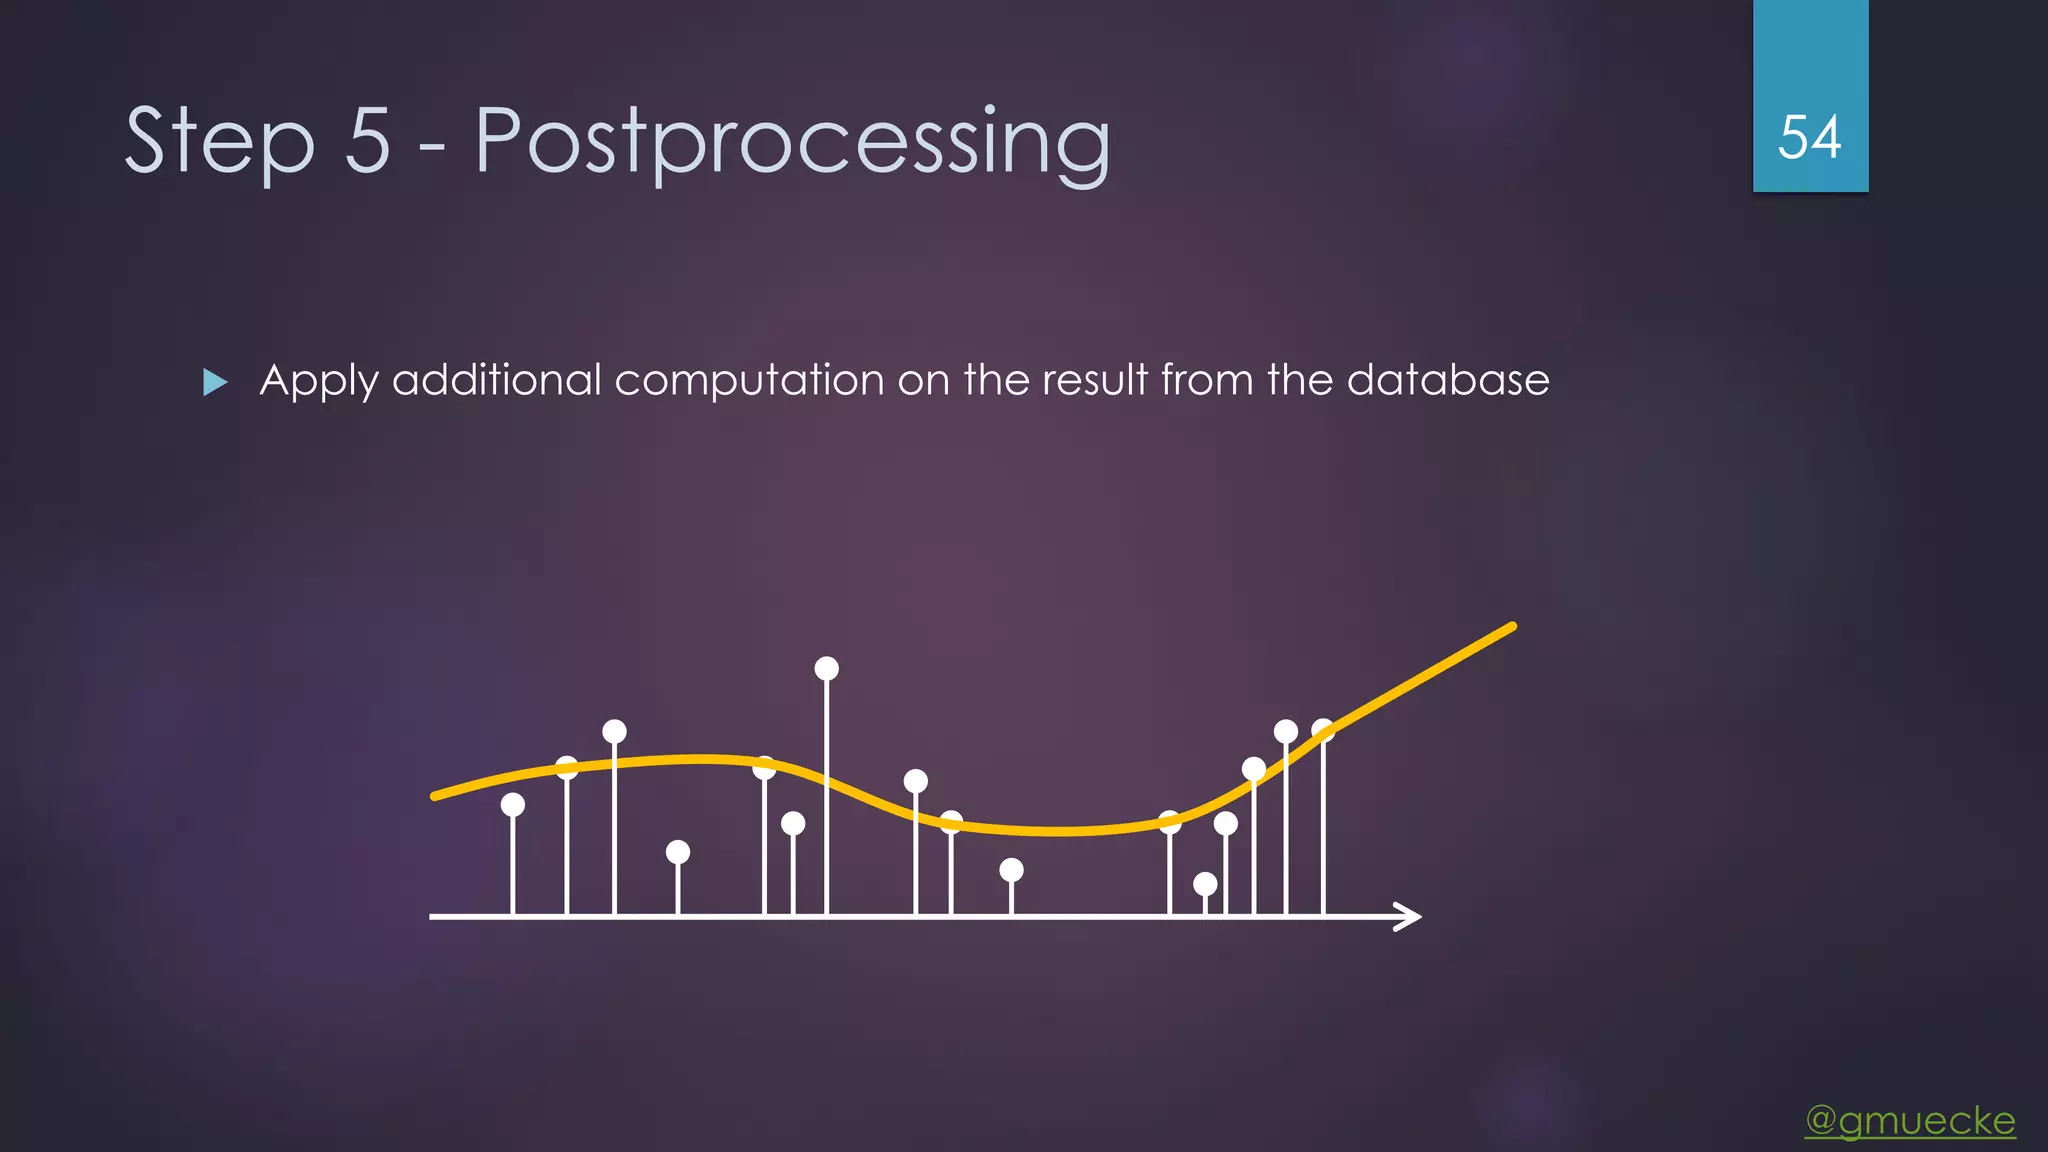

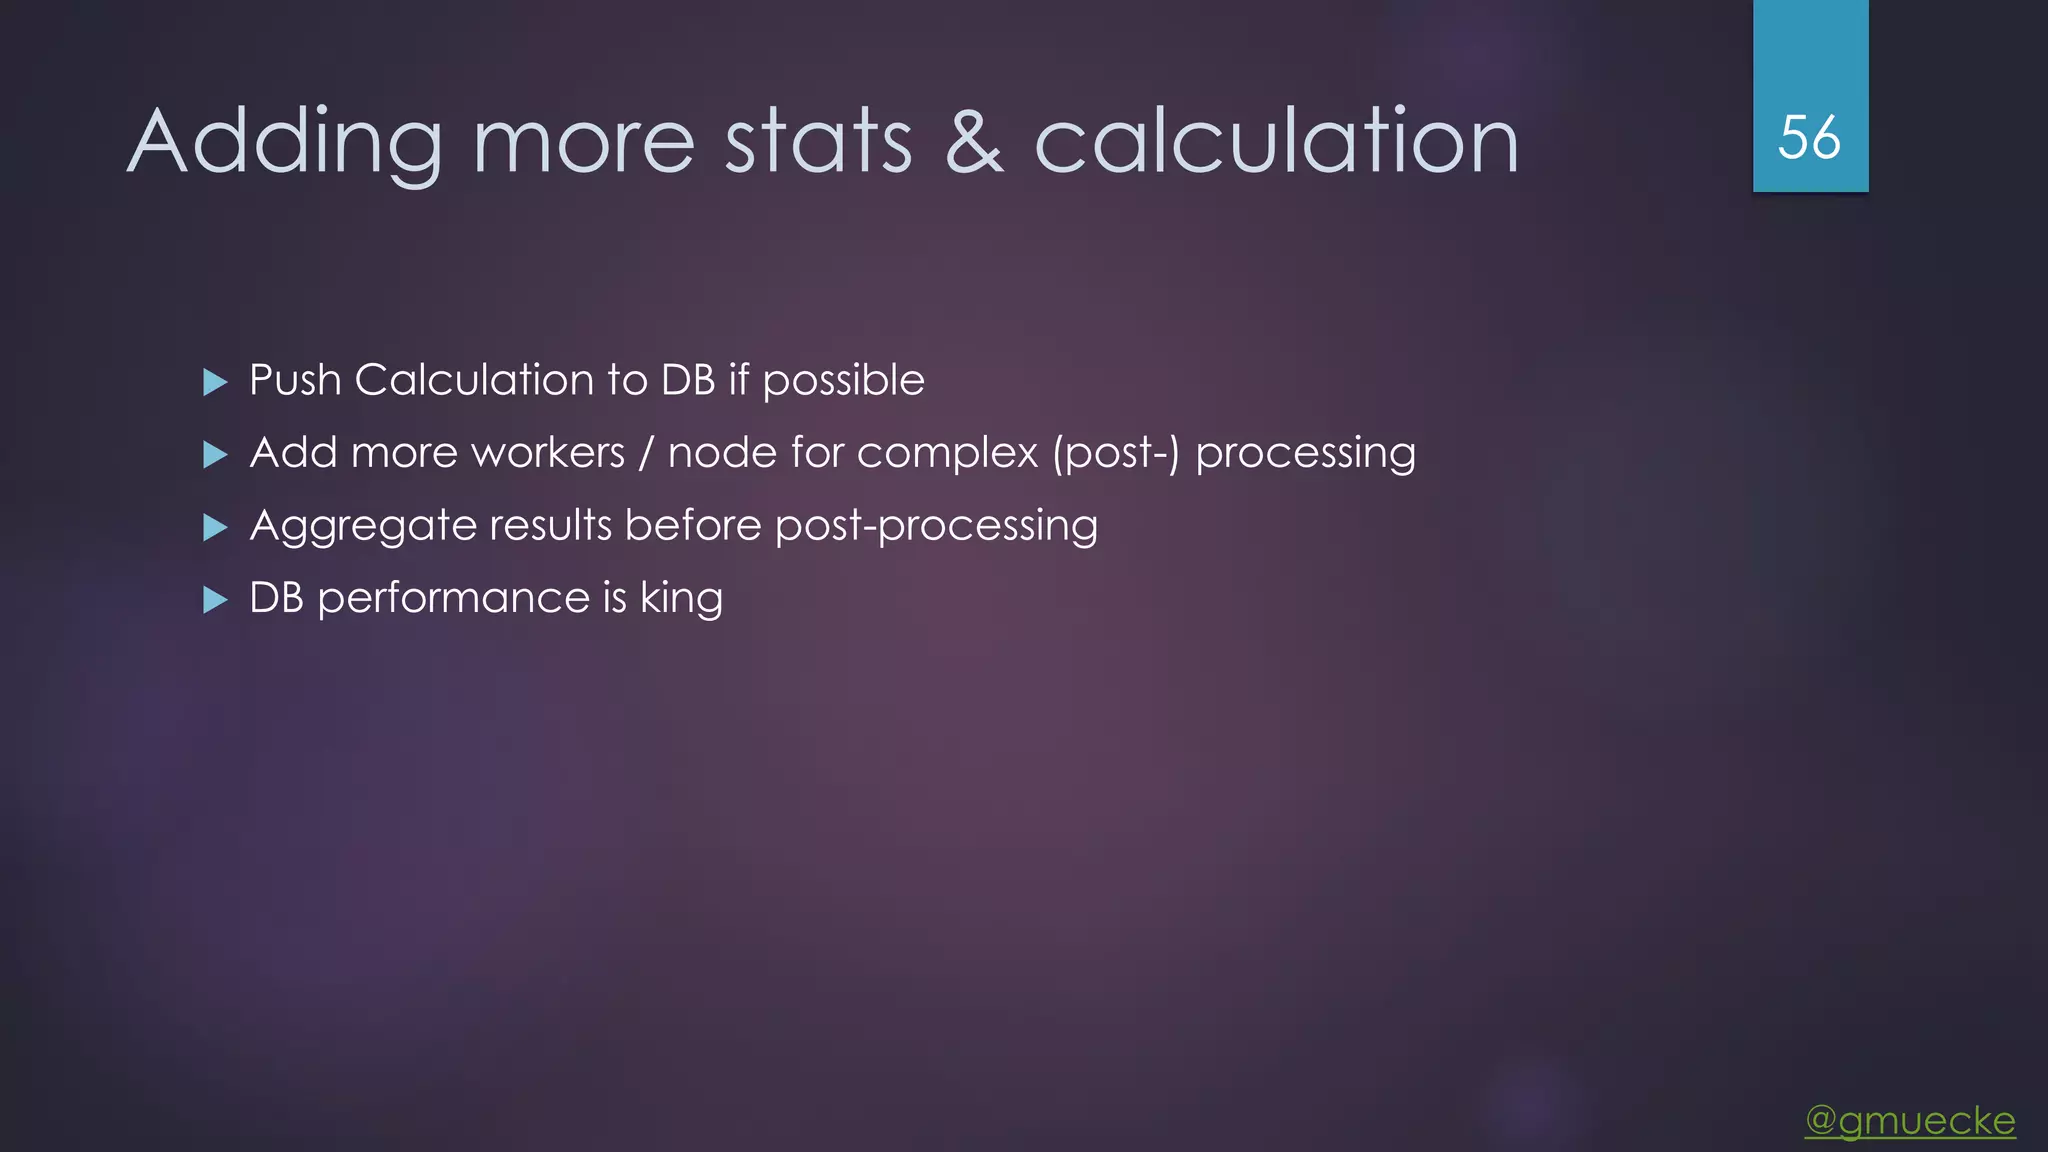
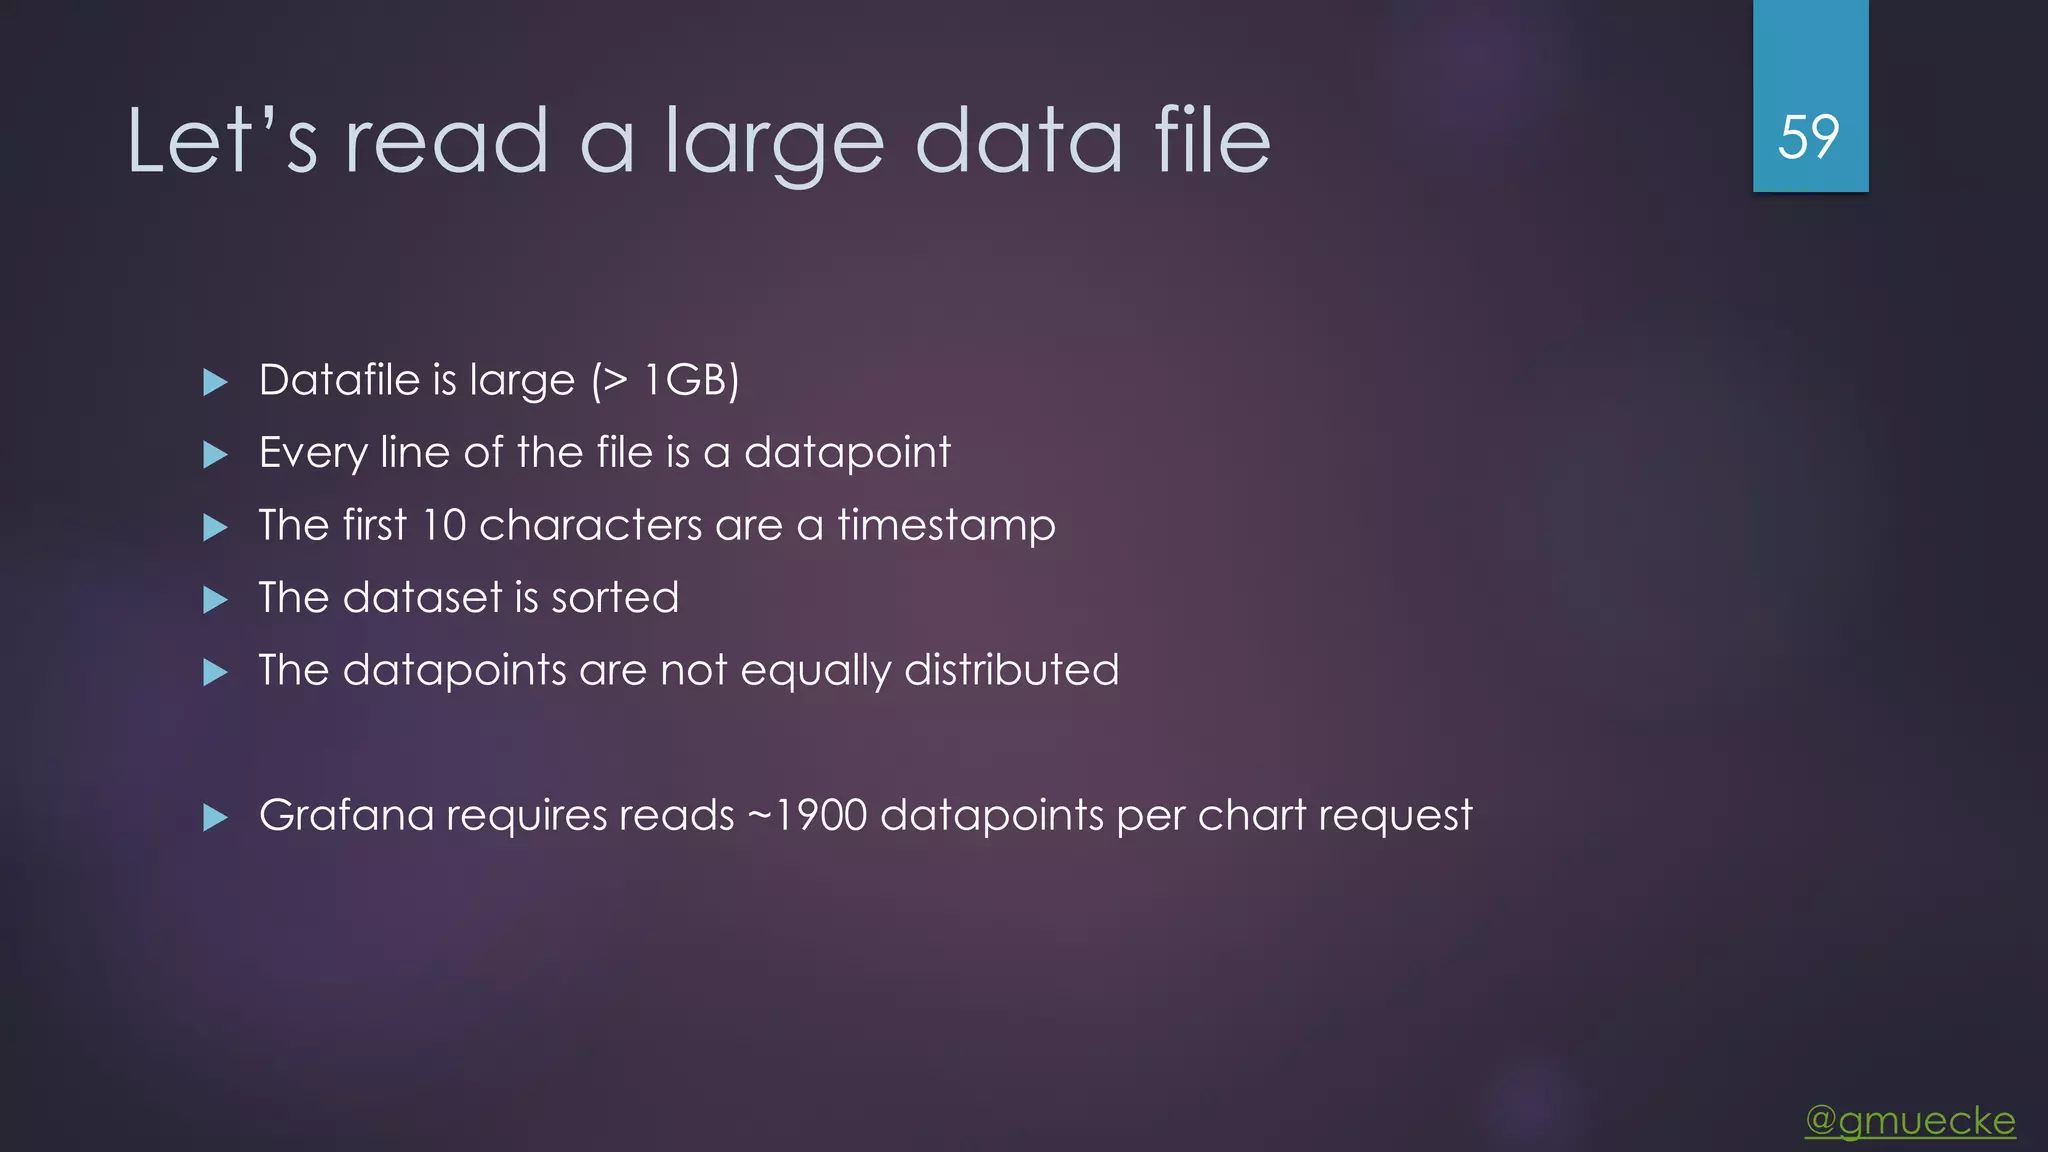
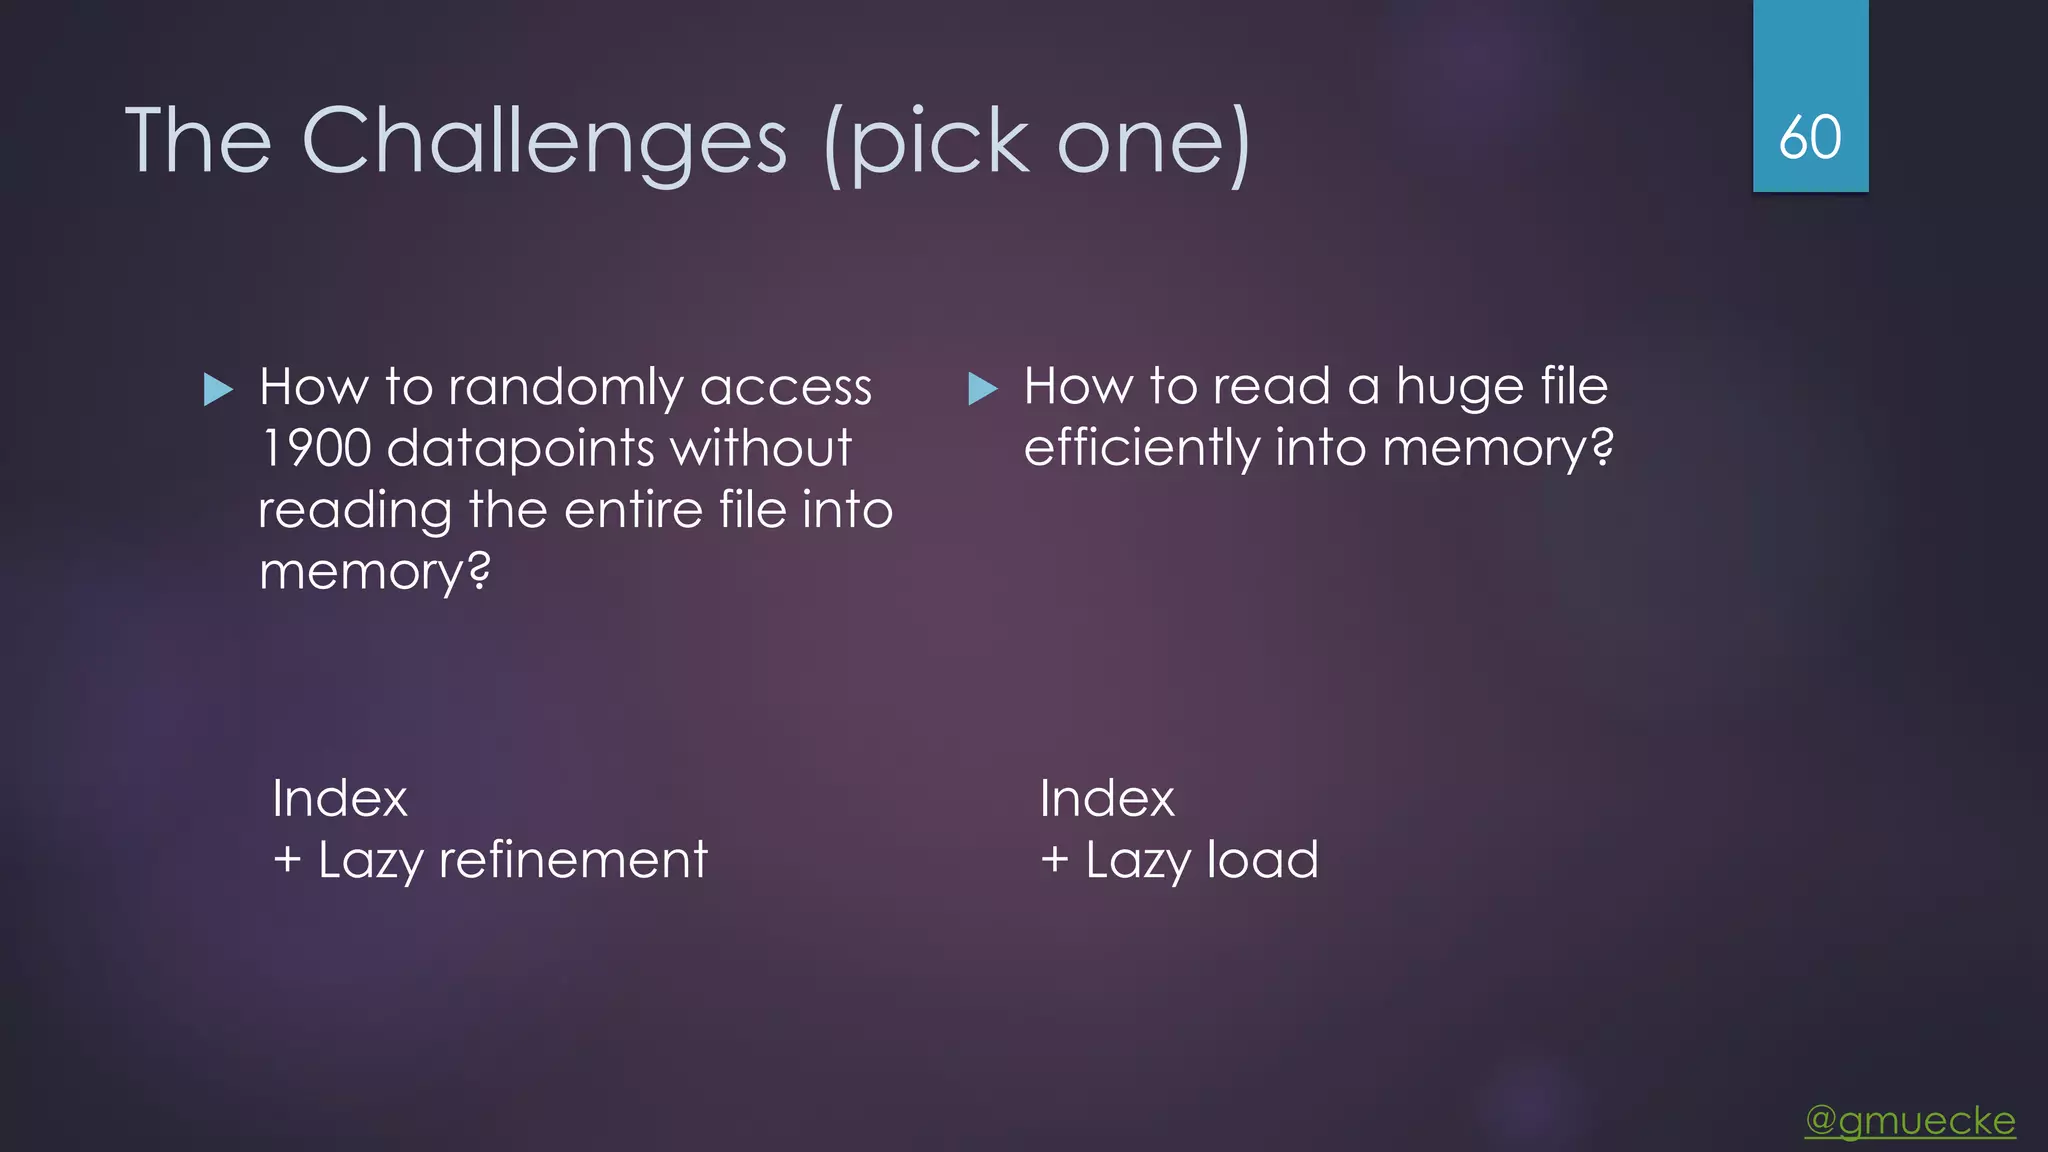
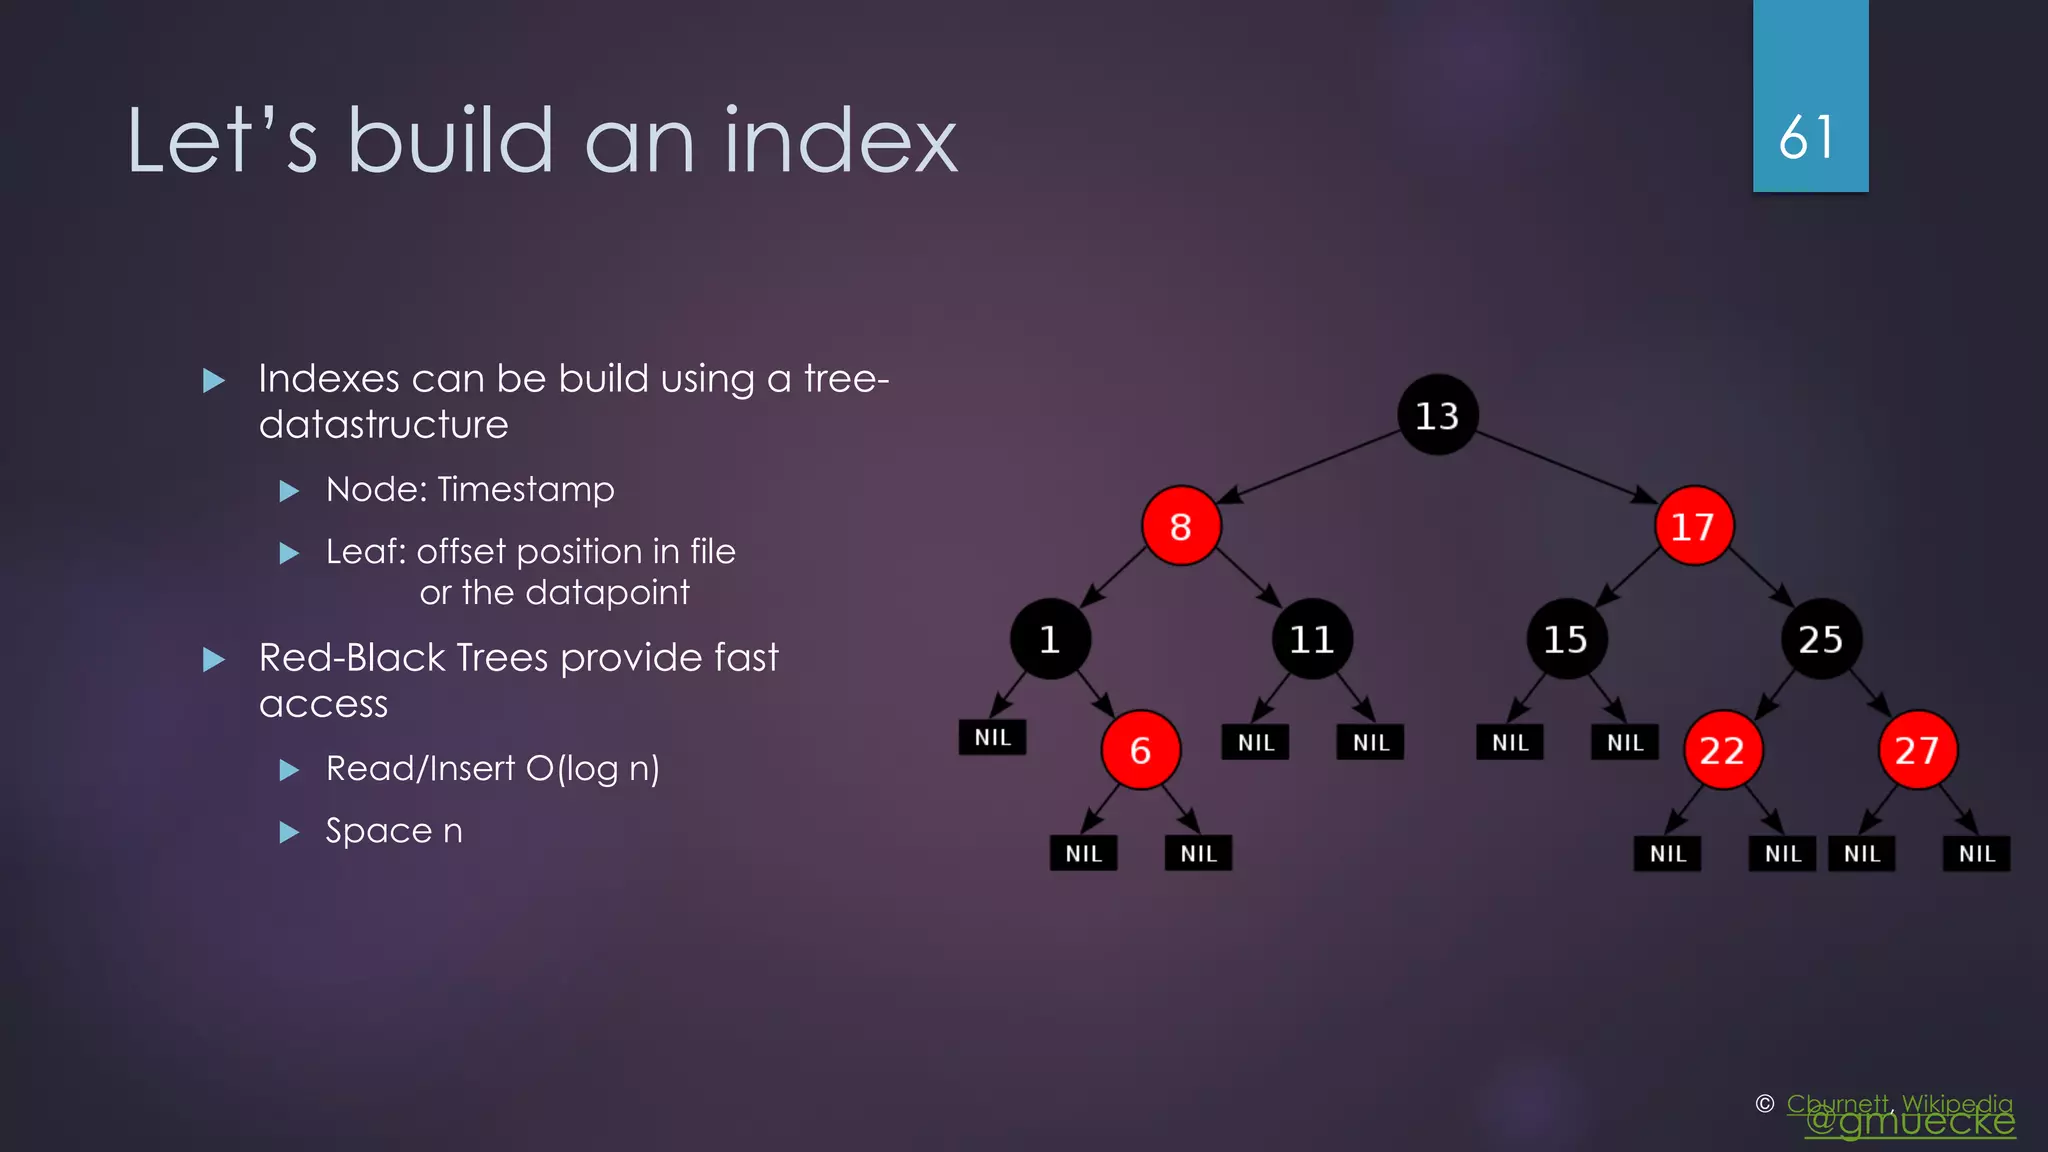


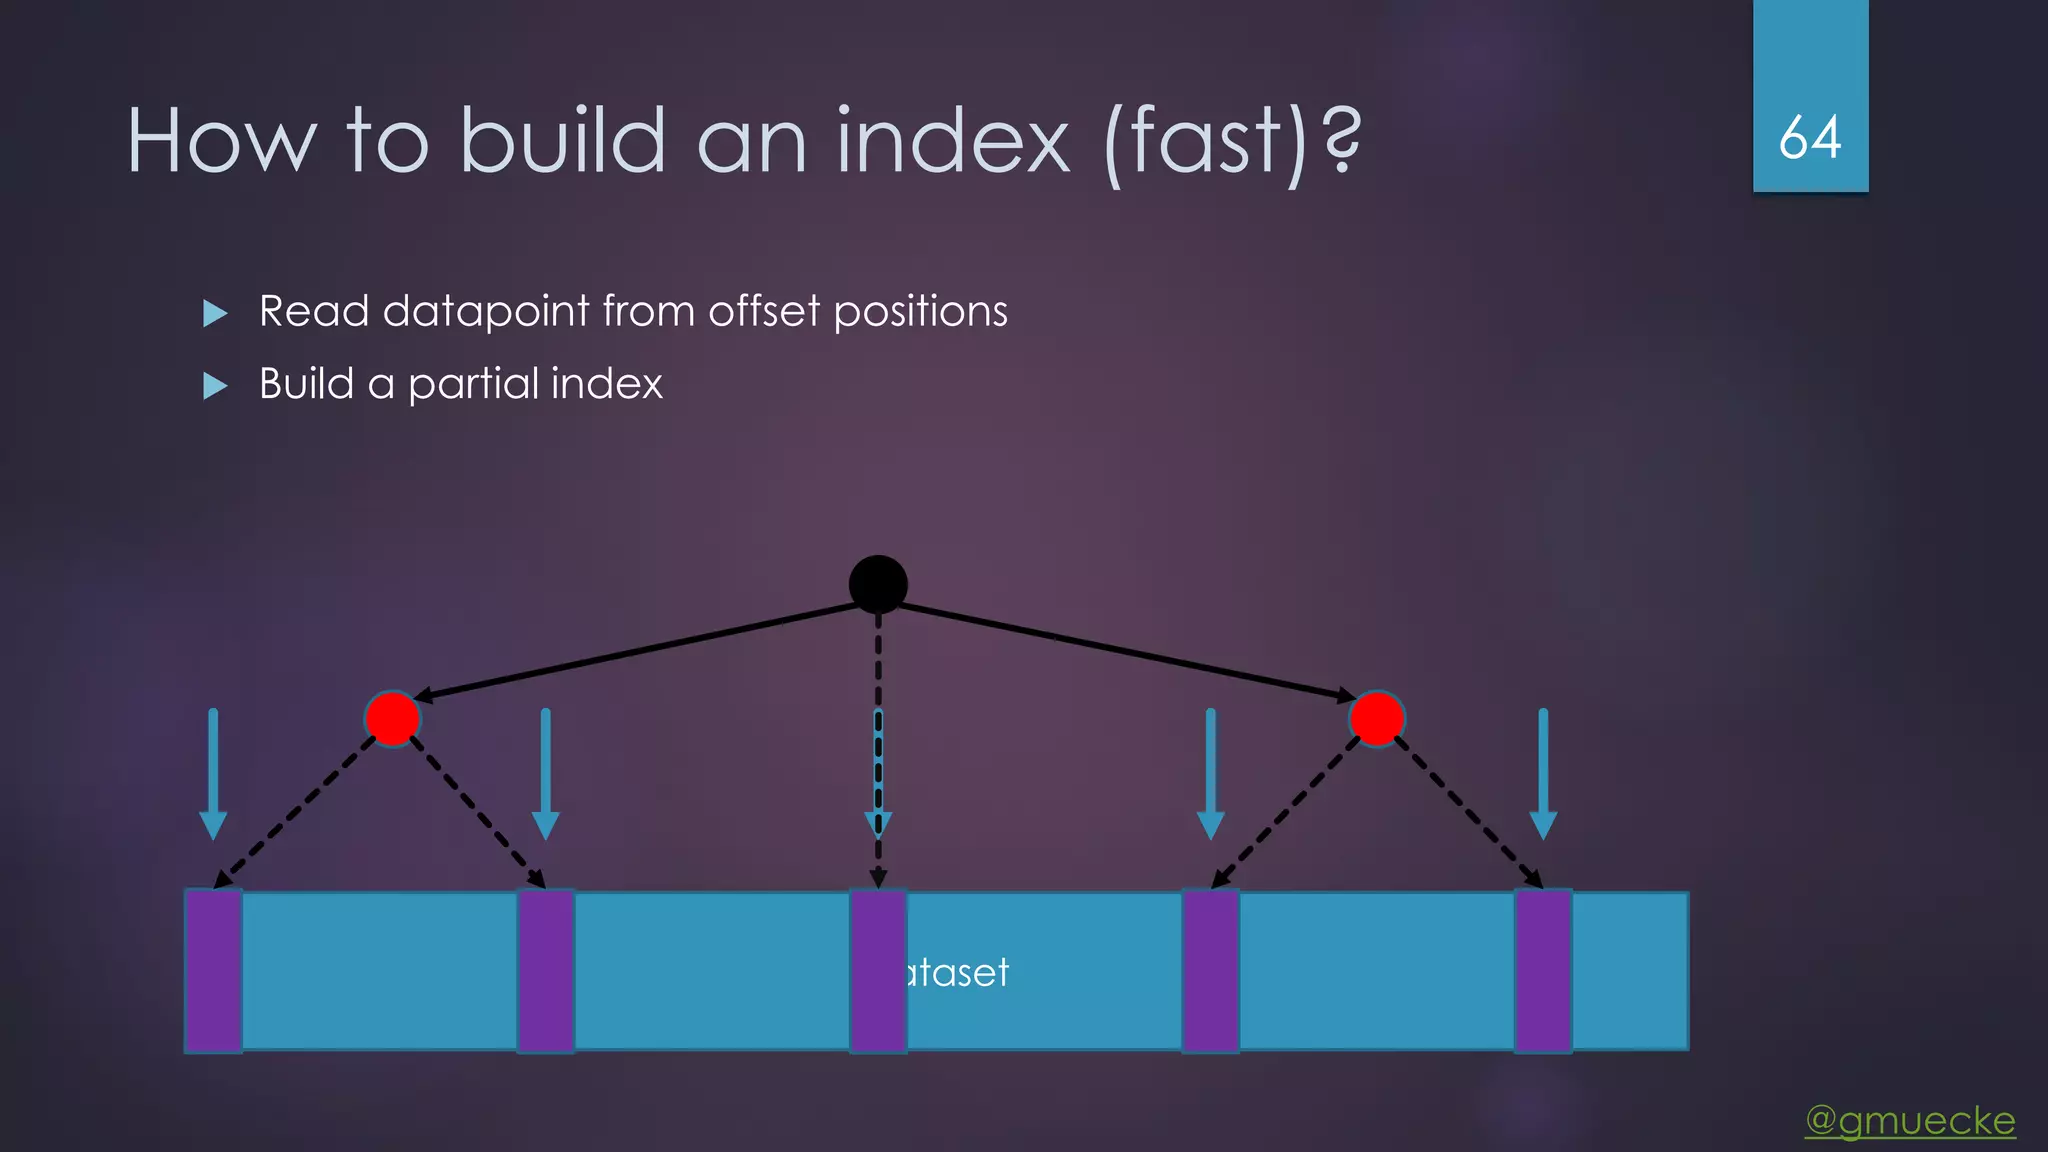
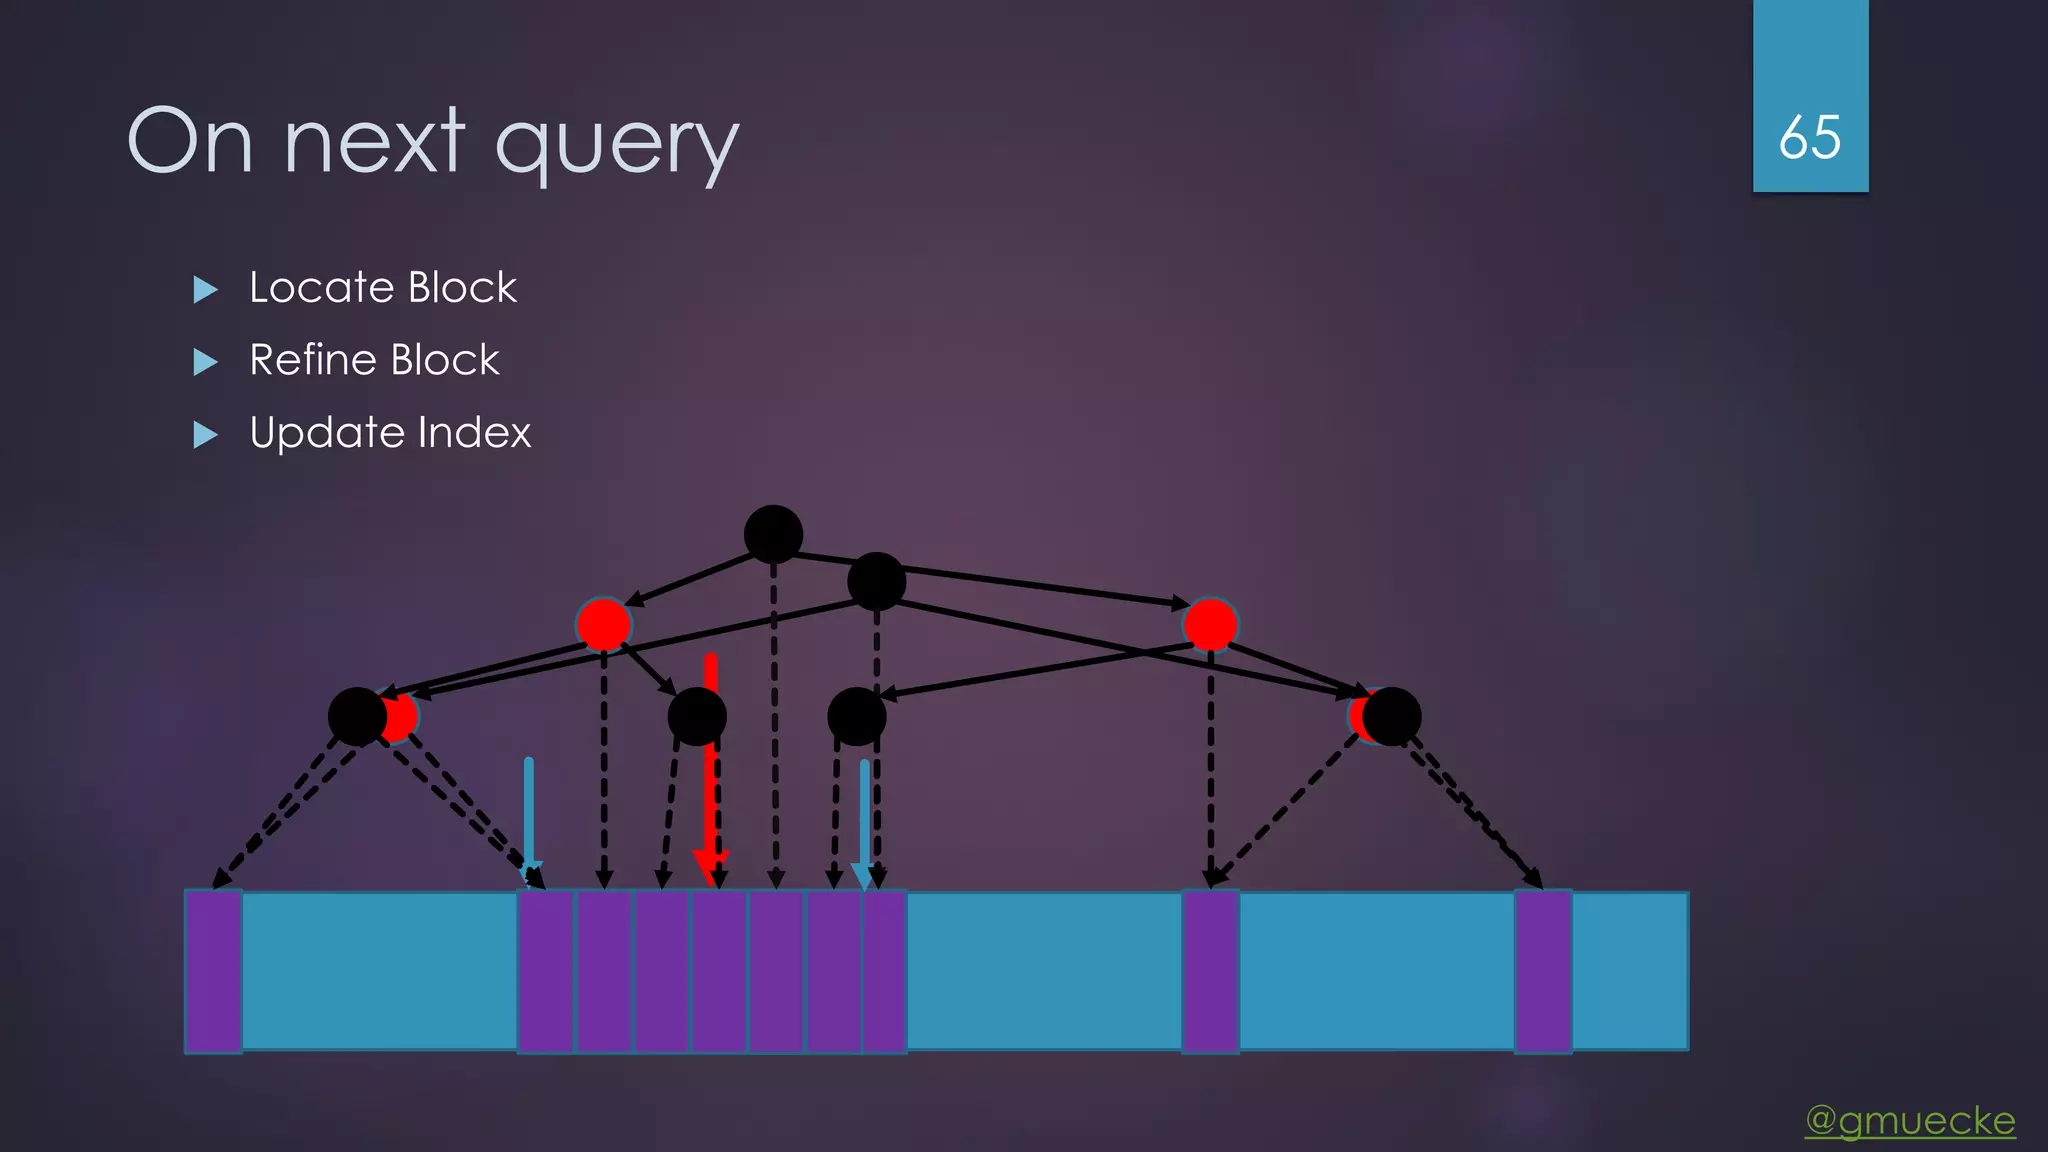
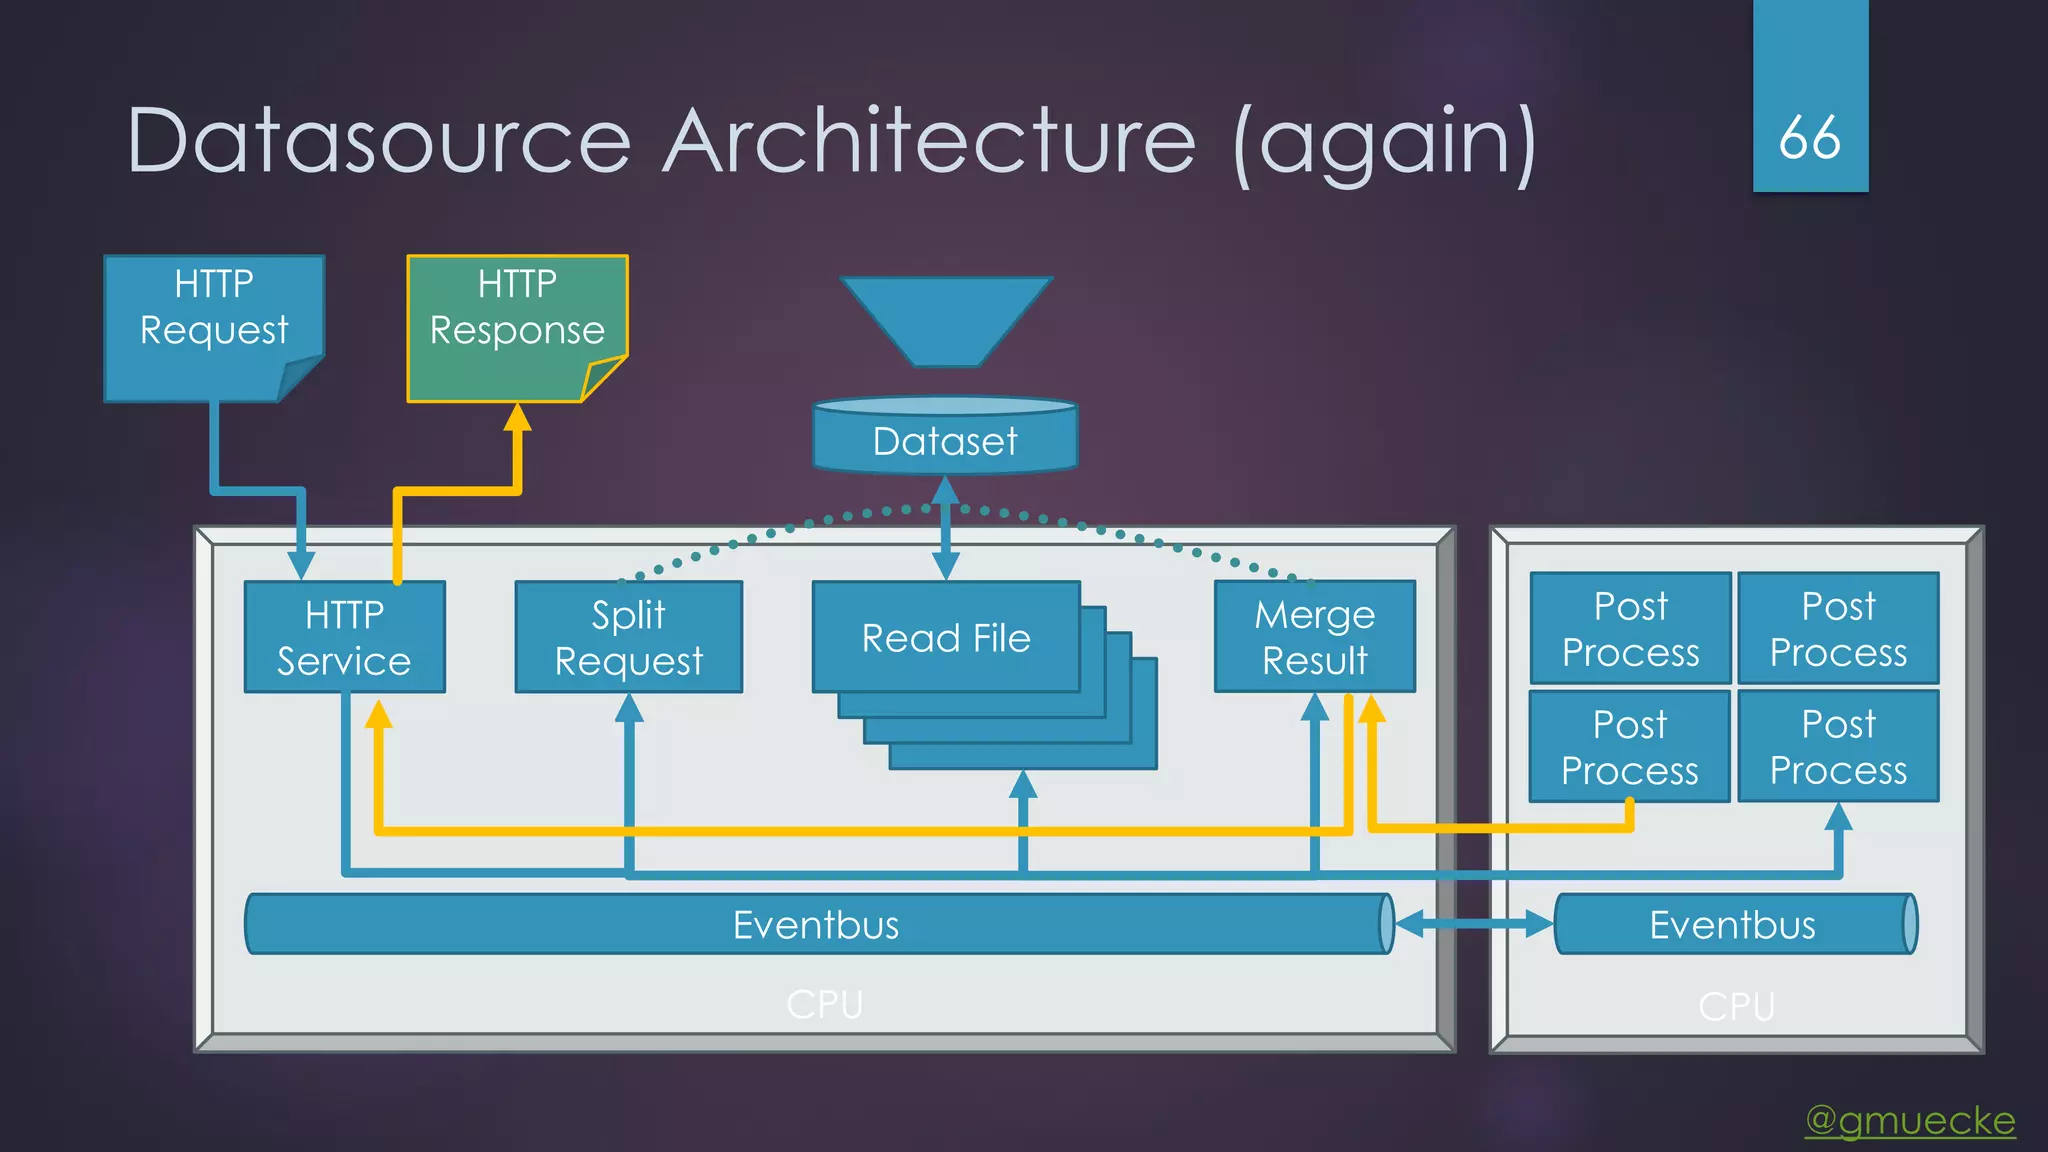
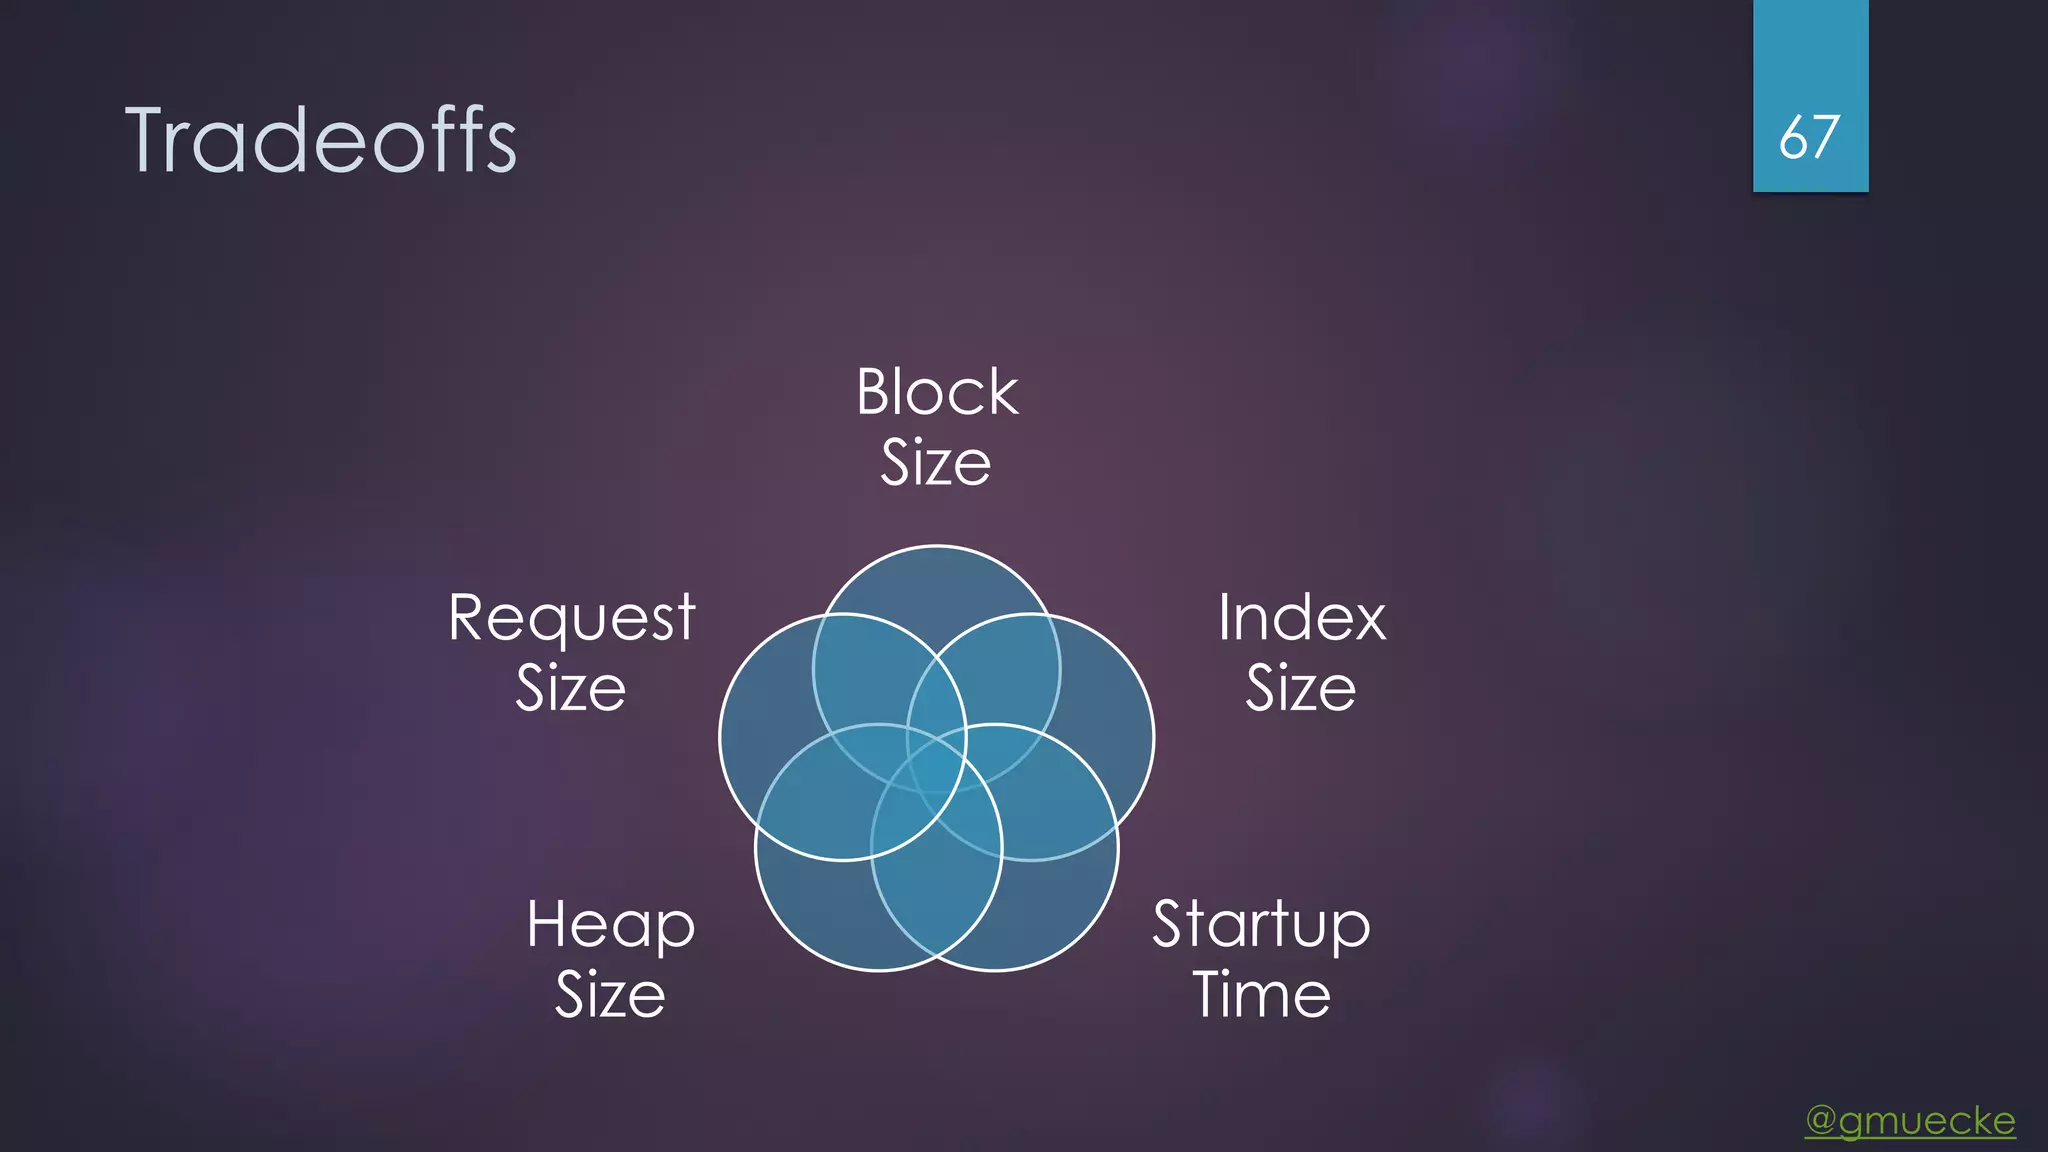


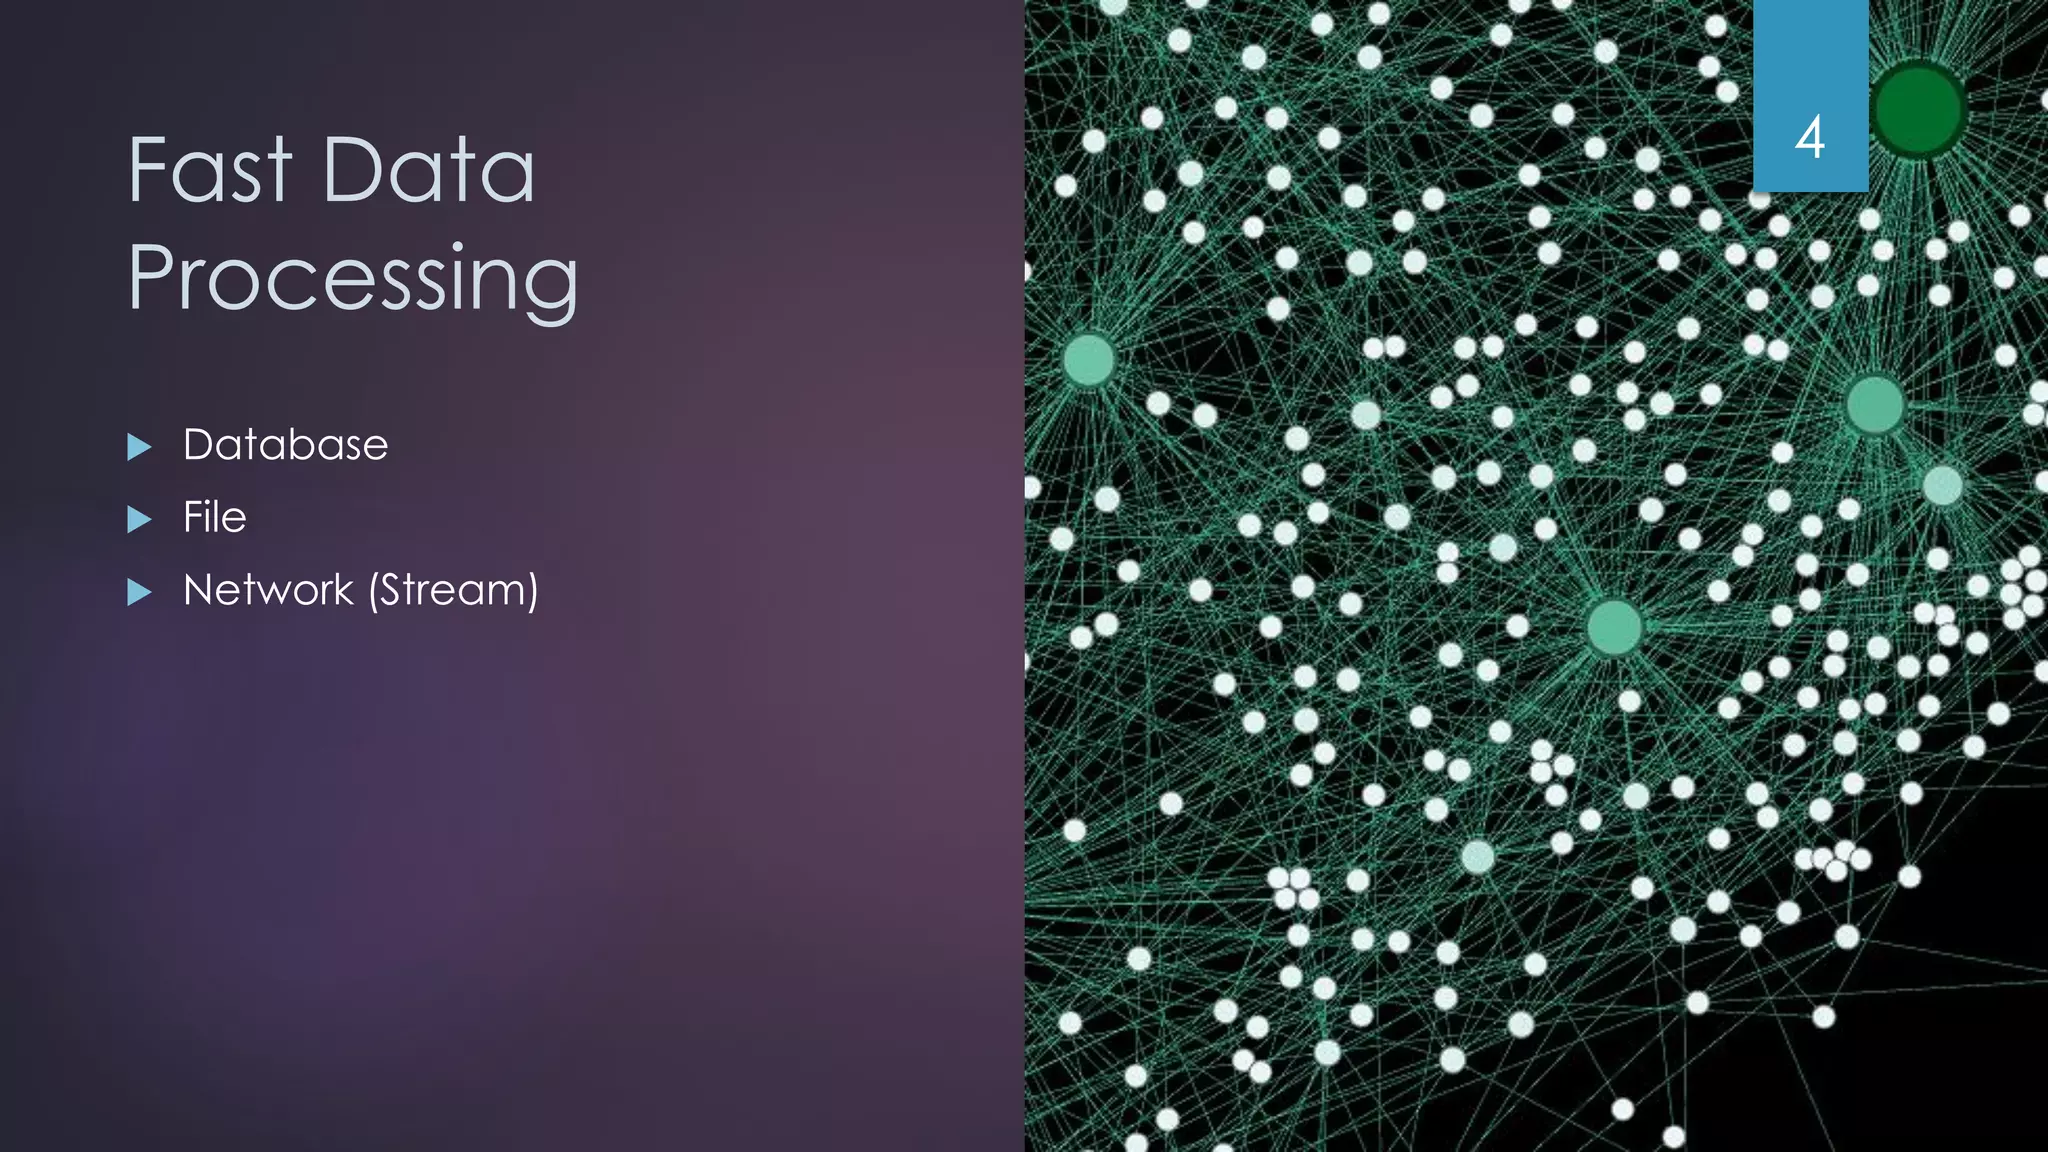
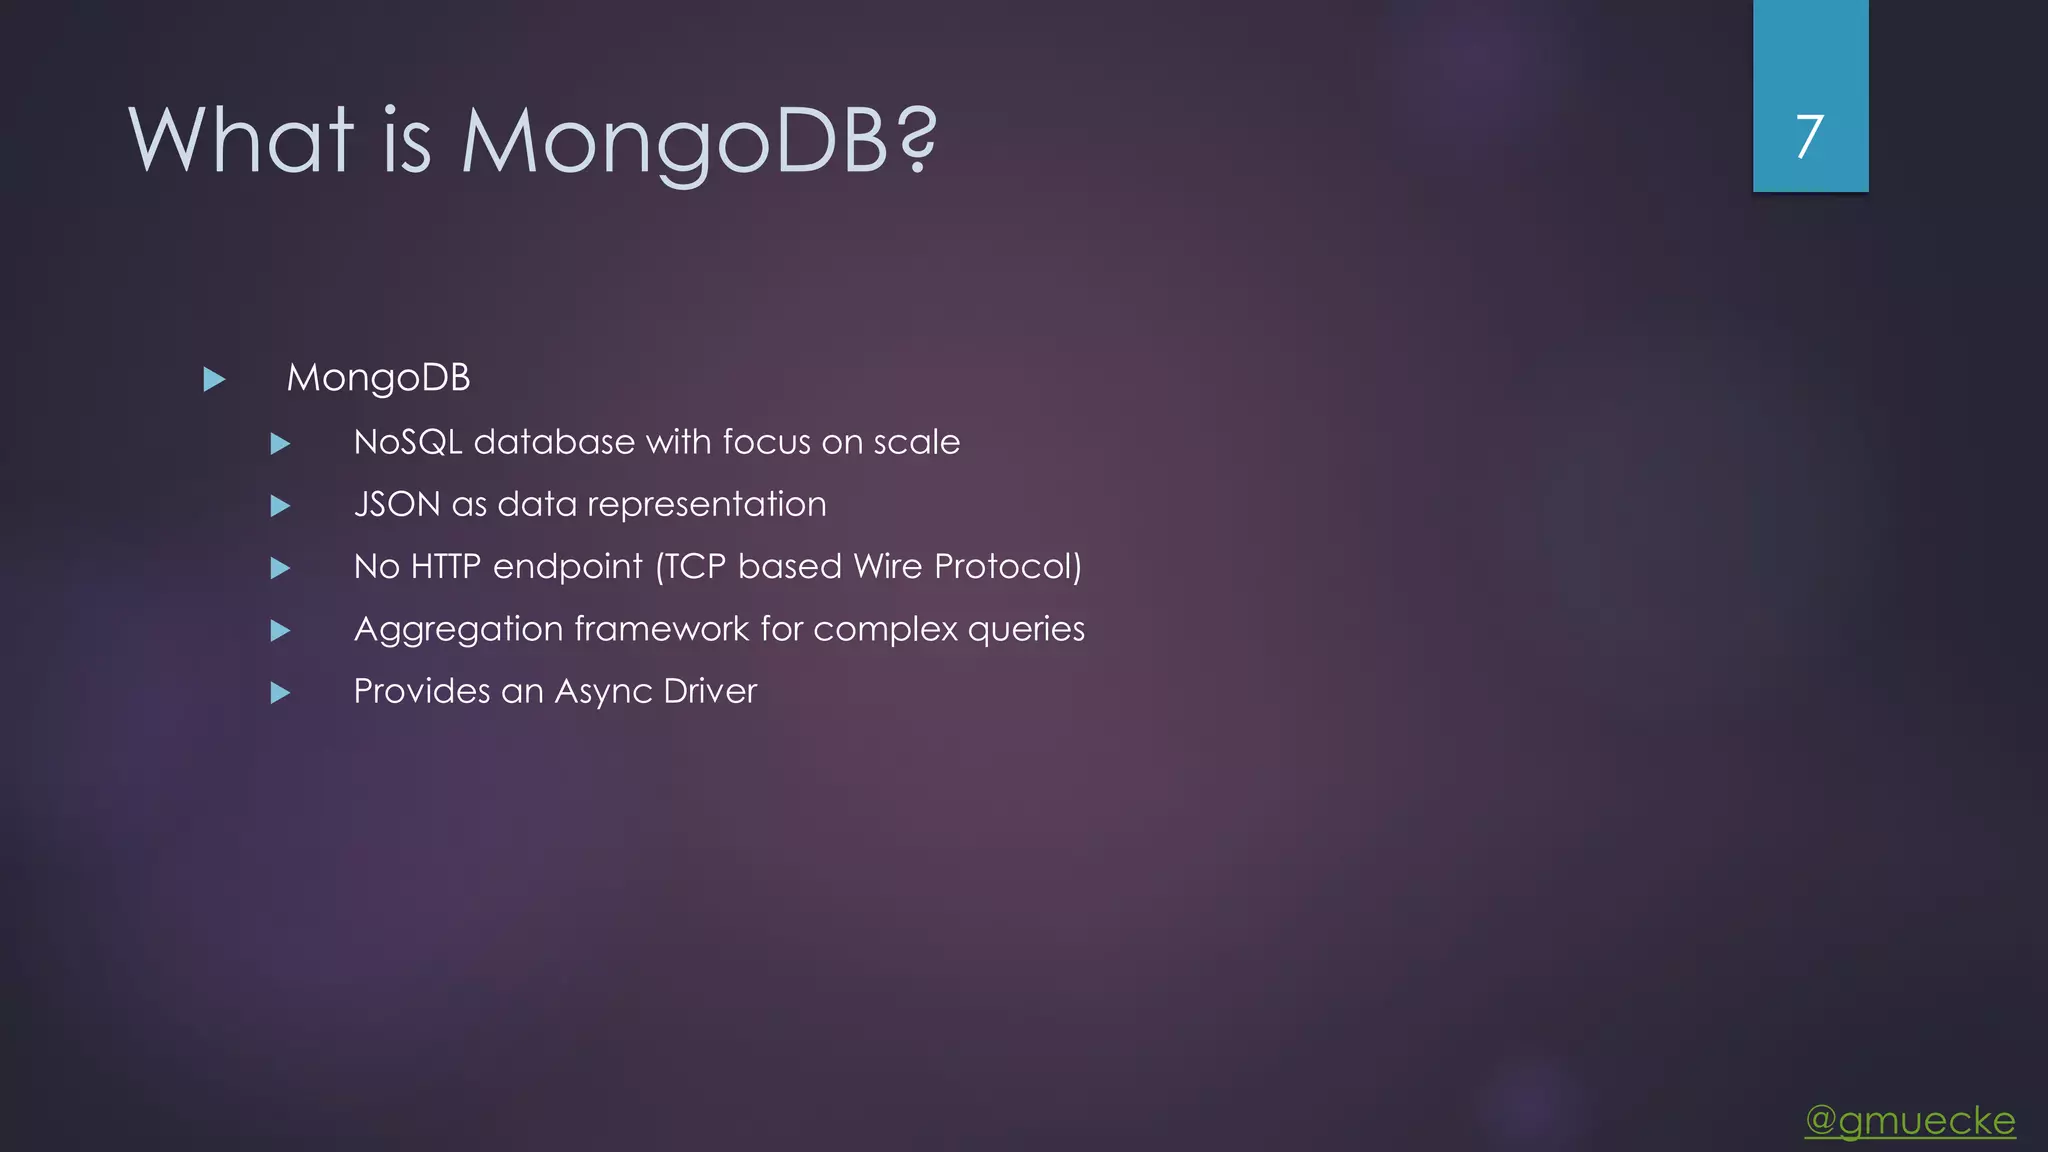
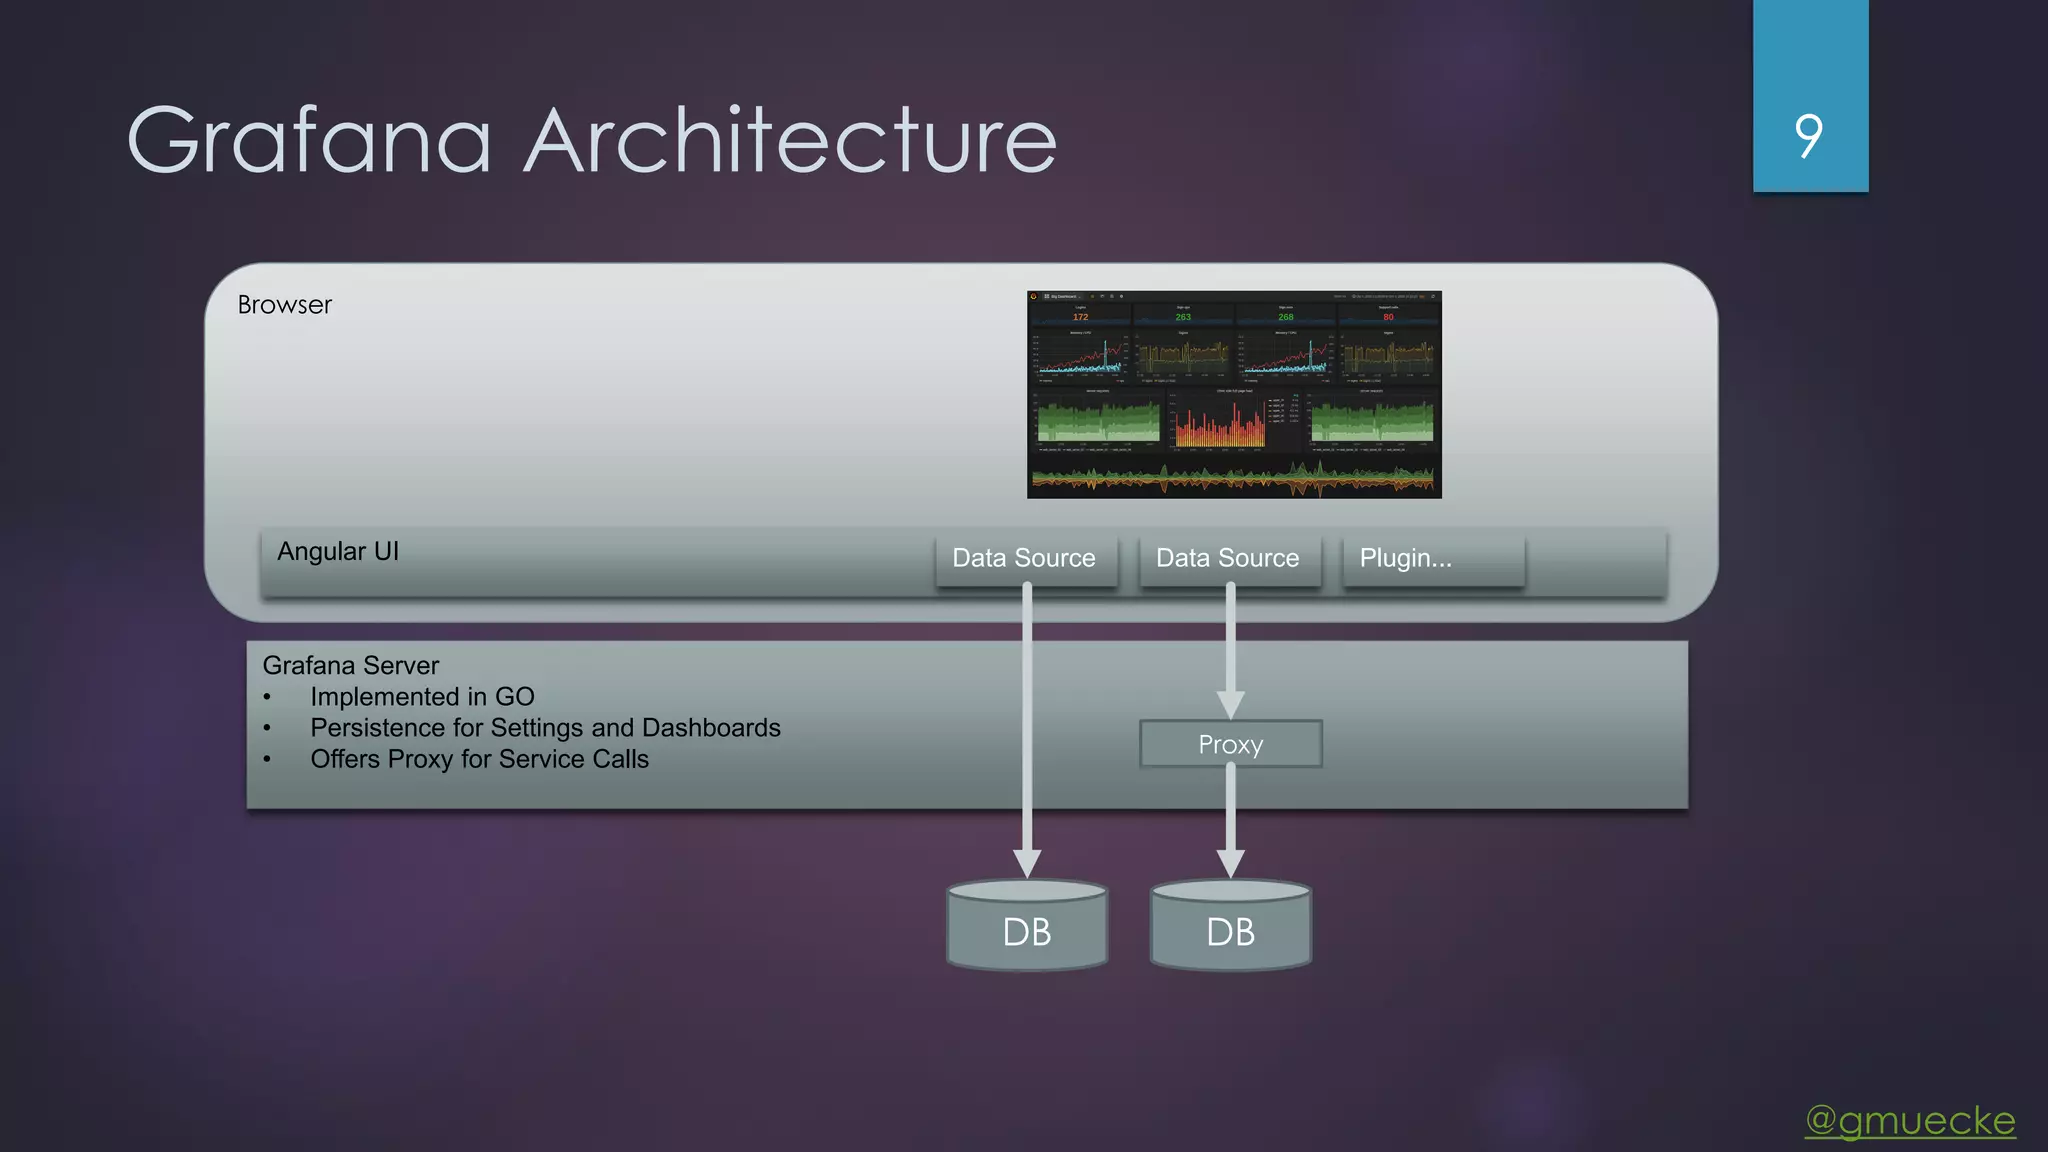
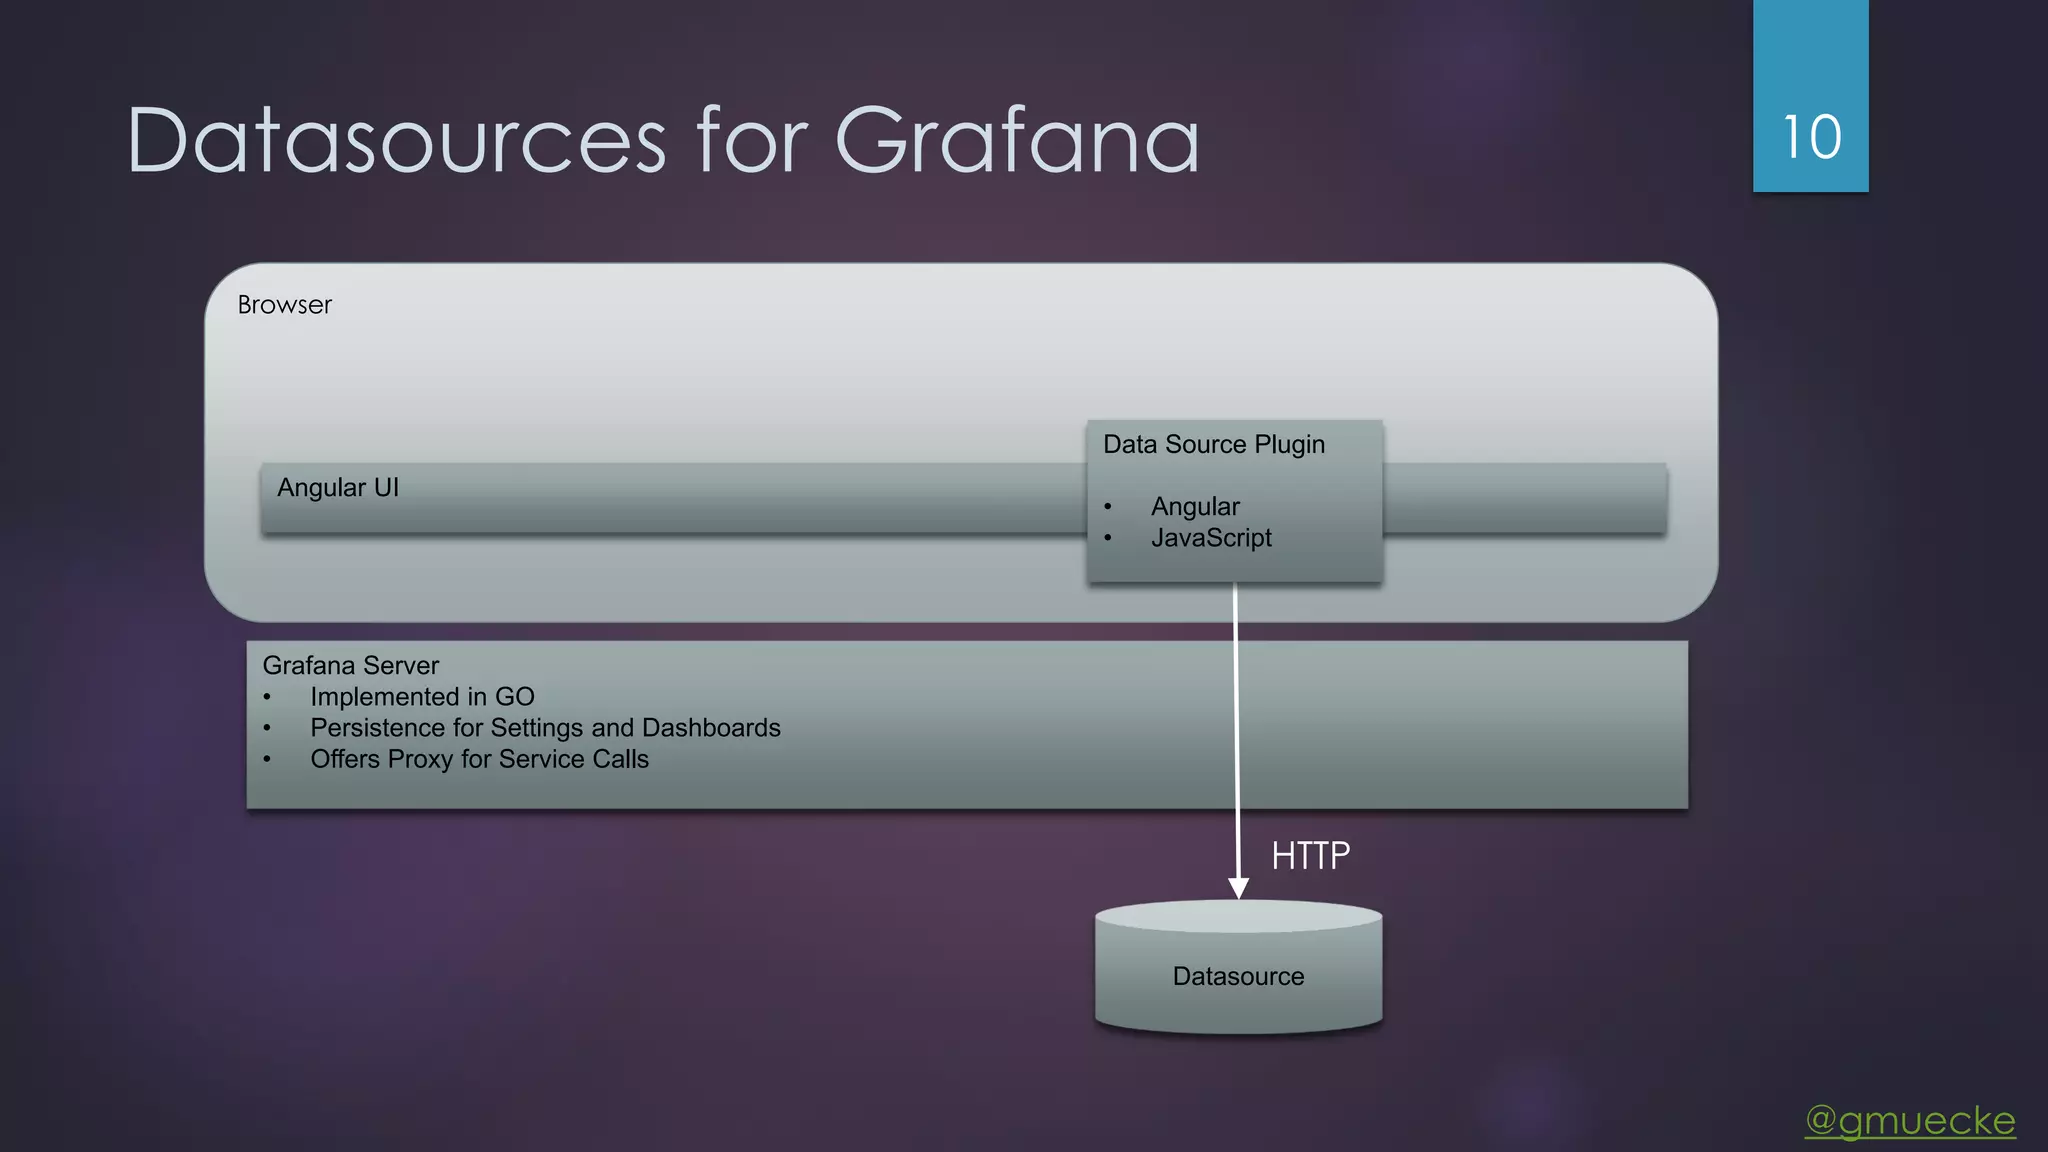
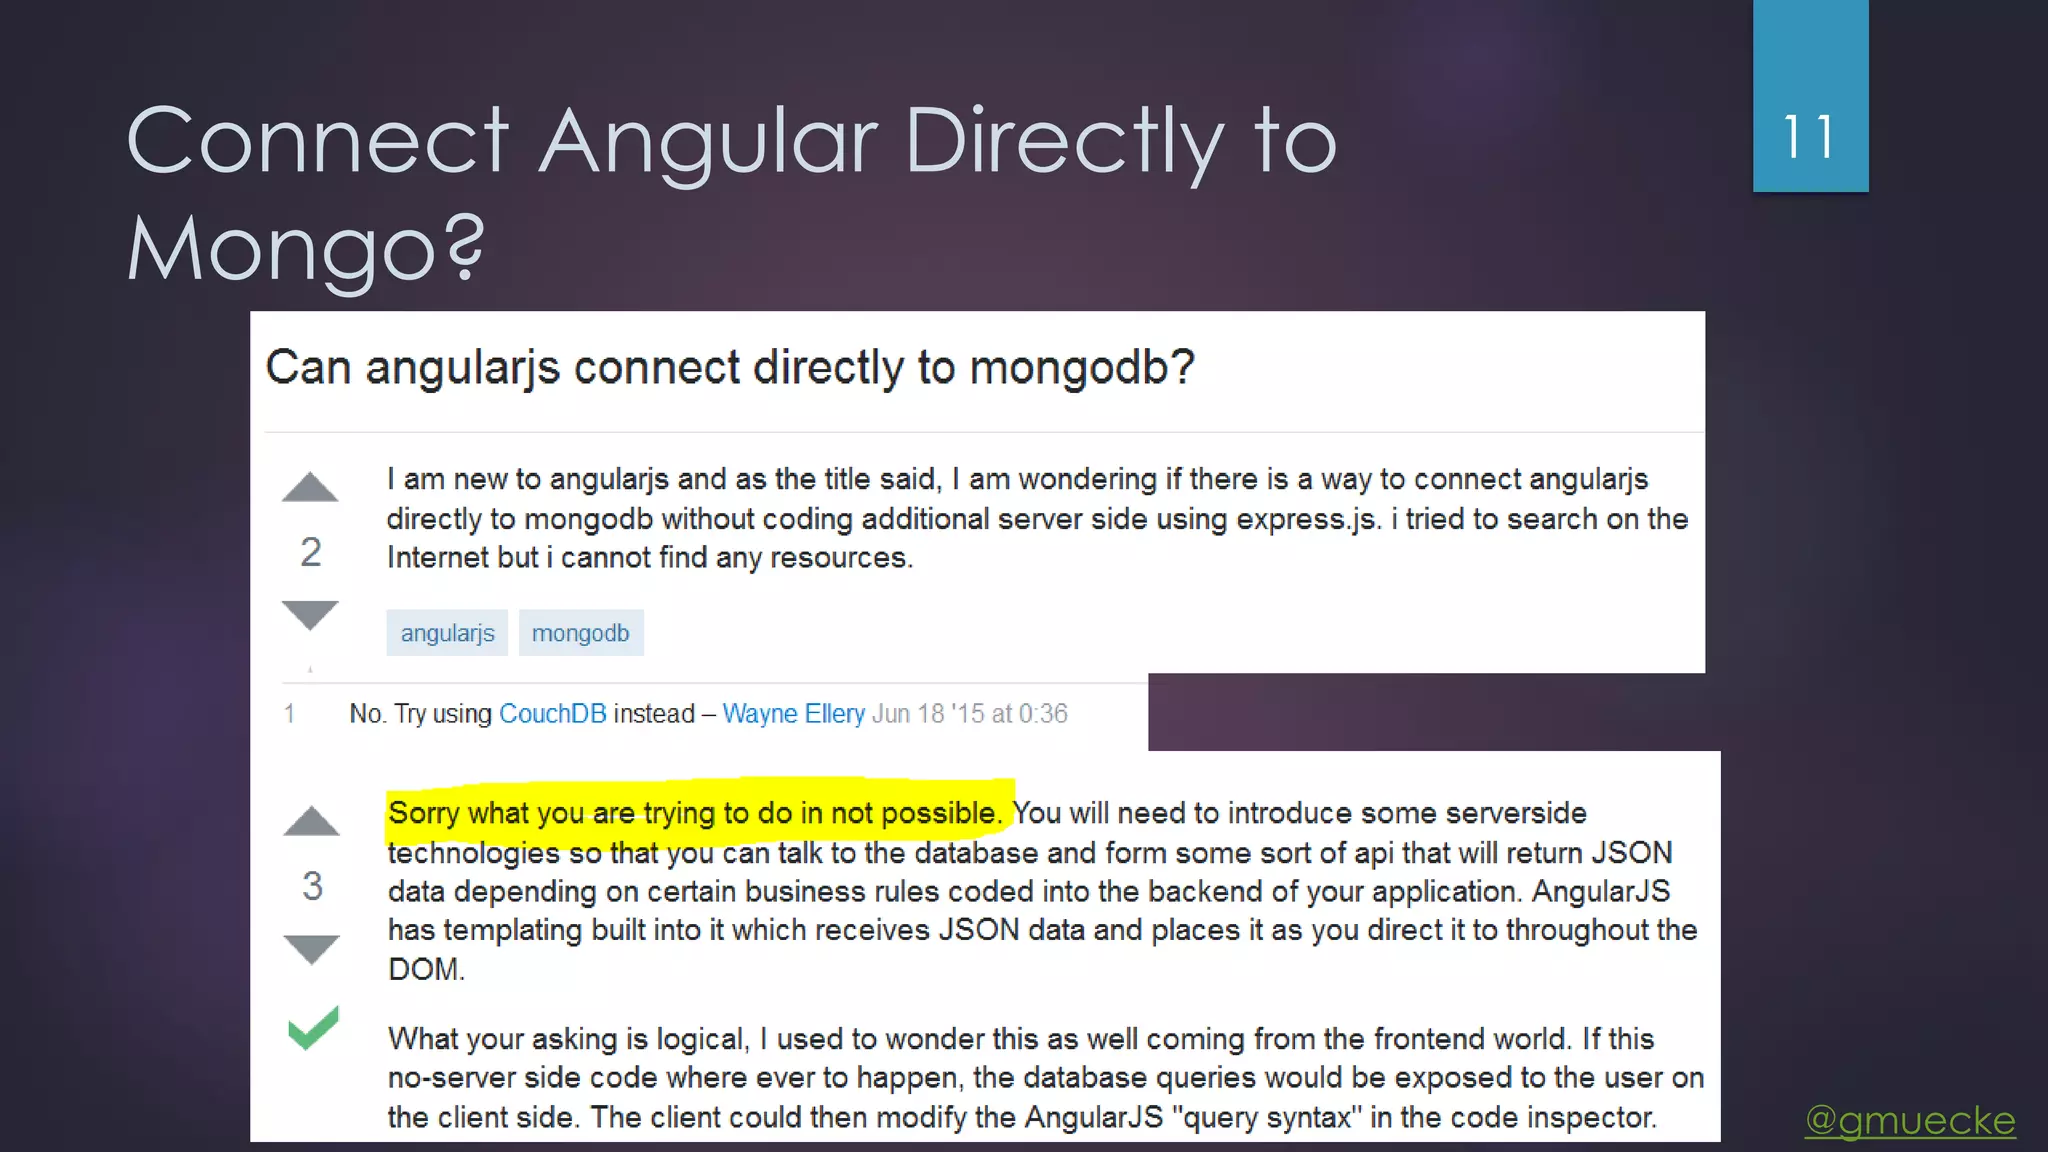
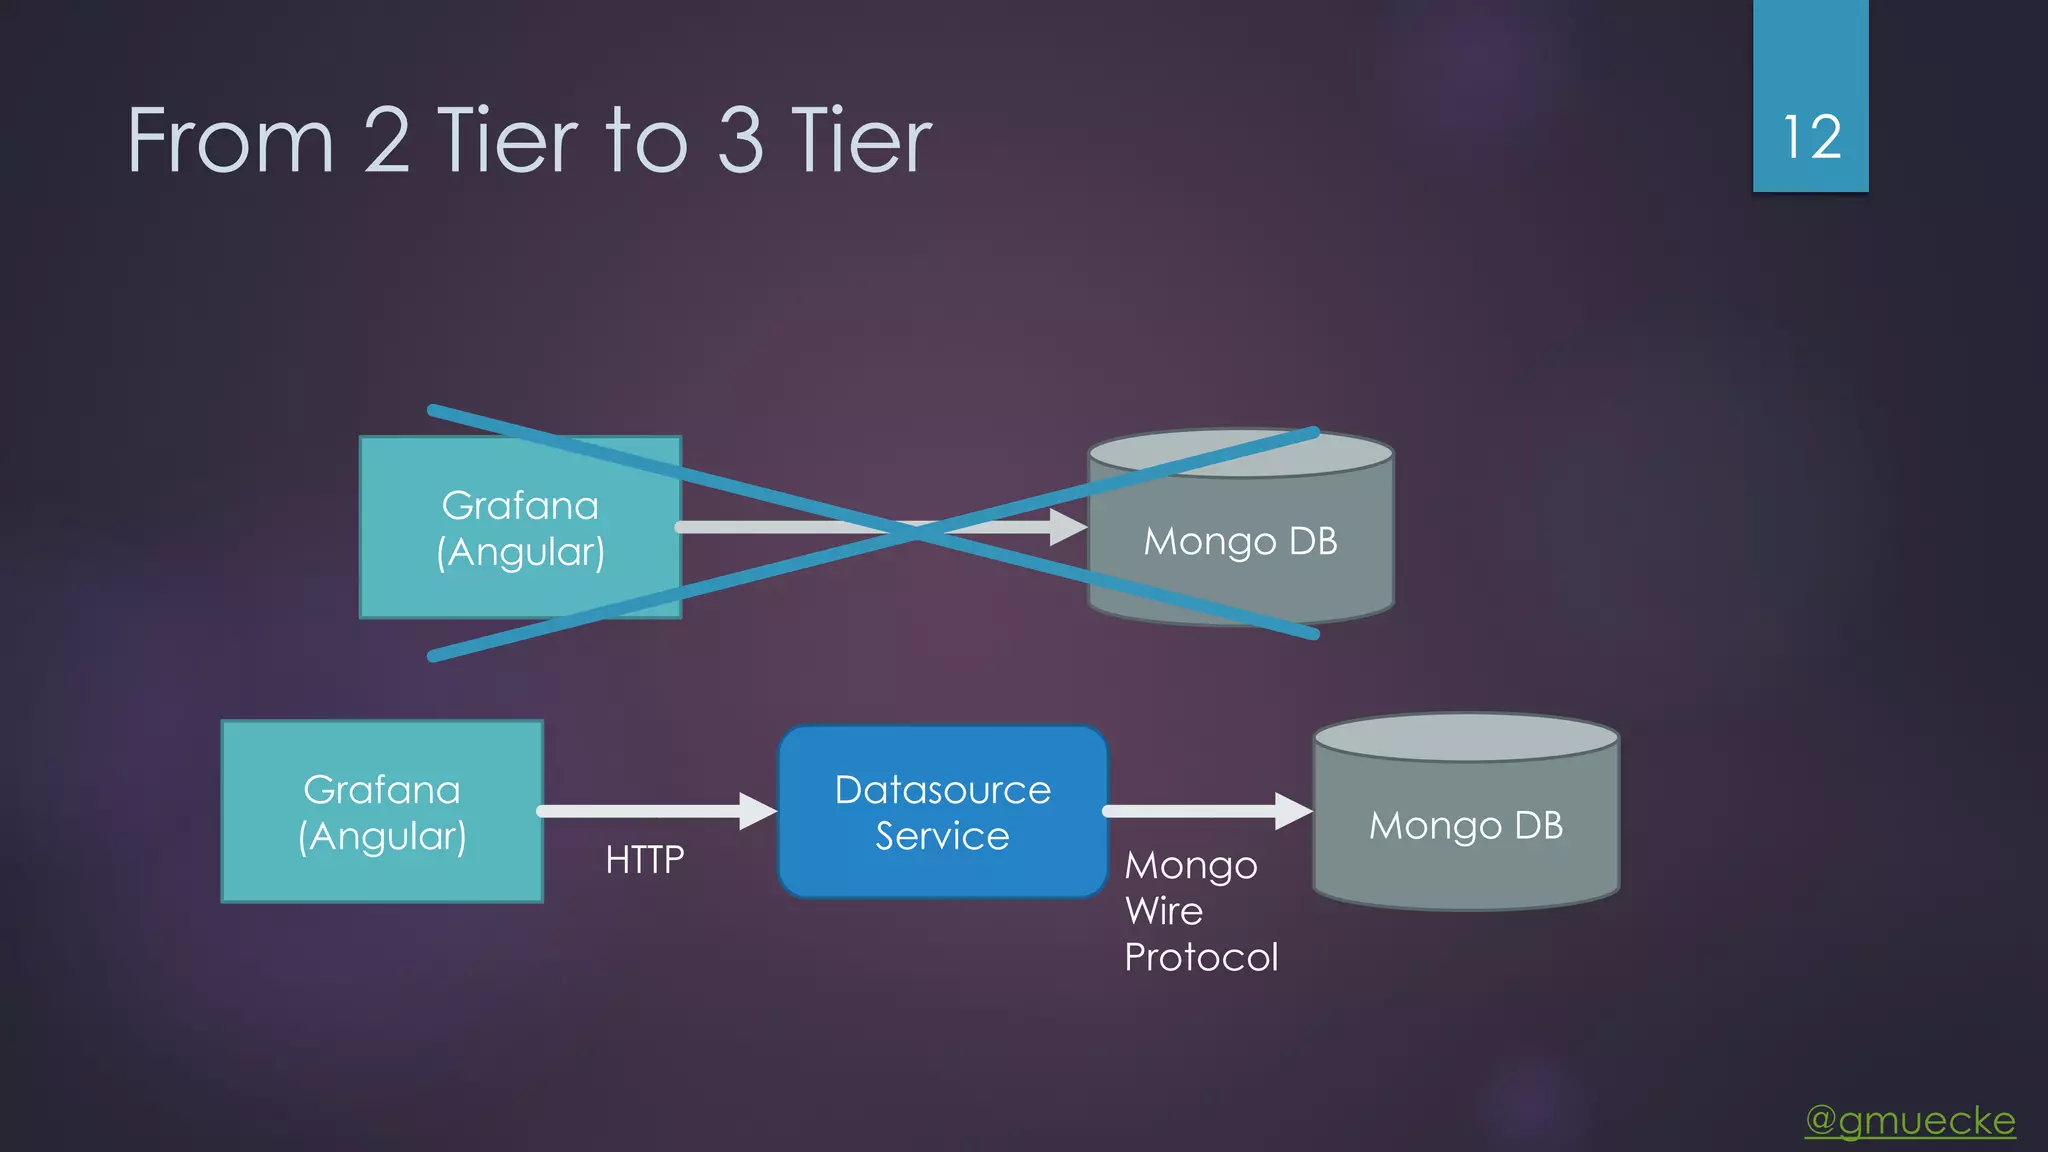
This document discusses building a custom data source plugin for Grafana using Vert.x to analyze timeseries data stored in a MongoDB database or large data files. It describes the challenges of efficiently querying large datasets and processing the results. Various approaches are presented, starting with a naive approach, and improving through techniques like splitting queries, aggregating results, using database aggregation pipelines, lazy loading of file indexes, and post-processing. The final architecture employs Vert.x concepts like verticles, event loops and the event bus to asynchronously process queries in parallel and aggregate the results.