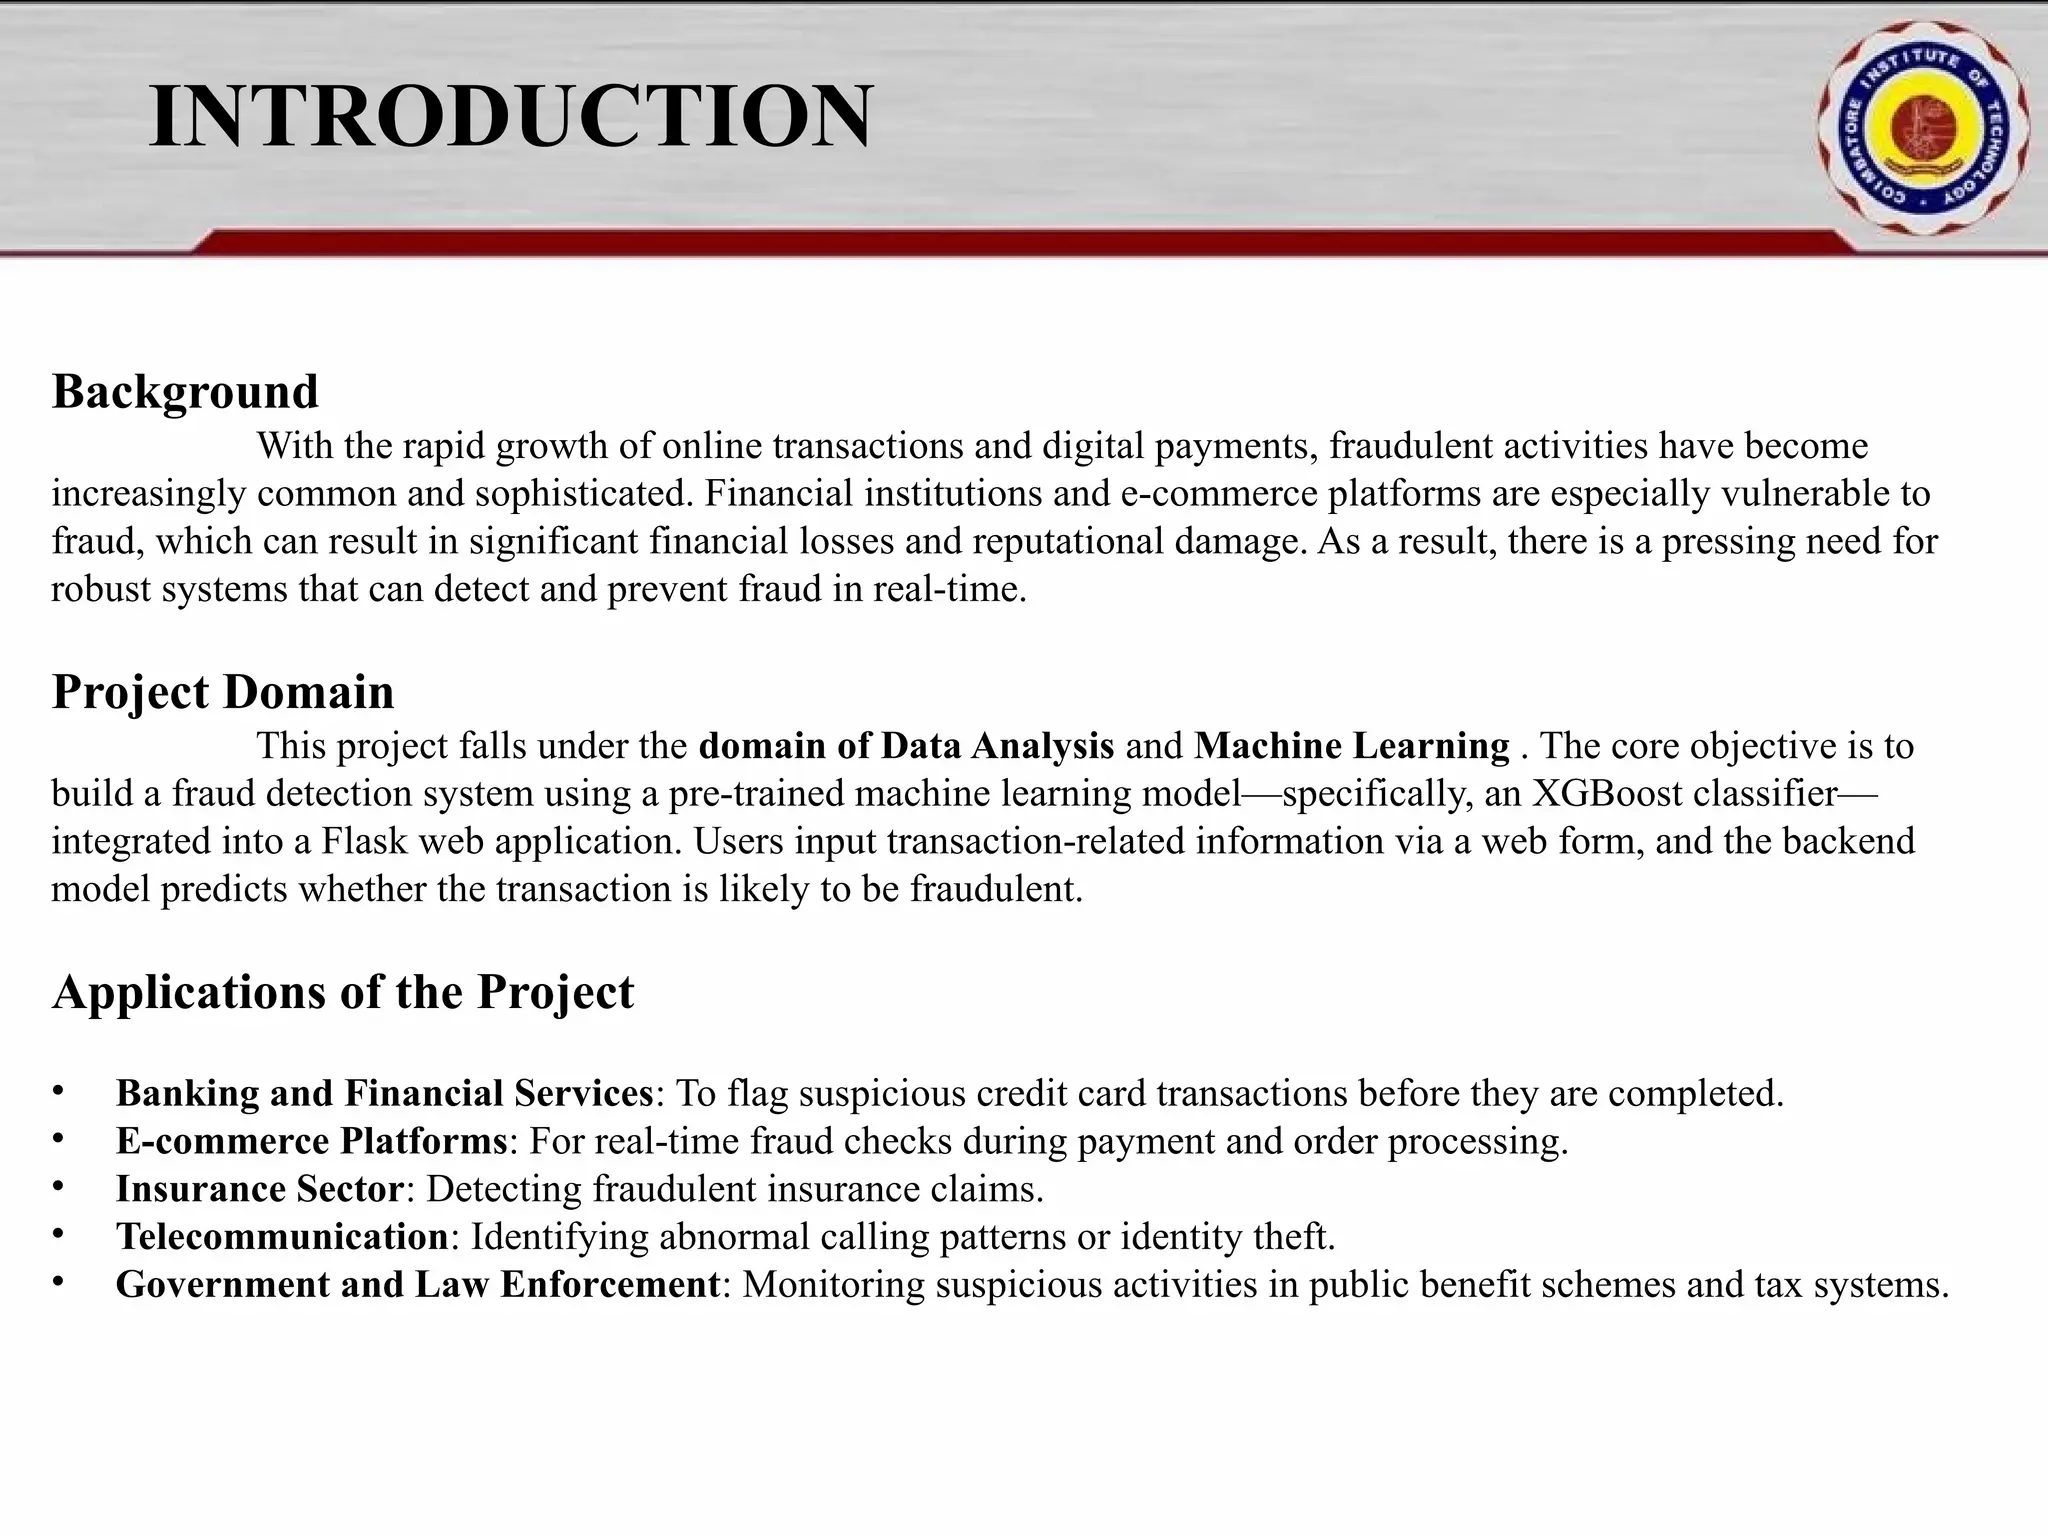
Online fraud detection is the process of identifying and preventing fraudulent activities conducted through digital platforms, such as e-commerce sites, online banking, or payment gateways. Here's a high-level overview and how it's typically approached, especially from a machine learning and system design perspective: 🔍 What is Online Fraud? Online fraud can include: Credit card fraud Identity theft Phishing and scams Transaction fraud (e.g., fake refunds, unauthorized transfers) Account takeover


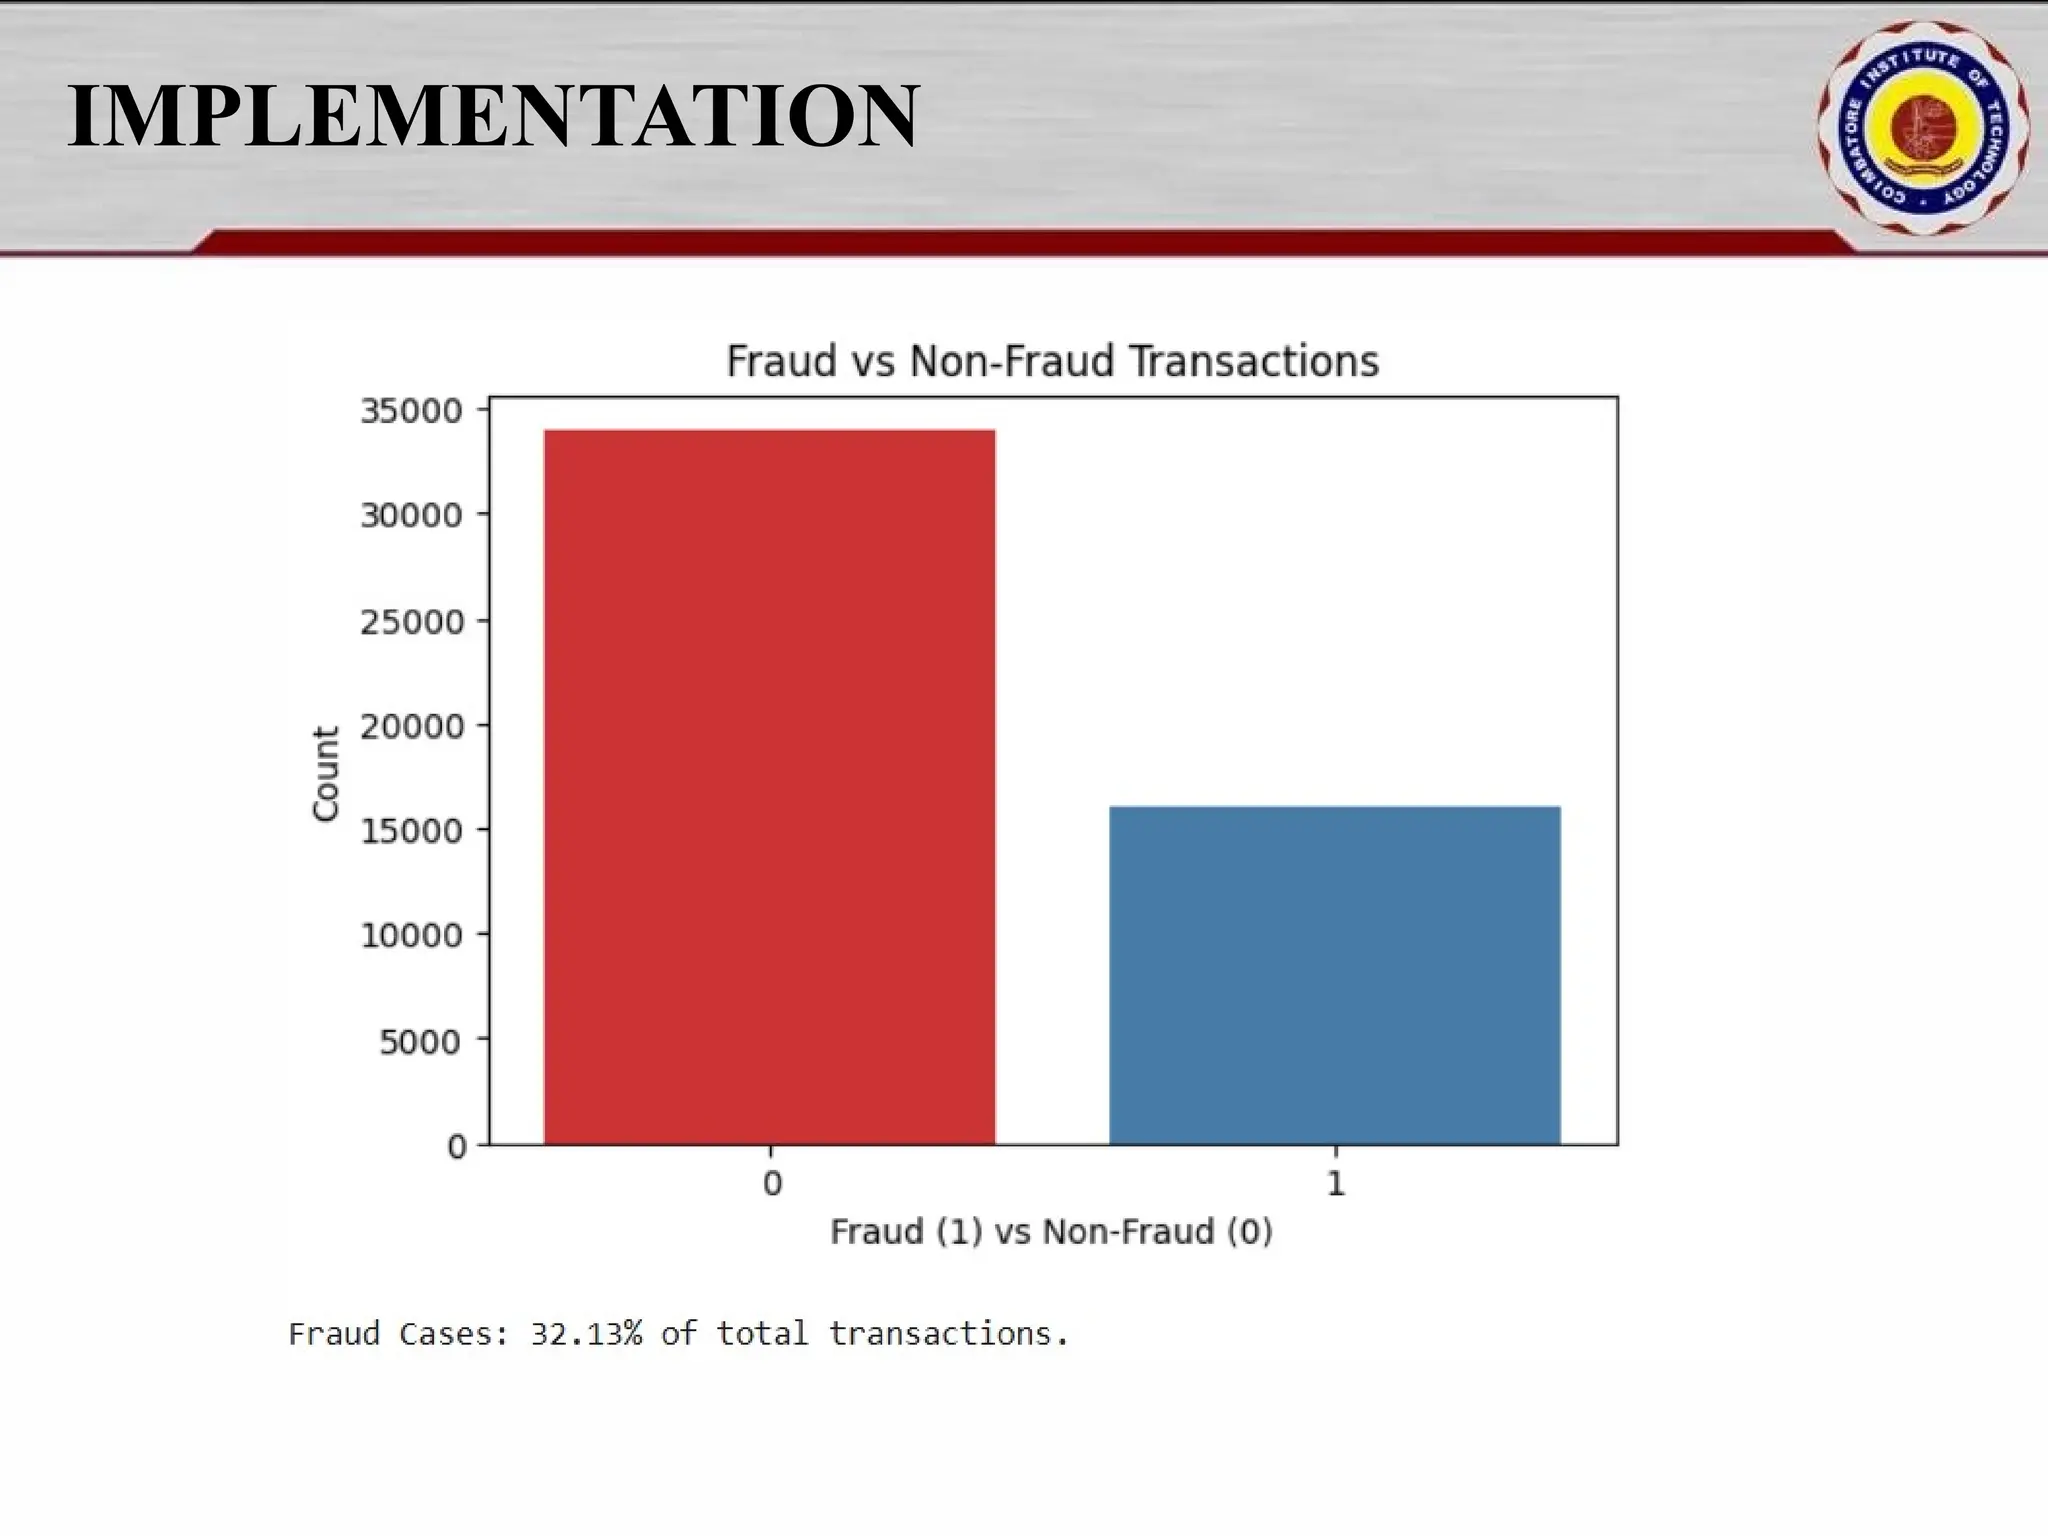
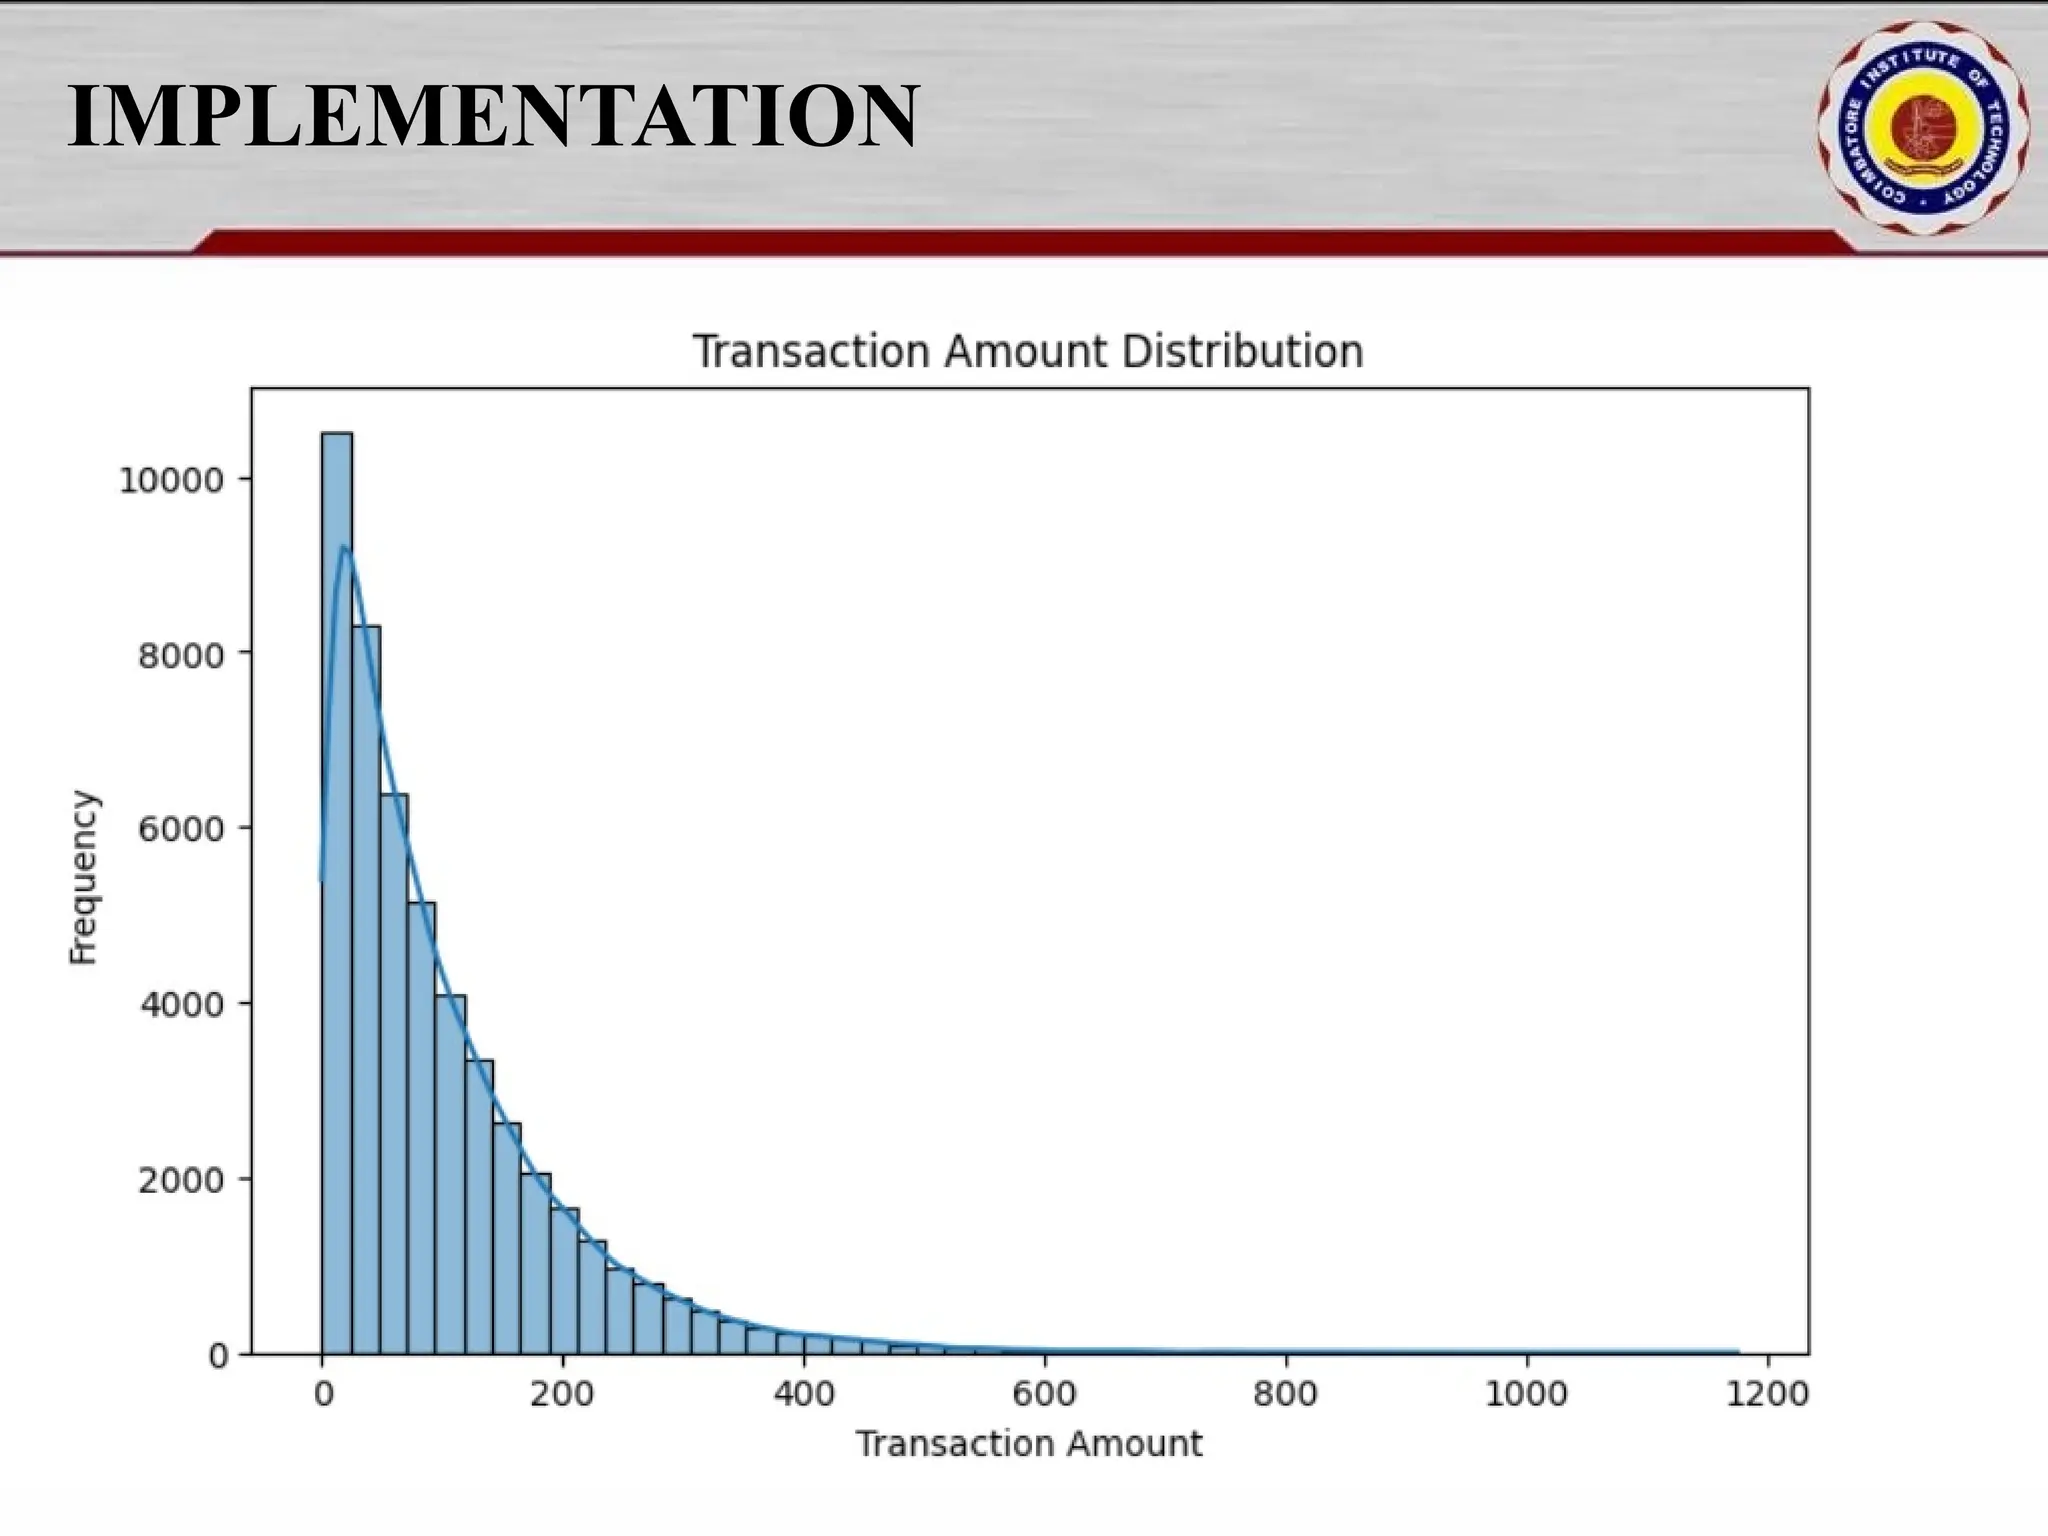
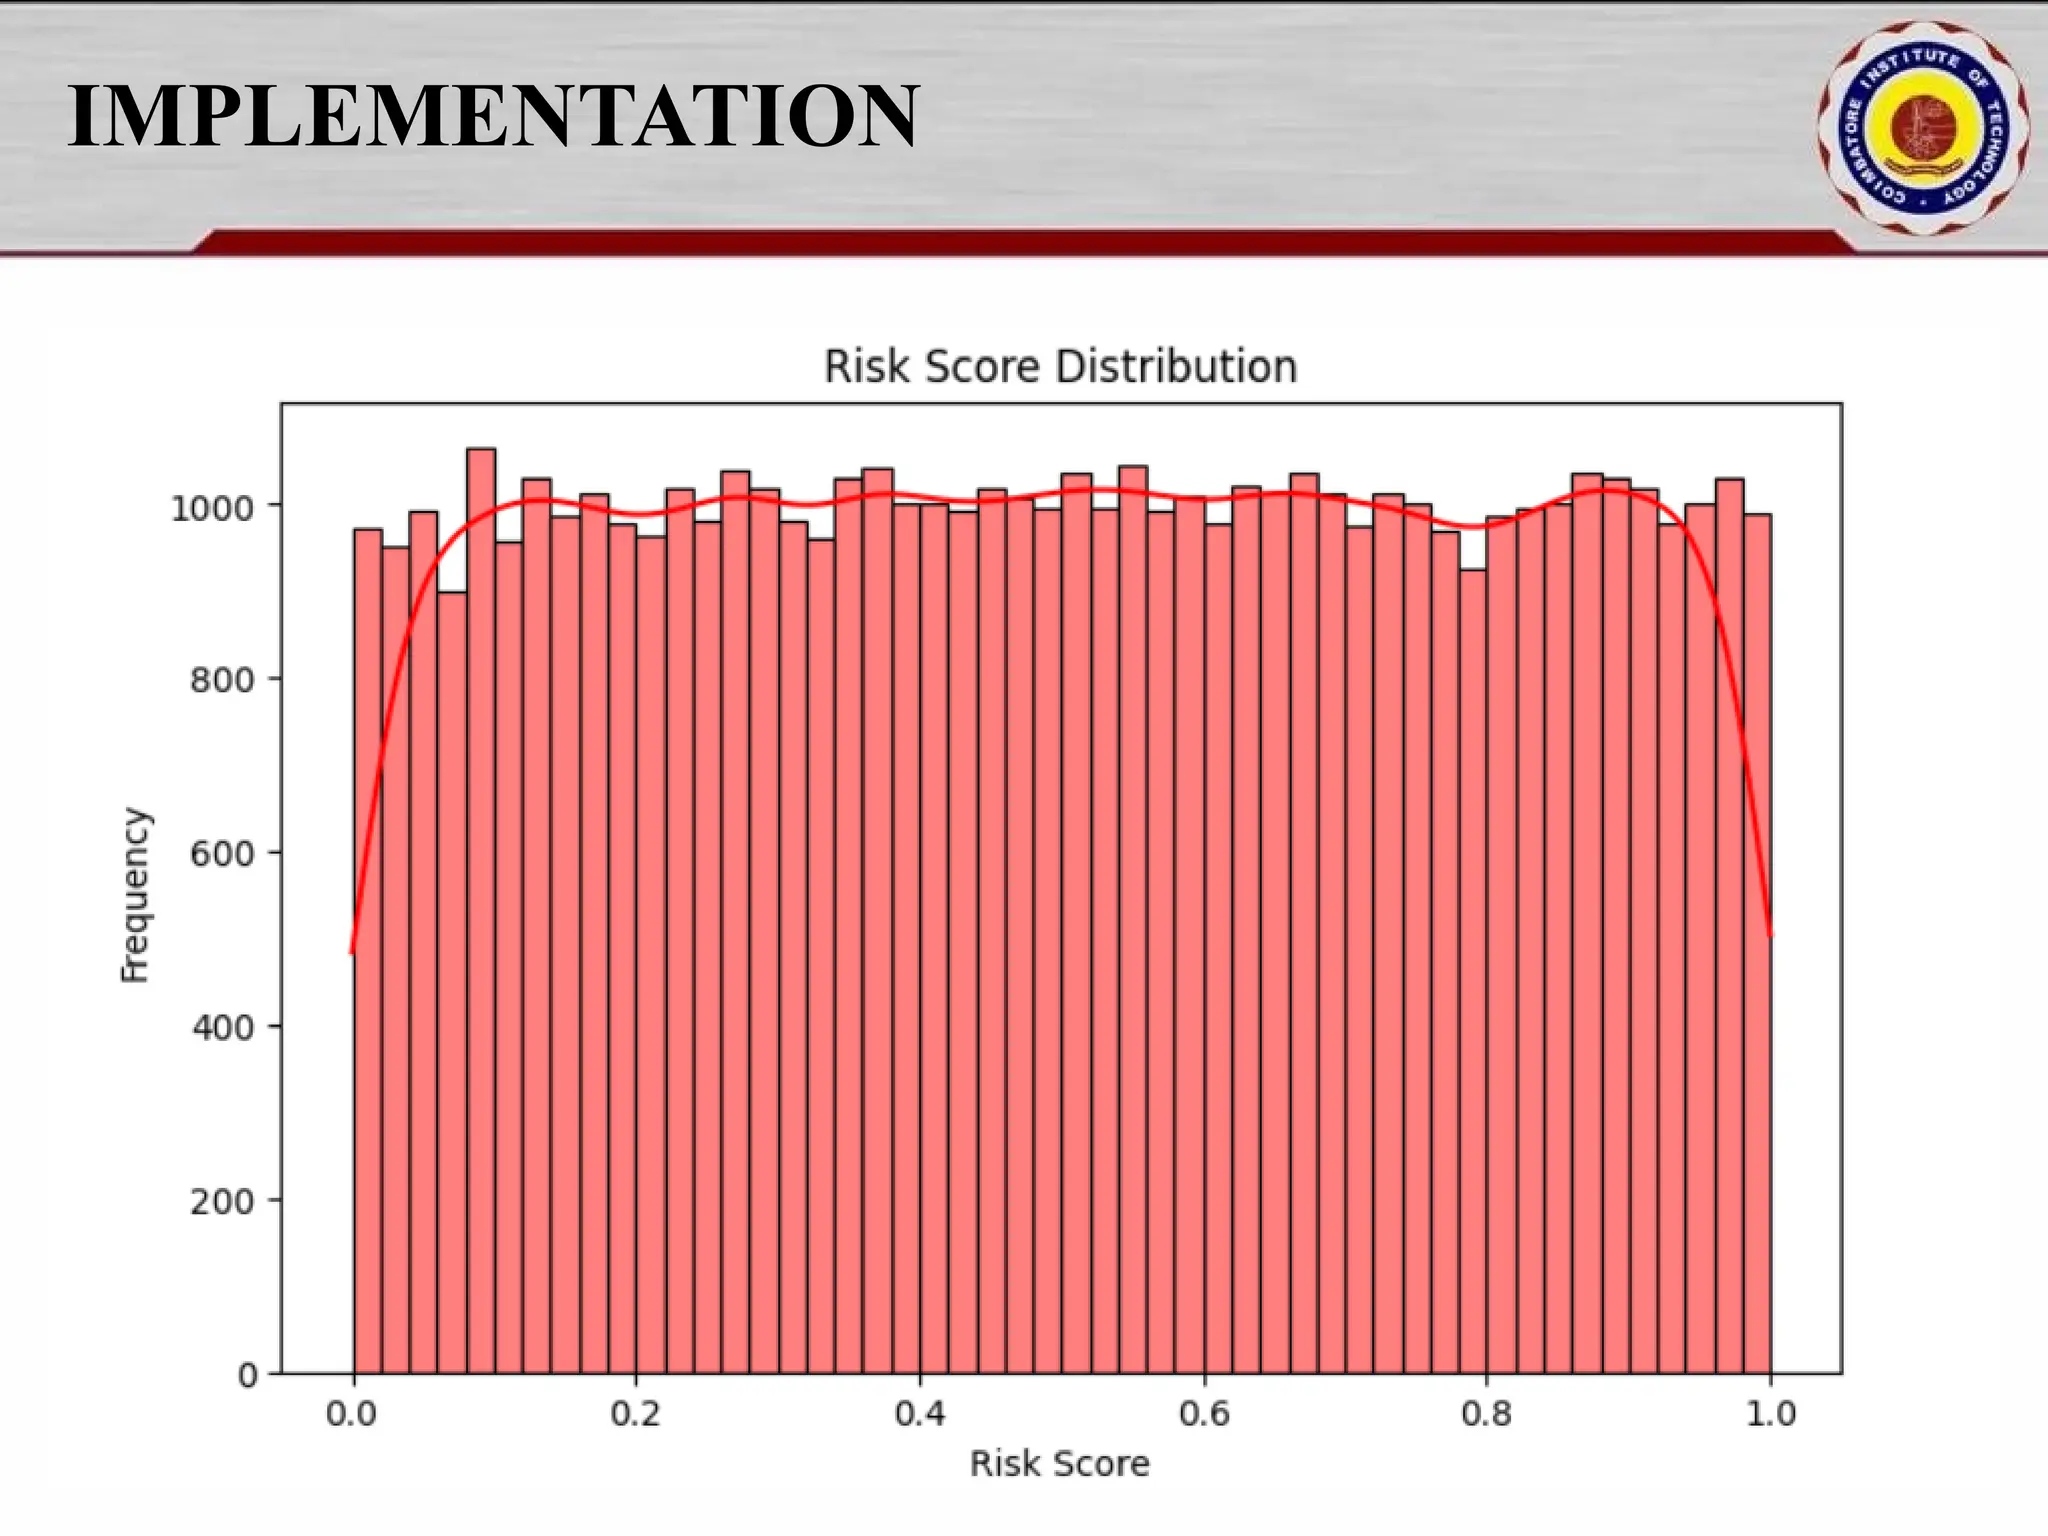
![IMPLEMENTATION fraud_percentage = df["Fraud_Label"].mean() * 100 print(f"nFraud Cases: {fraud_percentage:.2f}% of total transactions.") plt.figure(figsize=(8, 5)) sns.histplot(df["Transaction_Amount"], bins=50, kde=True) plt.title("Transaction Amount Distribution") plt.xlabel("Transaction Amount") plt.ylabel("Frequency") plt.show() plt.figure(figsize=(8, 5)) sns.histplot(df["Risk_Score"], bins=50, kde=True, color='red') plt.title("Risk Score Distribution") plt.xlabel("Risk Score") plt.ylabel("Frequency") plt.show()](https://image.slidesharecdn.com/pythonproject1-250421141954-bd5cebfc/75/PYTHON-PROJECT-1-Online-Fraud-Fraud-Detection-Cybersecurity-Anomaly-Detection-Binary-Classification-Real-Time-Detection-15-2048.jpg)
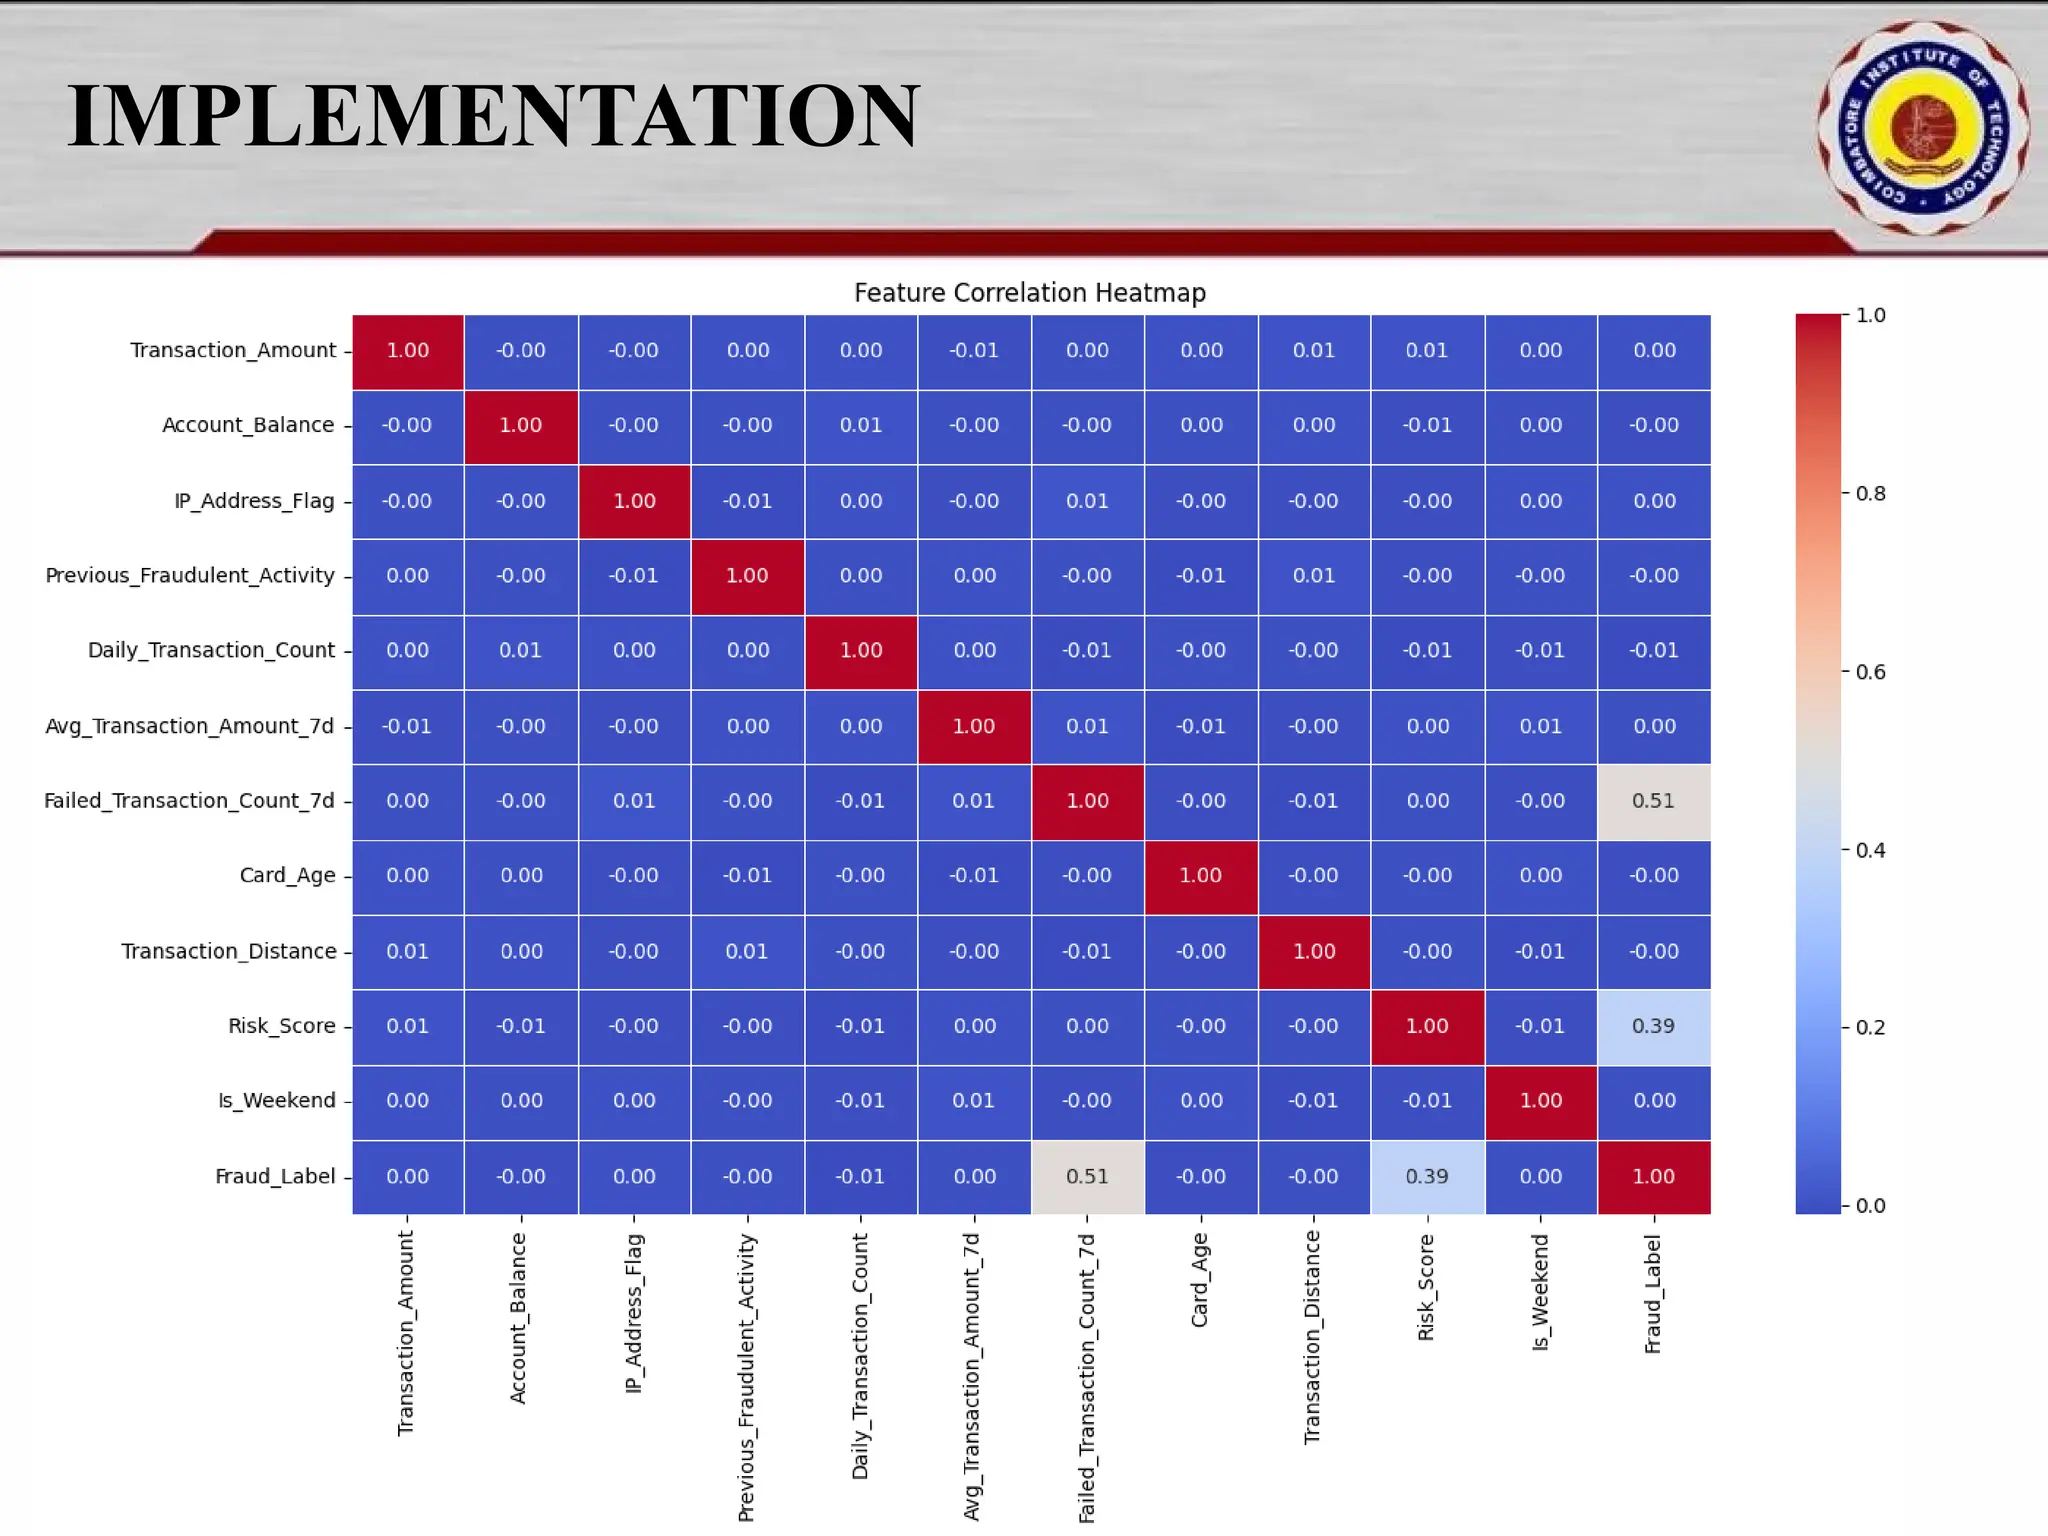
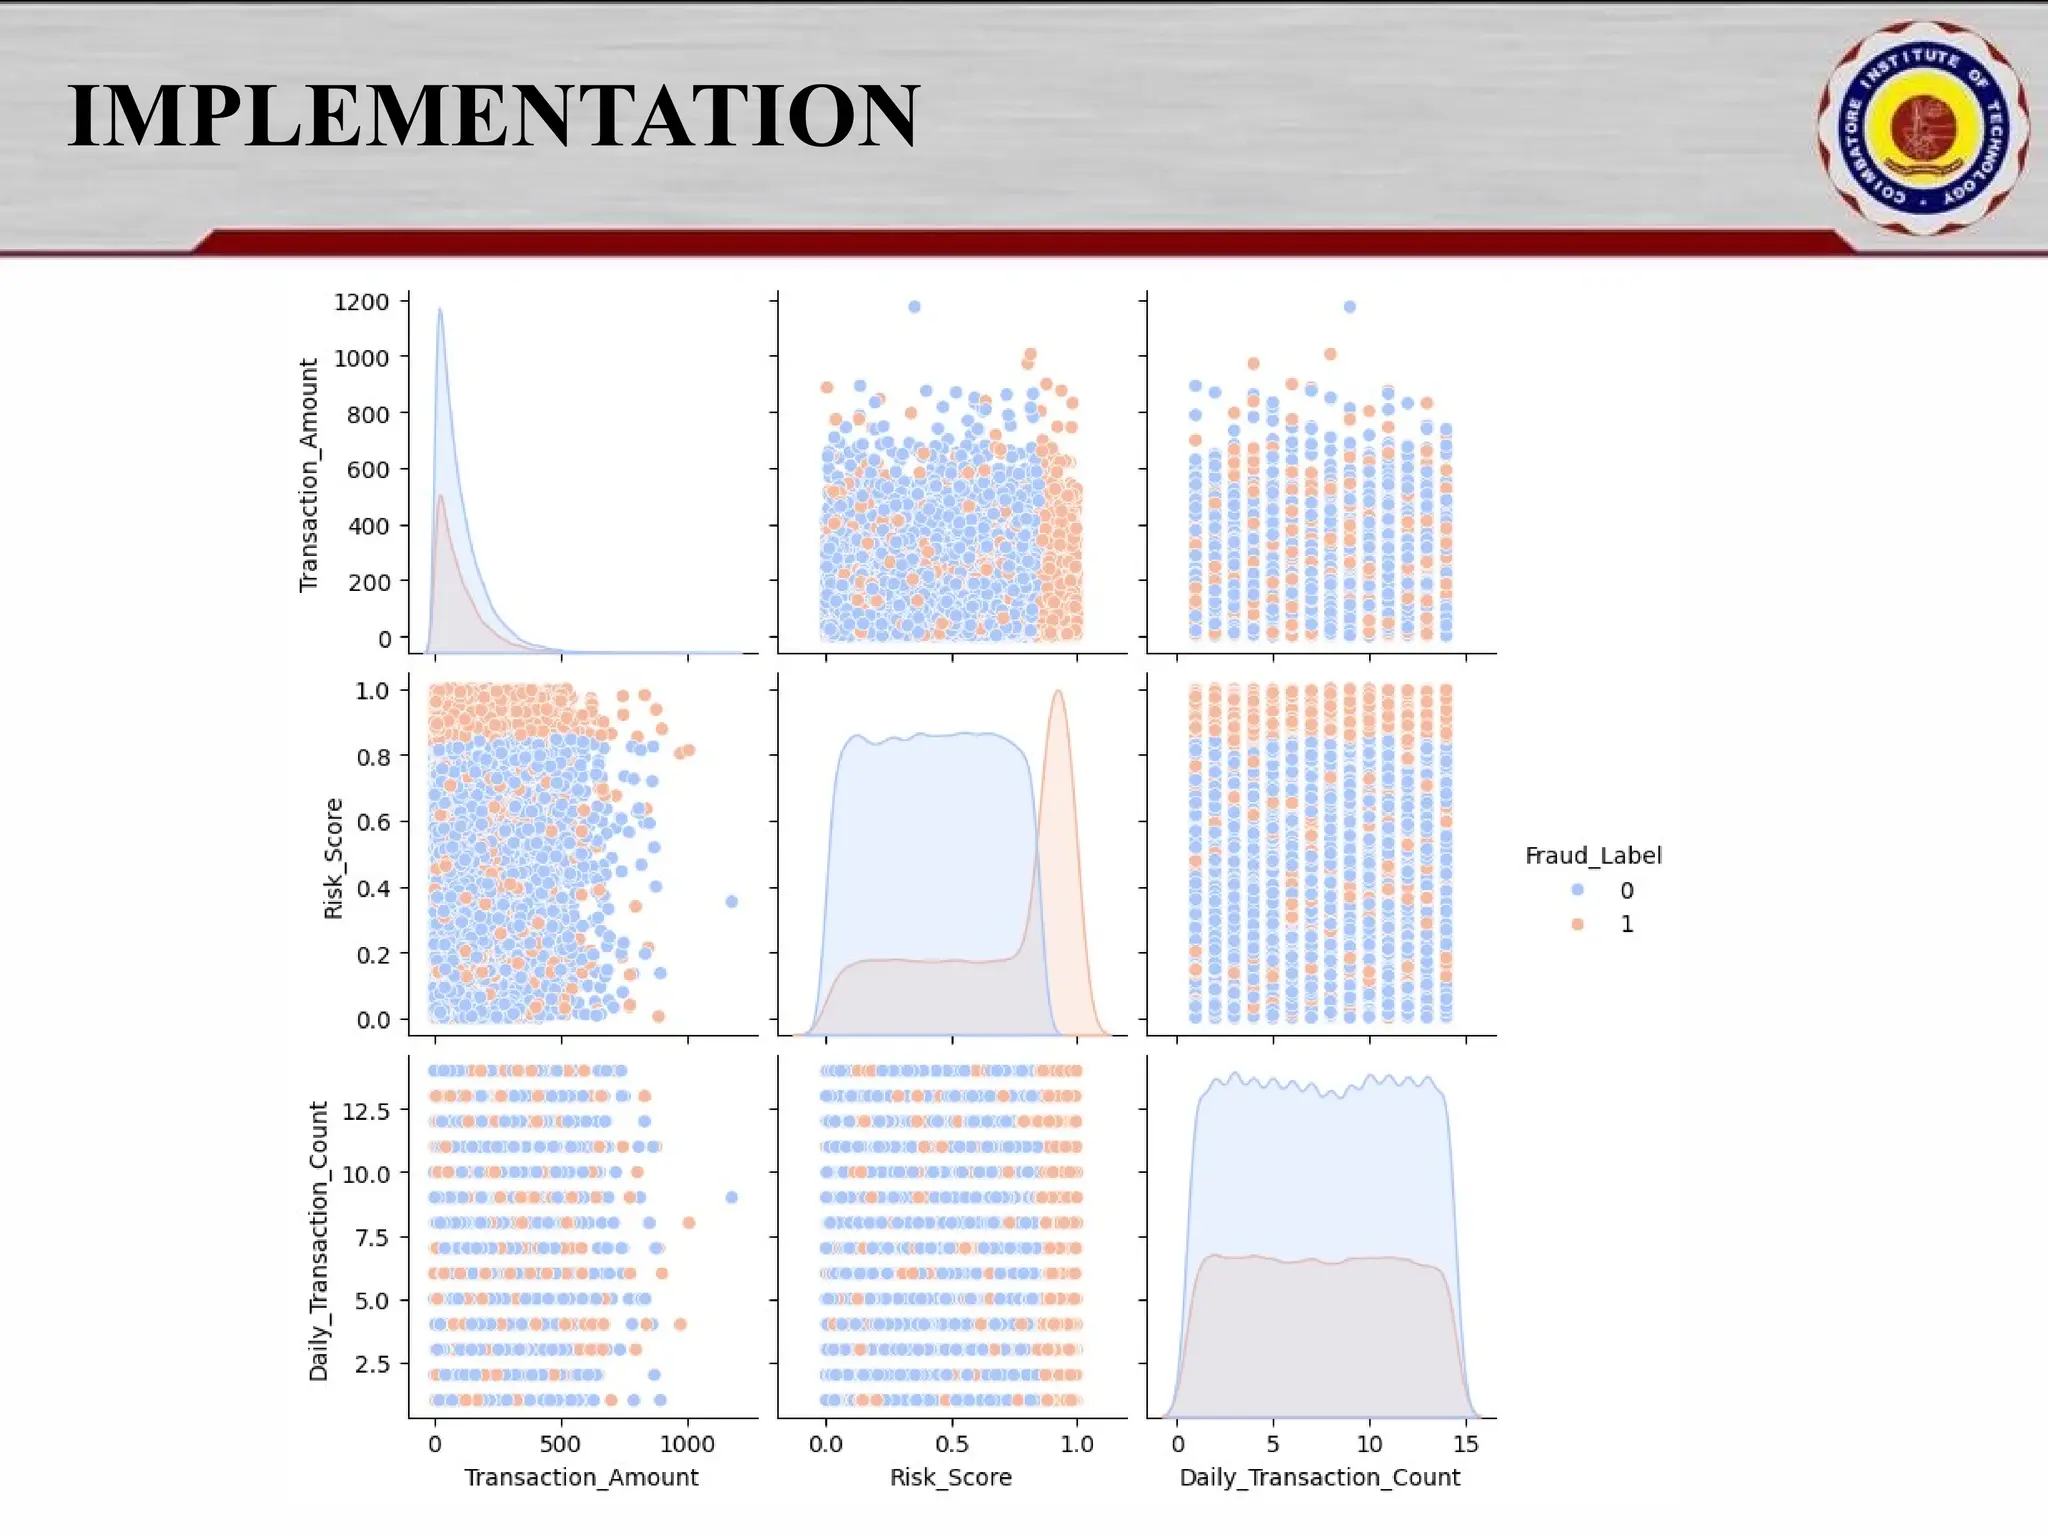
![IMPLEMENTATION numeric_cols = df.select_dtypes(include=['number']) plt.figure(figsize=(15, 8)) sns.heatmap(numeric_cols.corr(), annot=True, fmt=".2f", cmap="coolwarm", linewidths=0.5) plt.title("Feature Correlation Heatmap") plt.show() selected_features = ["Transaction_Amount", "Risk_Score", "Daily_Transaction_Count", "Fraud_Label"] sns.pairplot(df[selected_features], hue="Fraud_Label", diag_kind="kde", palette="coolwarm") plt.show()](https://image.slidesharecdn.com/pythonproject1-250421141954-bd5cebfc/75/PYTHON-PROJECT-1-Online-Fraud-Fraud-Detection-Cybersecurity-Anomaly-Detection-Binary-Classification-Real-Time-Detection-17-2048.jpg)
![IMPLEMENTATION Model_training.py import xgboost as xgb import joblib from sklearn.metrics import classification_report, confusion_matrix, roc_auc_score from xgboost import XGBClassifier import matplotlib.pyplot as plt import seaborn as sns import os from src.data_preprocessing import load_data, preprocess_data os.makedirs("models", exist_ok=True) os.makedirs("outputs", exist_ok=True) df = load_data("data/processed/cleaned_transactions.csv") df = df.drop(columns=["Risk_Score"], errors="ignore") X_train, X_test, y_train, y_test, label_col = preprocess_data(df, mode="train") model = xgb.XGBClassifier(n_estimators=100, random_state=42) model.fit(X_train, y_train) joblib.dump(model, "models/xgb_fraud_model.pkl") joblib.dump(X_train.columns.tolist(), "models/features_list.pkl") print(" Model and feature list saved to 'models/' directory") y_pred = model.predict(X_test) print("n Classification Report:n", classification_report(y_test, y_pred)) print("n Confusion Matrix:n", confusion_matrix(y_test, y_pred)) roc_score = roc_auc_score(y_test, model.predict_proba(X_test)[:, 1])](https://image.slidesharecdn.com/pythonproject1-250421141954-bd5cebfc/75/PYTHON-PROJECT-1-Online-Fraud-Fraud-Detection-Cybersecurity-Anomaly-Detection-Binary-Classification-Real-Time-Detection-18-2048.jpg)
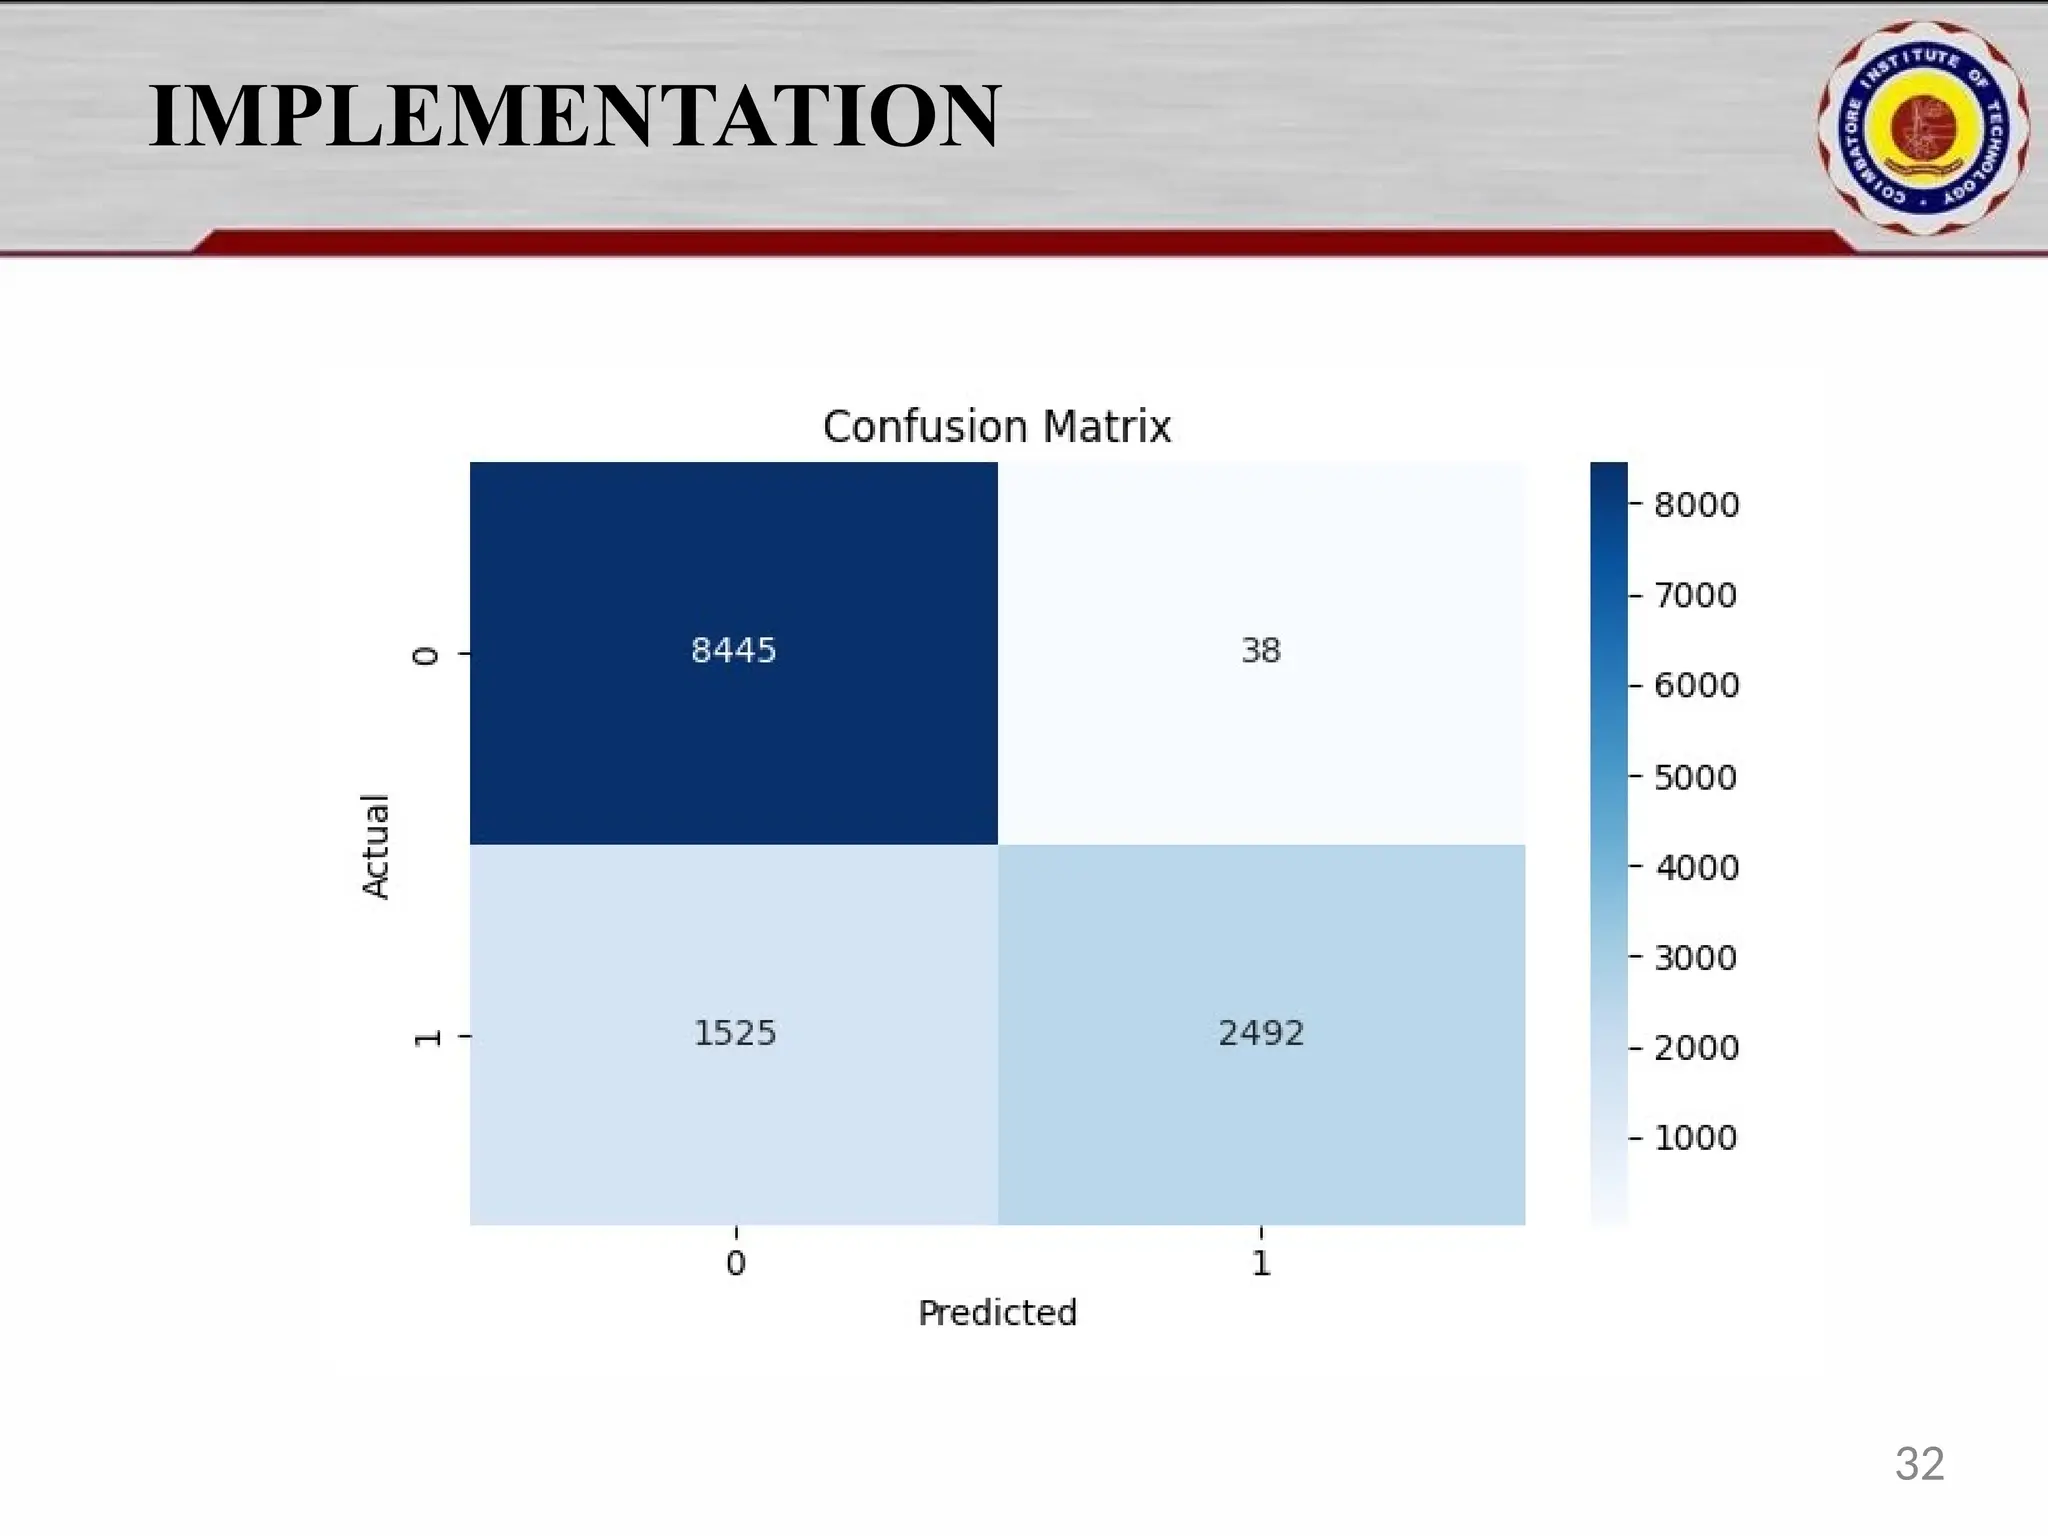
![IMPLEMENTAION print(f"n ROC AUC Score: {roc_score:.4f}") plt.figure(figsize=(6, 4)) sns.heatmap(confusion_matrix(y_test, y_pred), annot=True, fmt='d', cmap='Blues') plt.title("Confusion Matrix") plt.xlabel("Predicted") plt.ylabel("Actual") plt.tight_layout() plt.savefig("outputs/conf_matrix.png") print(" Confusion matrix saved to outputs/conf_matrix.png") def train_xgboost(X_train, y_train, X_test, y_test): model = XGBClassifier(eval_metric='logloss') eval_set = [(X_train, y_train), (X_test, y_test)] model.fit( X_train, y_train, eval_set=eval_set, verbose=True ) model_path = "models/xgb_fraud_model.pkl" joblib.dump(model, model_path) print(f"Model saved to {model_path}") return model 19](https://image.slidesharecdn.com/pythonproject1-250421141954-bd5cebfc/75/PYTHON-PROJECT-1-Online-Fraud-Fraud-Detection-Cybersecurity-Anomaly-Detection-Binary-Classification-Real-Time-Detection-19-2048.jpg)
![IMPLEMENTATION Evaluation.py import os import joblib import matplotlib.pyplot as plt import seaborn as sns from sklearn.metrics import classification_report, confusion_matrix, roc_auc_score from sklearn.model_selection import learning_curve def evaluate_model(model, X_train, y_train, X_test, y_test): y_pred = model.predict(X_test) y_proba = model.predict_proba(X_test)[:, 1] print("n Classification Report:n", classification_report(y_test, y_pred)) cm = confusion_matrix(y_test, y_pred) print("n Confusion Matrix:n", cm) roc_score = roc_auc_score(y_test, y_proba) print(f"n ROC AUC Score: {roc_score:.4f}") plot_learning_curve(model, X_train, y_train) return y_pred def plot_confusion_matrix(y_test, y_pred, output_path="outputs/conf_matrix.png"): cm = confusion_matrix(y_test, y_pred) plt.figure(figsize=(6, 4)) sns.heatmap(cm, annot=True, fmt='d', cmap='Blues') plt.title("Confusion Matrix") plt.xlabel("Predicted")](https://image.slidesharecdn.com/pythonproject1-250421141954-bd5cebfc/75/PYTHON-PROJECT-1-Online-Fraud-Fraud-Detection-Cybersecurity-Anomaly-Detection-Binary-Classification-Real-Time-Detection-20-2048.jpg)
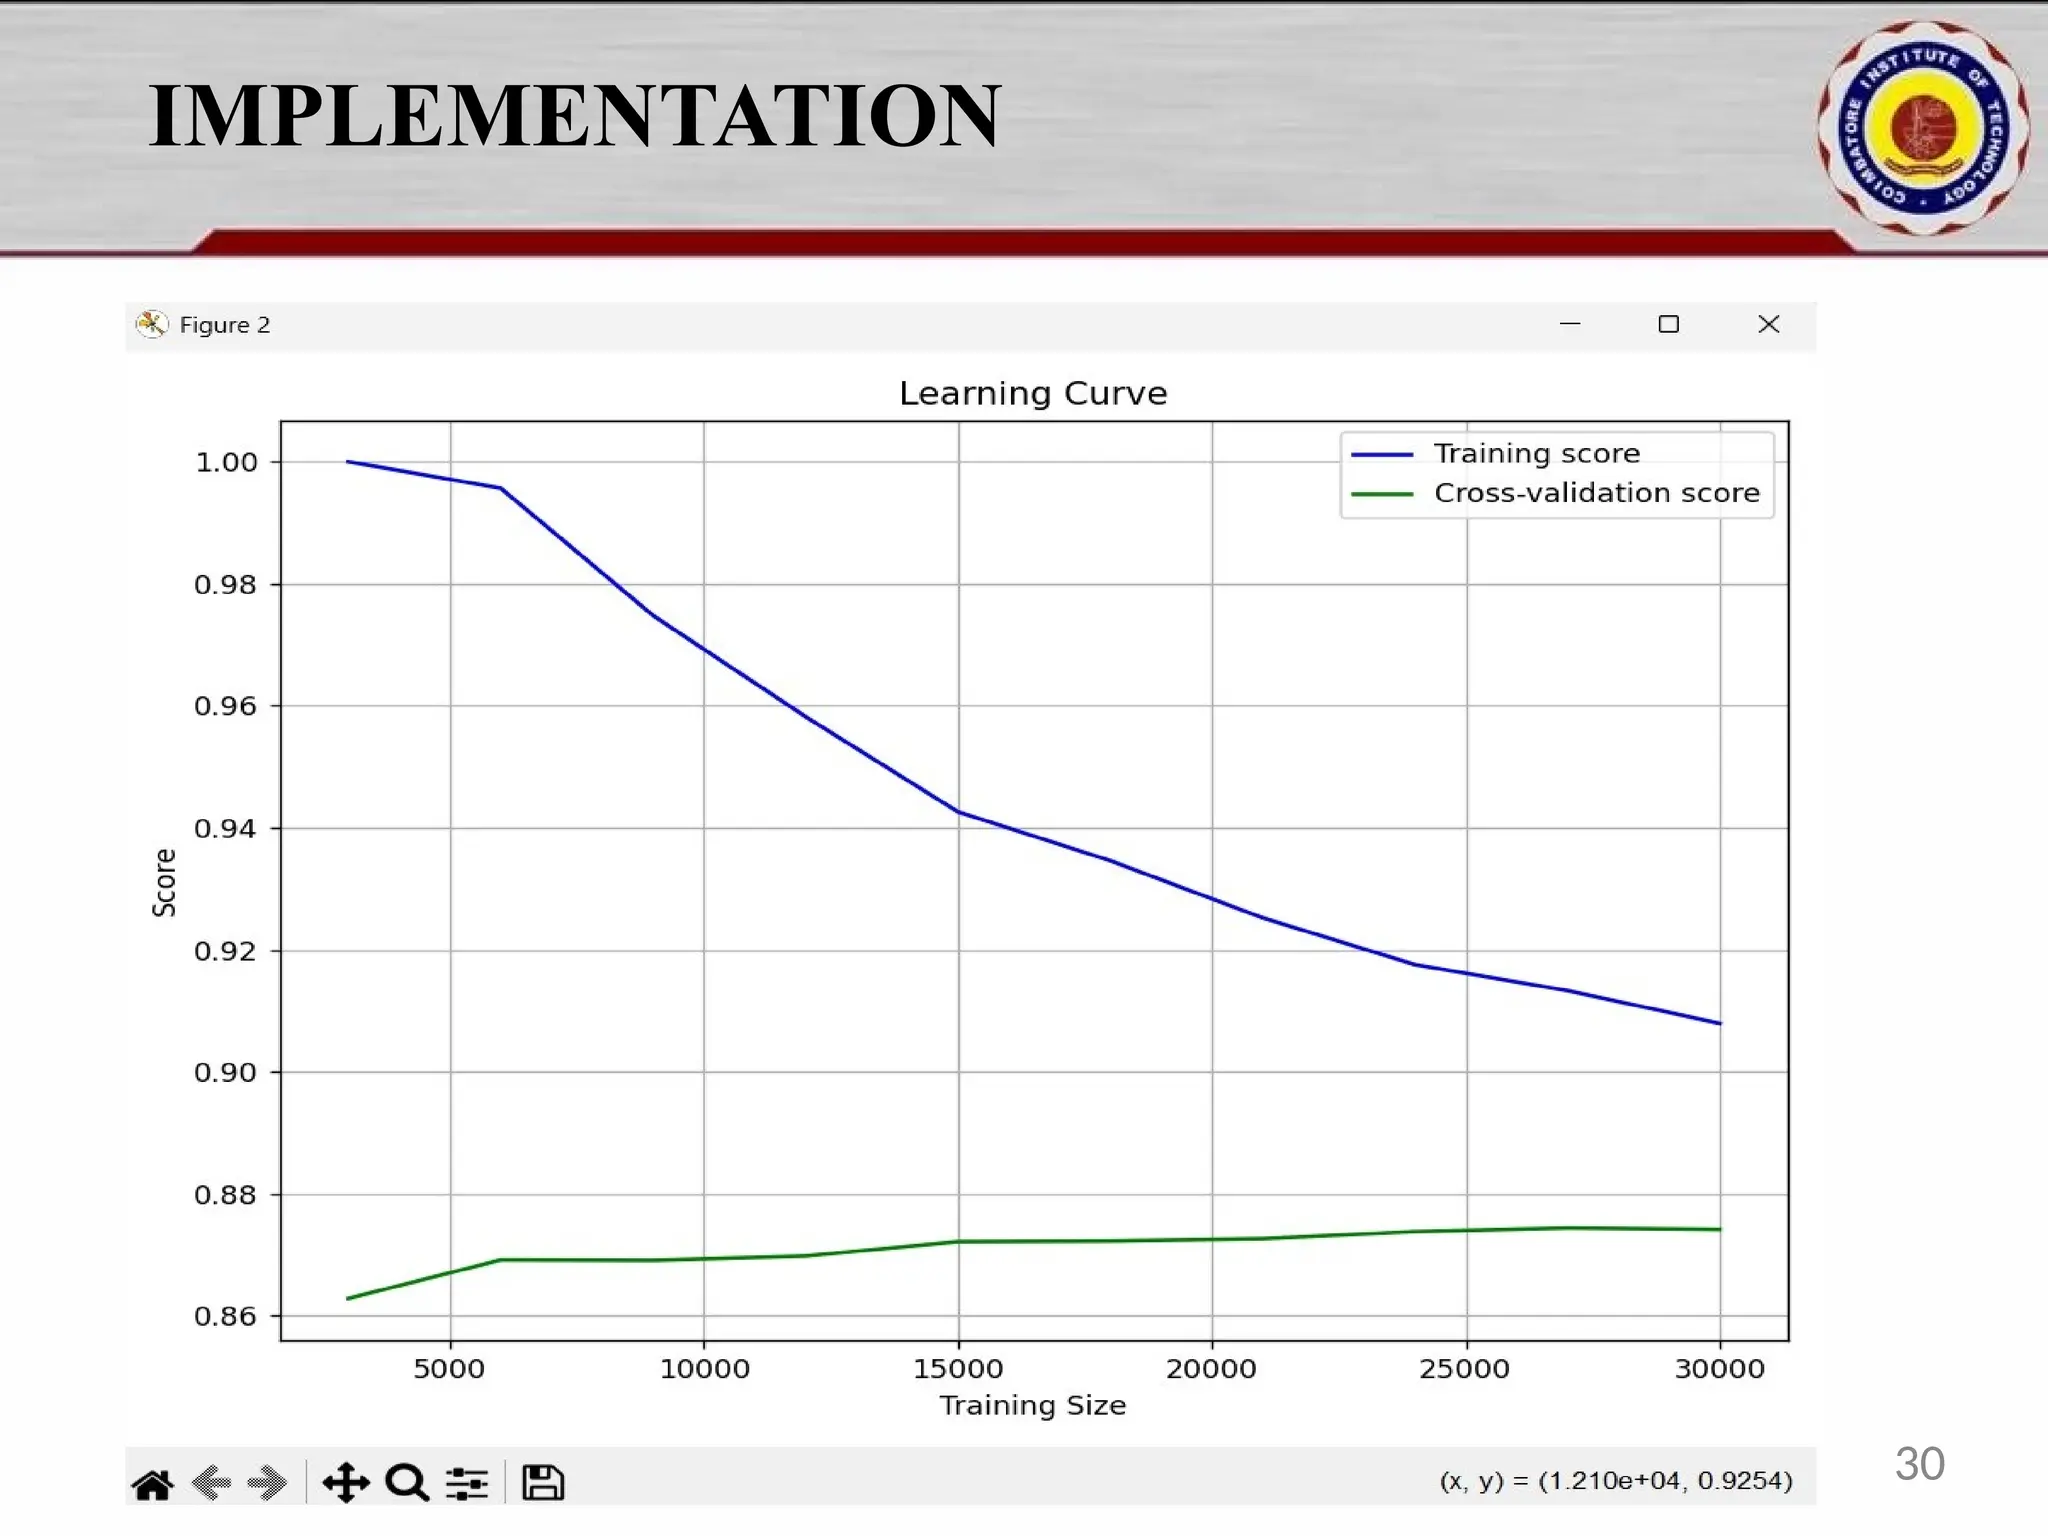
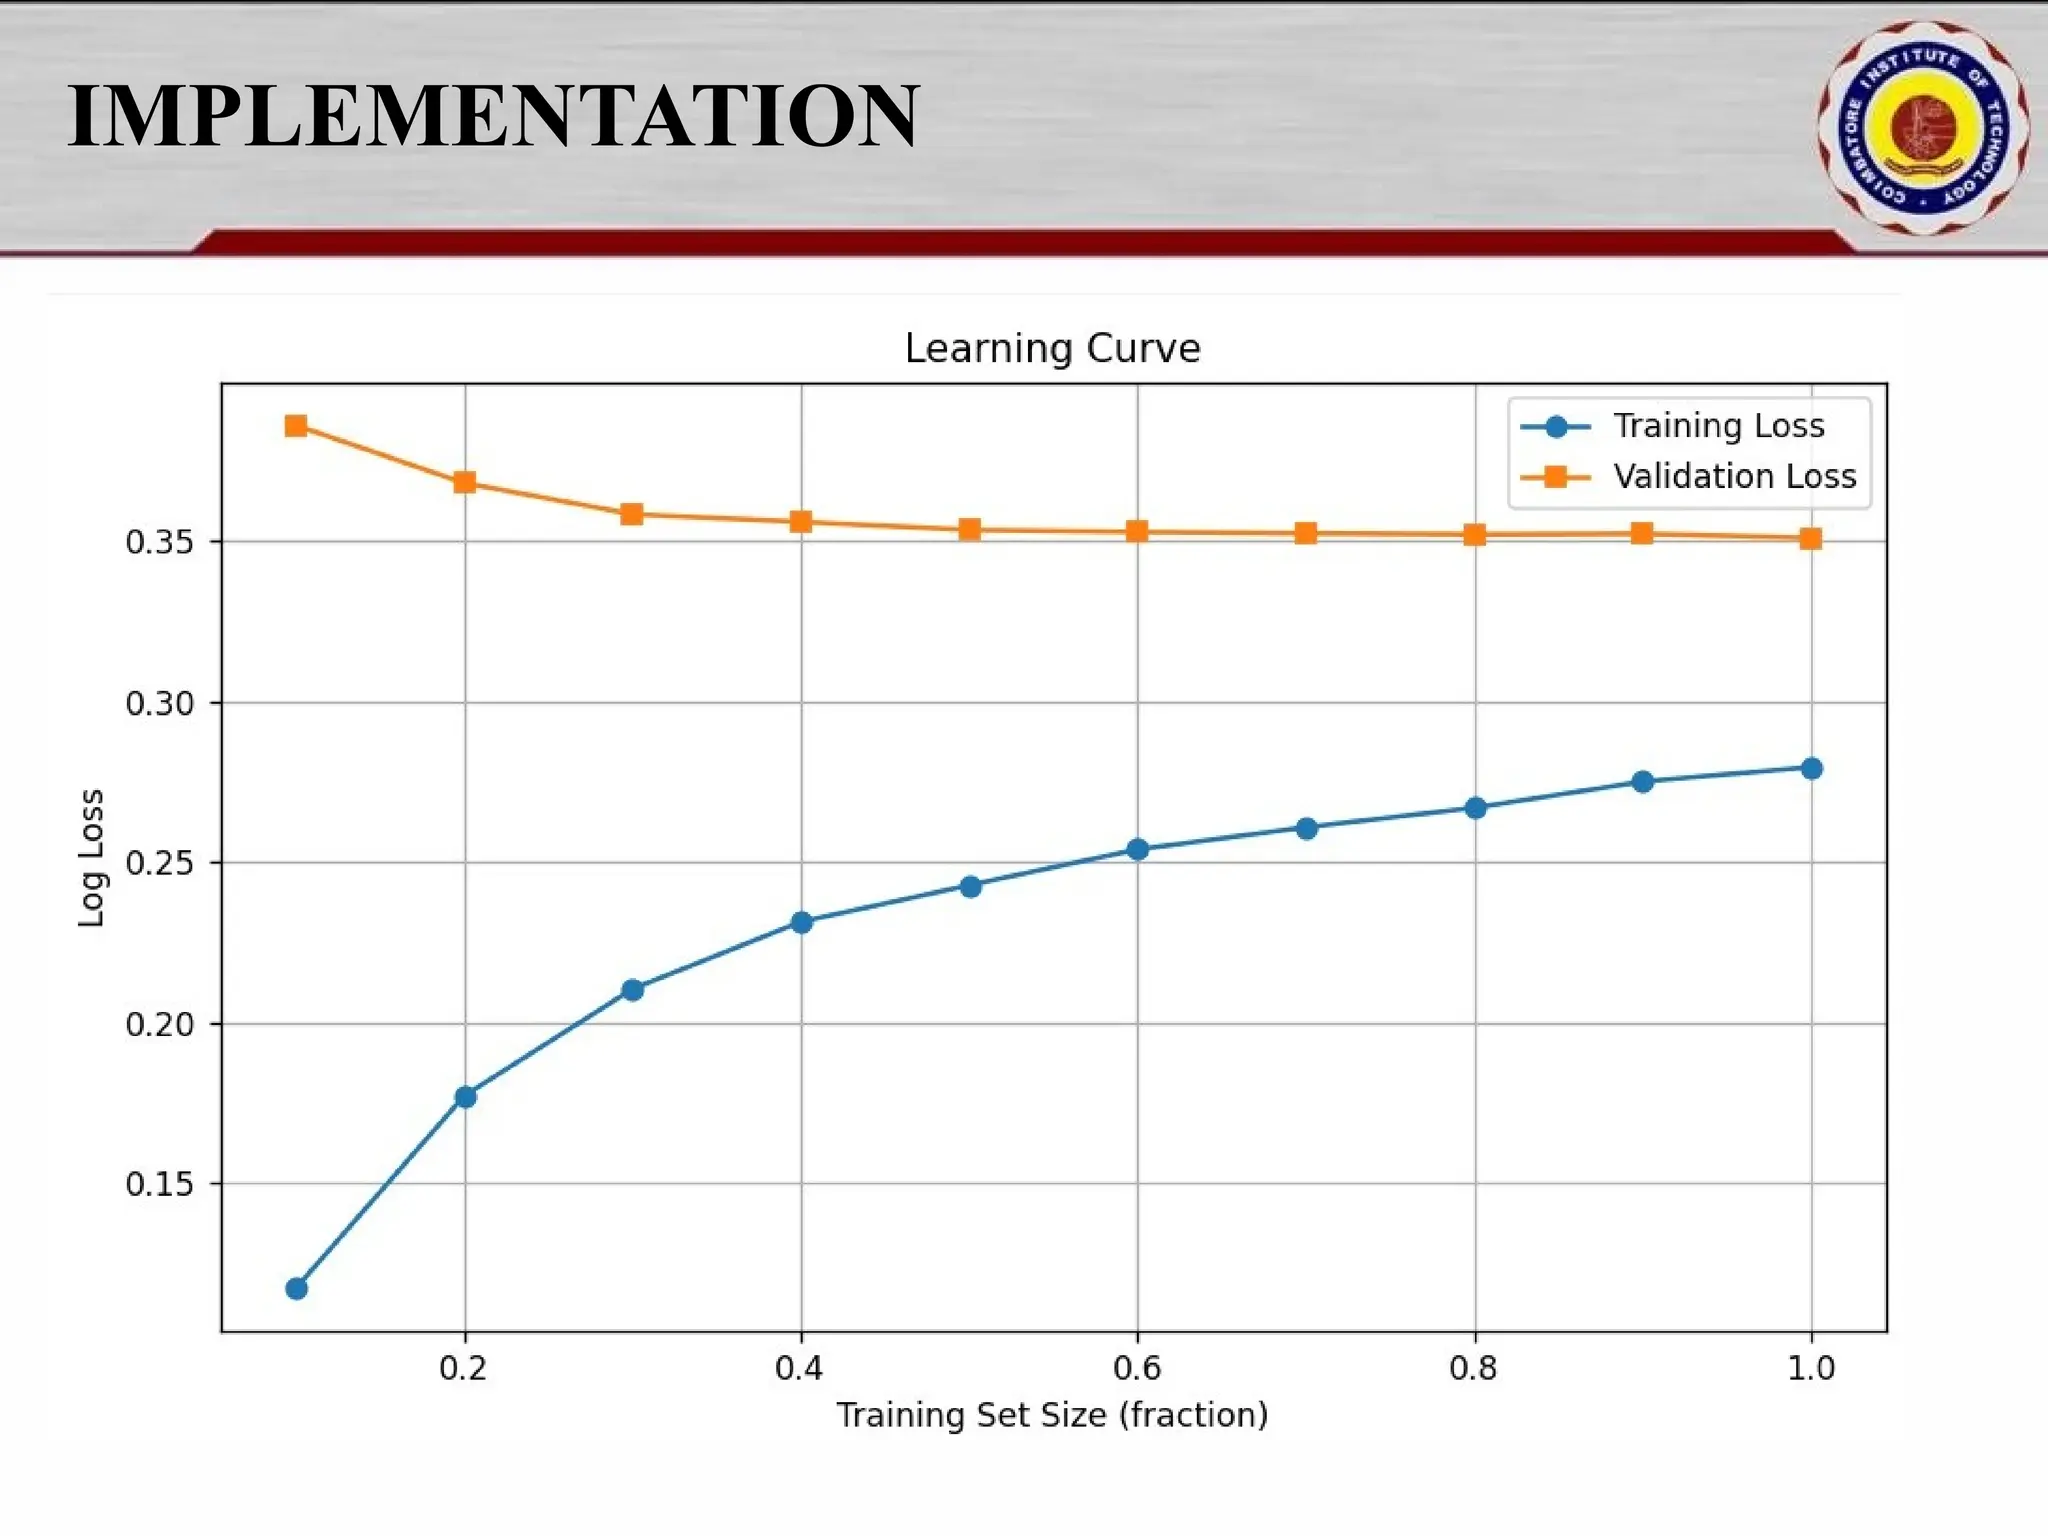
![IMPLEMENTATION plt.ylabel("Actual") plt.tight_layout() os.makedirs(os.path.dirname(output_path), exist_ok=True) plt.savefig(output_path) print(f" Confusion matrix saved to {output_path}") def plot_learning_curve(model, X_train, y_train): train_sizes, train_scores, test_scores = learning_curve( model, X_train, y_train, cv=5, n_jobs=-1, train_sizes=[0.1, 0.2, 0.3, 0.4, 0.5, 0.6, 0.7, 0.8, 0.9, 1.0] ) train_mean = train_scores.mean(axis=1) test_mean = test_scores.mean(axis=1) plt.figure(figsize=(8, 6)) plt.plot(train_sizes, train_mean, label="Training score", color="blue") plt.plot(train_sizes, test_mean, label="Cross-validation score", color="green") plt.xlabel("Training Size") plt.ylabel("Score") plt.title("Learning Curve") plt.legend(loc="best") plt.grid(True) plt.tight_layout() os.makedirs("outputs", exist_ok=True) learning_curve_path = "outputs/learning_curve.png" plt.savefig(learning_curve_path) print(f" Learning curve saved to {learning_curve_path}") plt.show() 21](https://image.slidesharecdn.com/pythonproject1-250421141954-bd5cebfc/75/PYTHON-PROJECT-1-Online-Fraud-Fraud-Detection-Cybersecurity-Anomaly-Detection-Binary-Classification-Real-Time-Detection-21-2048.jpg)