What will youlearn? - Getting Data into Power BI - Data Transformation & Preparation - DAX Fundamentals - Solving business problem with Power BI - Visualization in Power BI
3.
Introduction to PowerBI Microsoft Power BI is a business intelligence tool created by Microsoft that helps understand trends and derive insights from your data so that you can make tactical and strategic business decisions. They also help you identify patterns in the mountains of data your business builds up
4.
Power BI Versions PowerBI has a wide range of versions to satisfy business needs. •Power BI Desktop: this is a free application you install on a local computer that lets you connect to, transform, and visualize your data. With Power BI Desktop, you can connect to multiple different sources of data, and combine them (often called modeling) into a data model. •Power BI Service: this is a cloud-based service or software as a service (SaaS). It supports report editing and collaboration for teams and organizations. You can connect to data sources in the Power BI service, too, but modeling is limited (until May 2023 Update, you can now perform data modelling in PBI Service). •Power BI Report Server: Power BI Report Server is an on-premises report server with a web portal in which you display and manage reports and KPIs. Along with it come the tools to create Power BI reports, paginated reports, mobile reports, and KPIs. Your users can access those reports in different ways: viewing them in a web browser or mobile device, or as an email in their inbox •Power BI Mobile: Power BI offers a set of mobile apps for iOS, Android, and Windows mobile devices. In the mobile apps, you connect to and interact with your cloud and on-premises reports.
5.
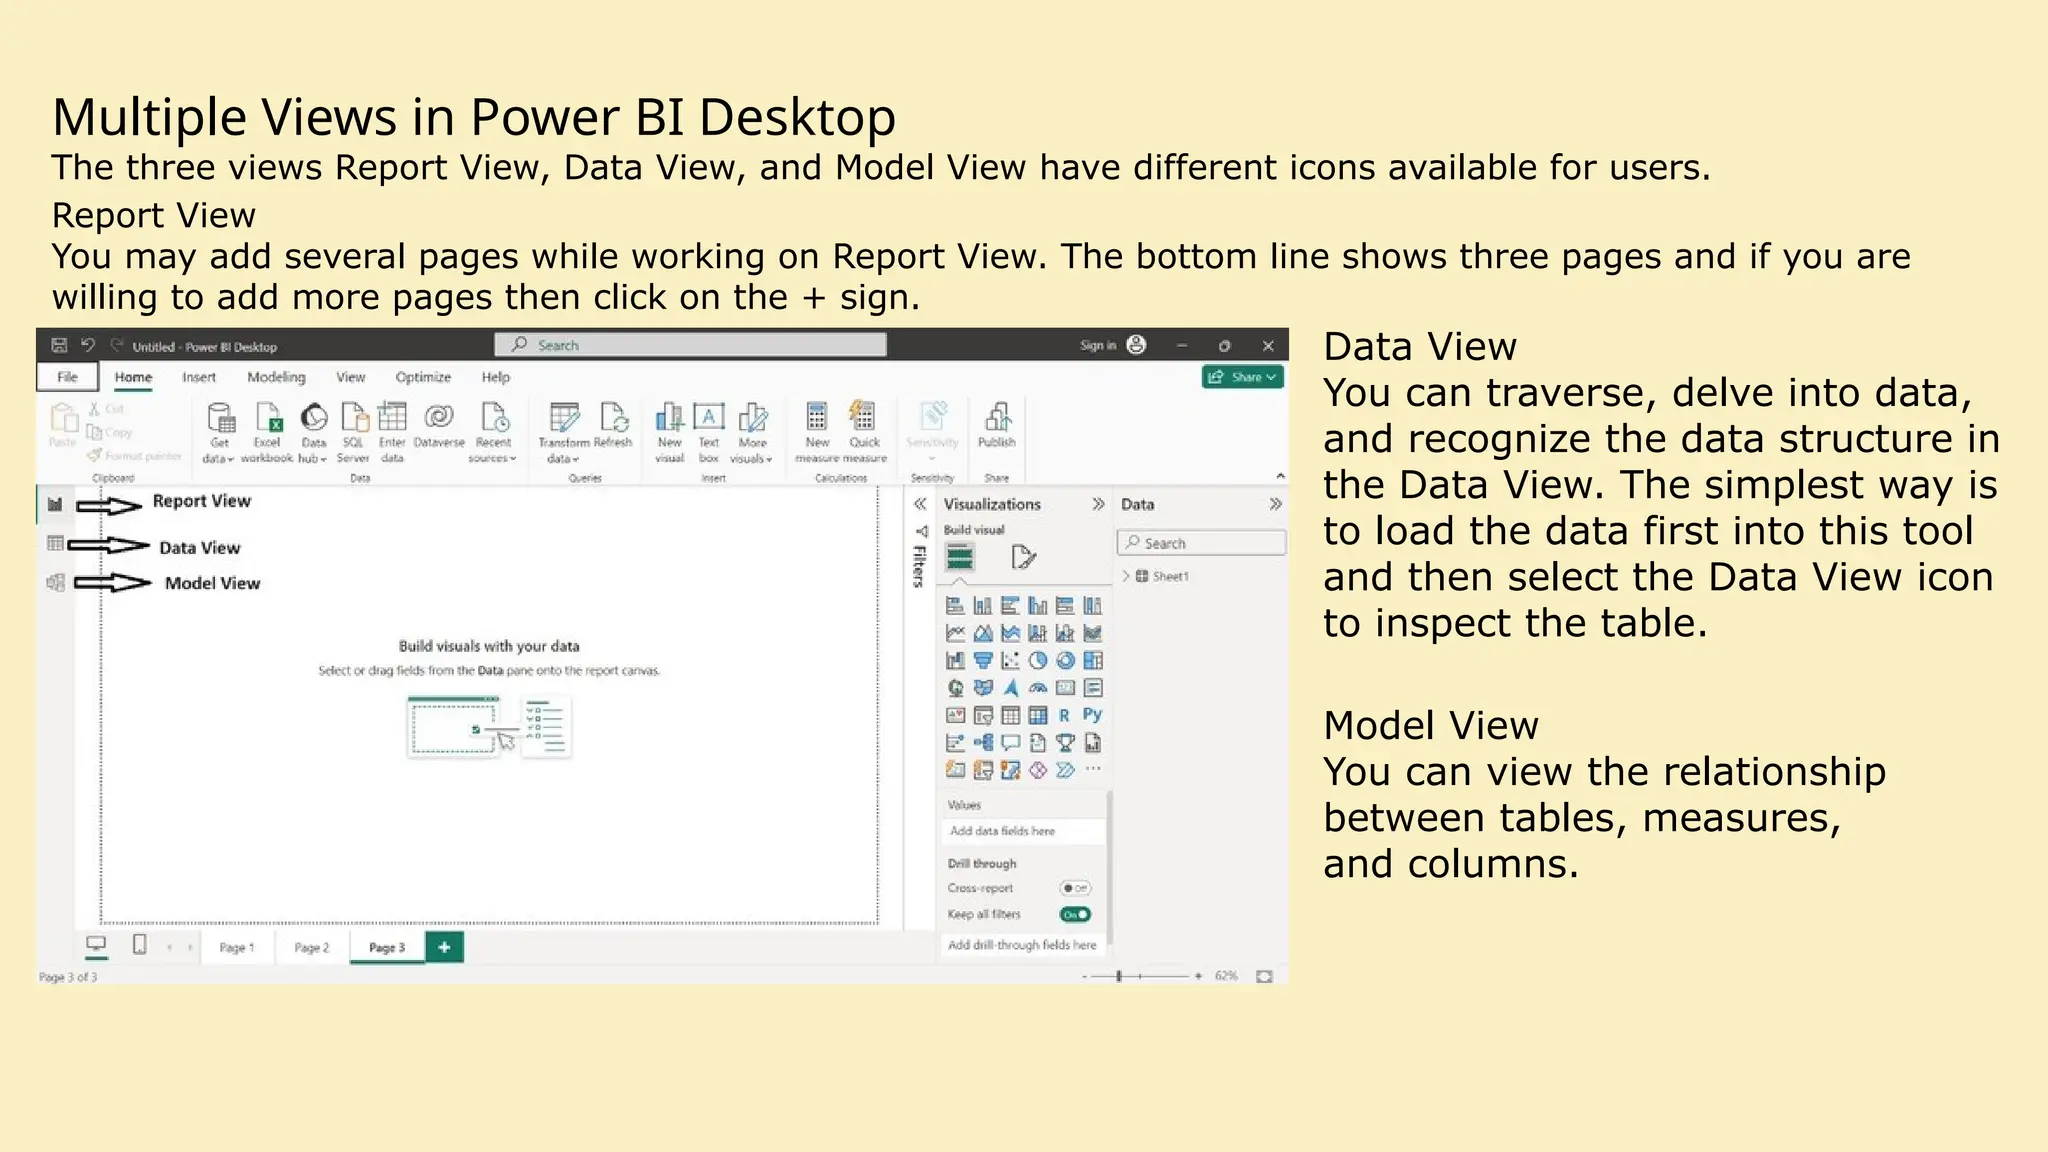
Multiple Views inPower BI Desktop The three views Report View, Data View, and Model View have different icons available for users. Report View You may add several pages while working on Report View. The bottom line shows three pages and if you are willing to add more pages then click on the + sign. Data View You can traverse, delve into data, and recognize the data structure in the Data View. The simplest way is to load the data first into this tool and then select the Data View icon to inspect the table. Model View You can view the relationship between tables, measures, and columns.
6.
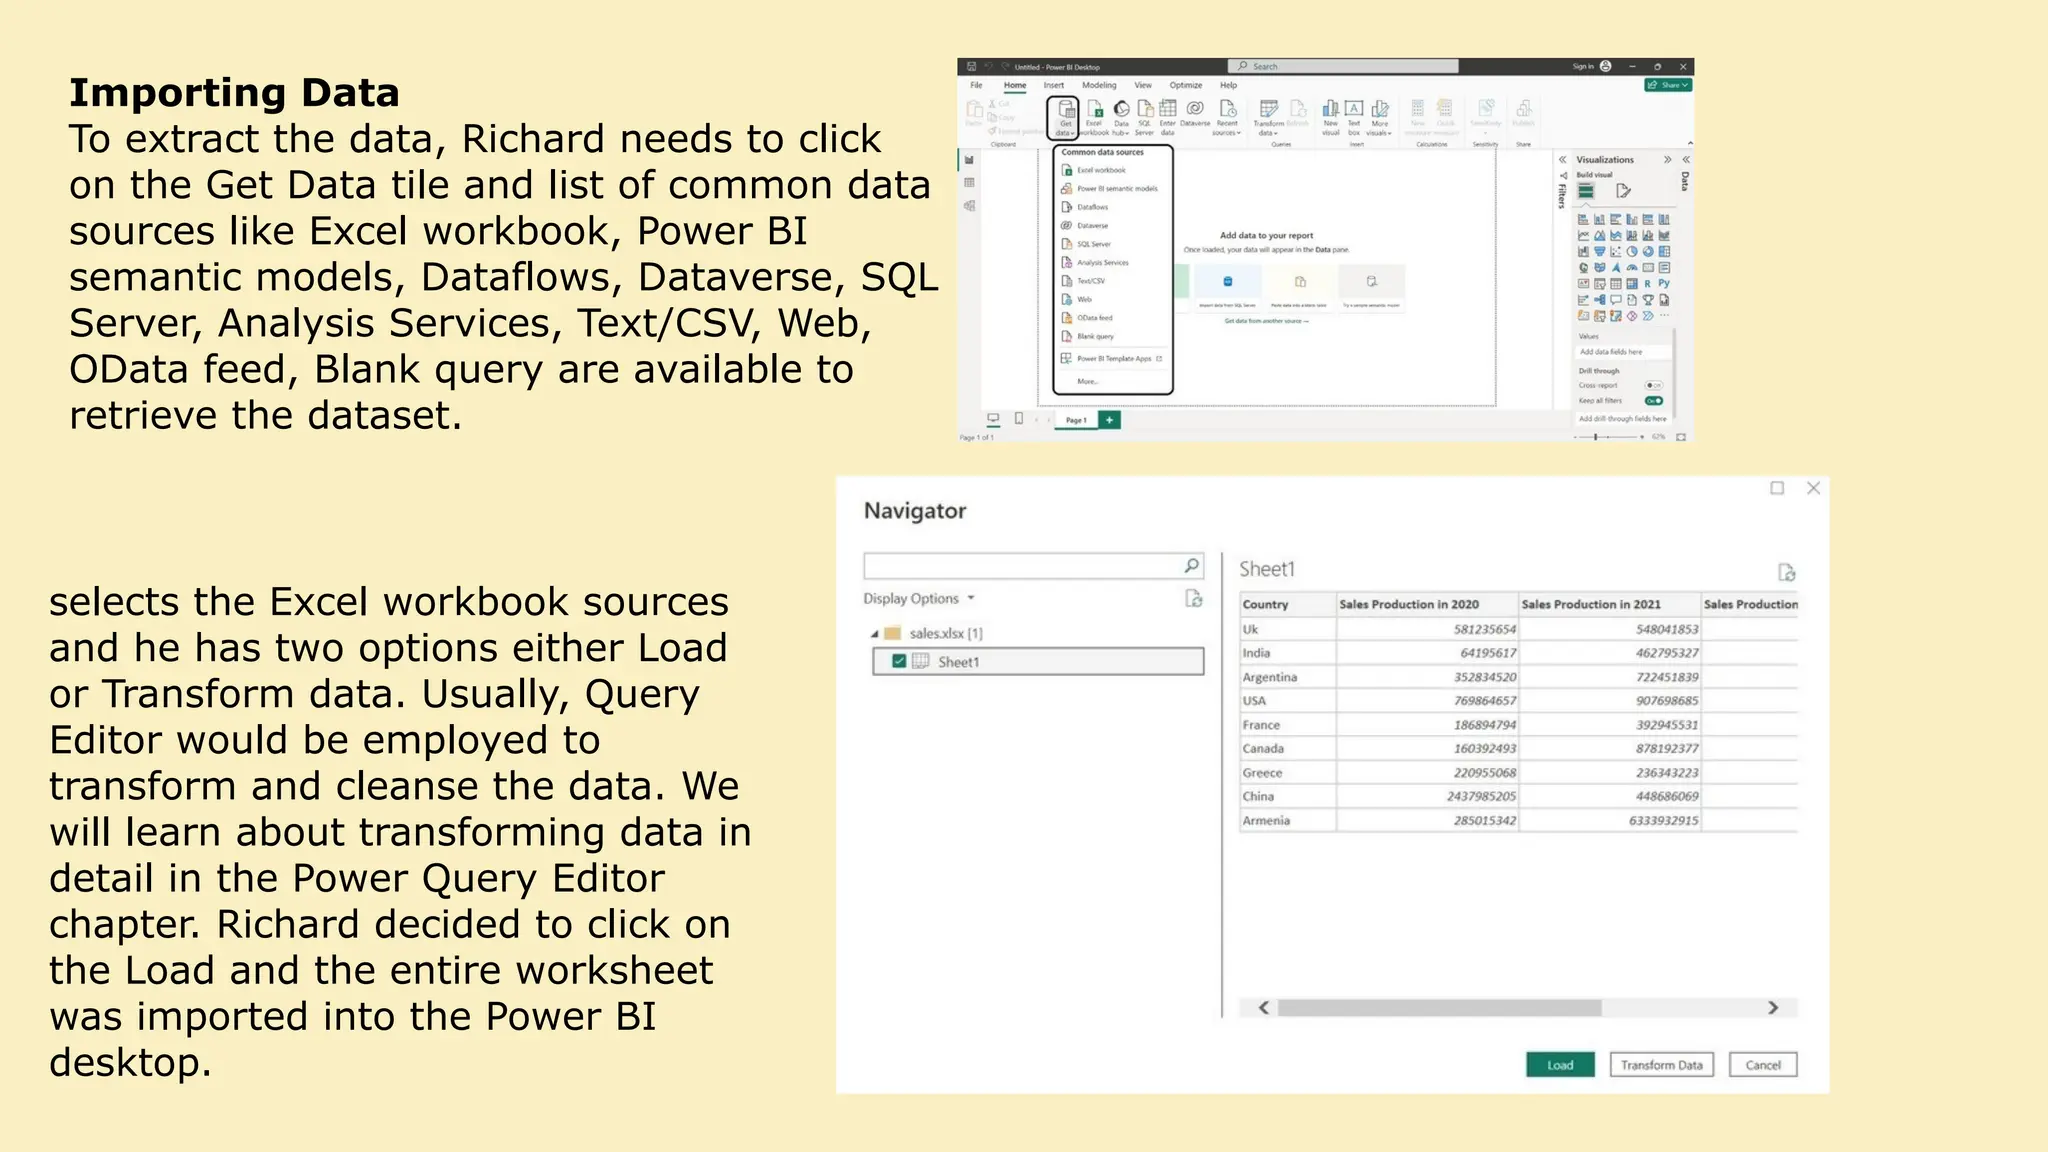
Importing Data To extractthe data, Richard needs to click on the Get Data tile and list of common data sources like Excel workbook, Power BI semantic models, Dataflows, Dataverse, SQL Server, Analysis Services, Text/CSV, Web, OData feed, Blank query are available to retrieve the dataset. selects the Excel workbook sources and he has two options either Load or Transform data. Usually, Query Editor would be employed to transform and cleanse the data. We will learn about transforming data in detail in the Power Query Editor chapter. Richard decided to click on the Load and the entire worksheet was imported into the Power BI desktop.
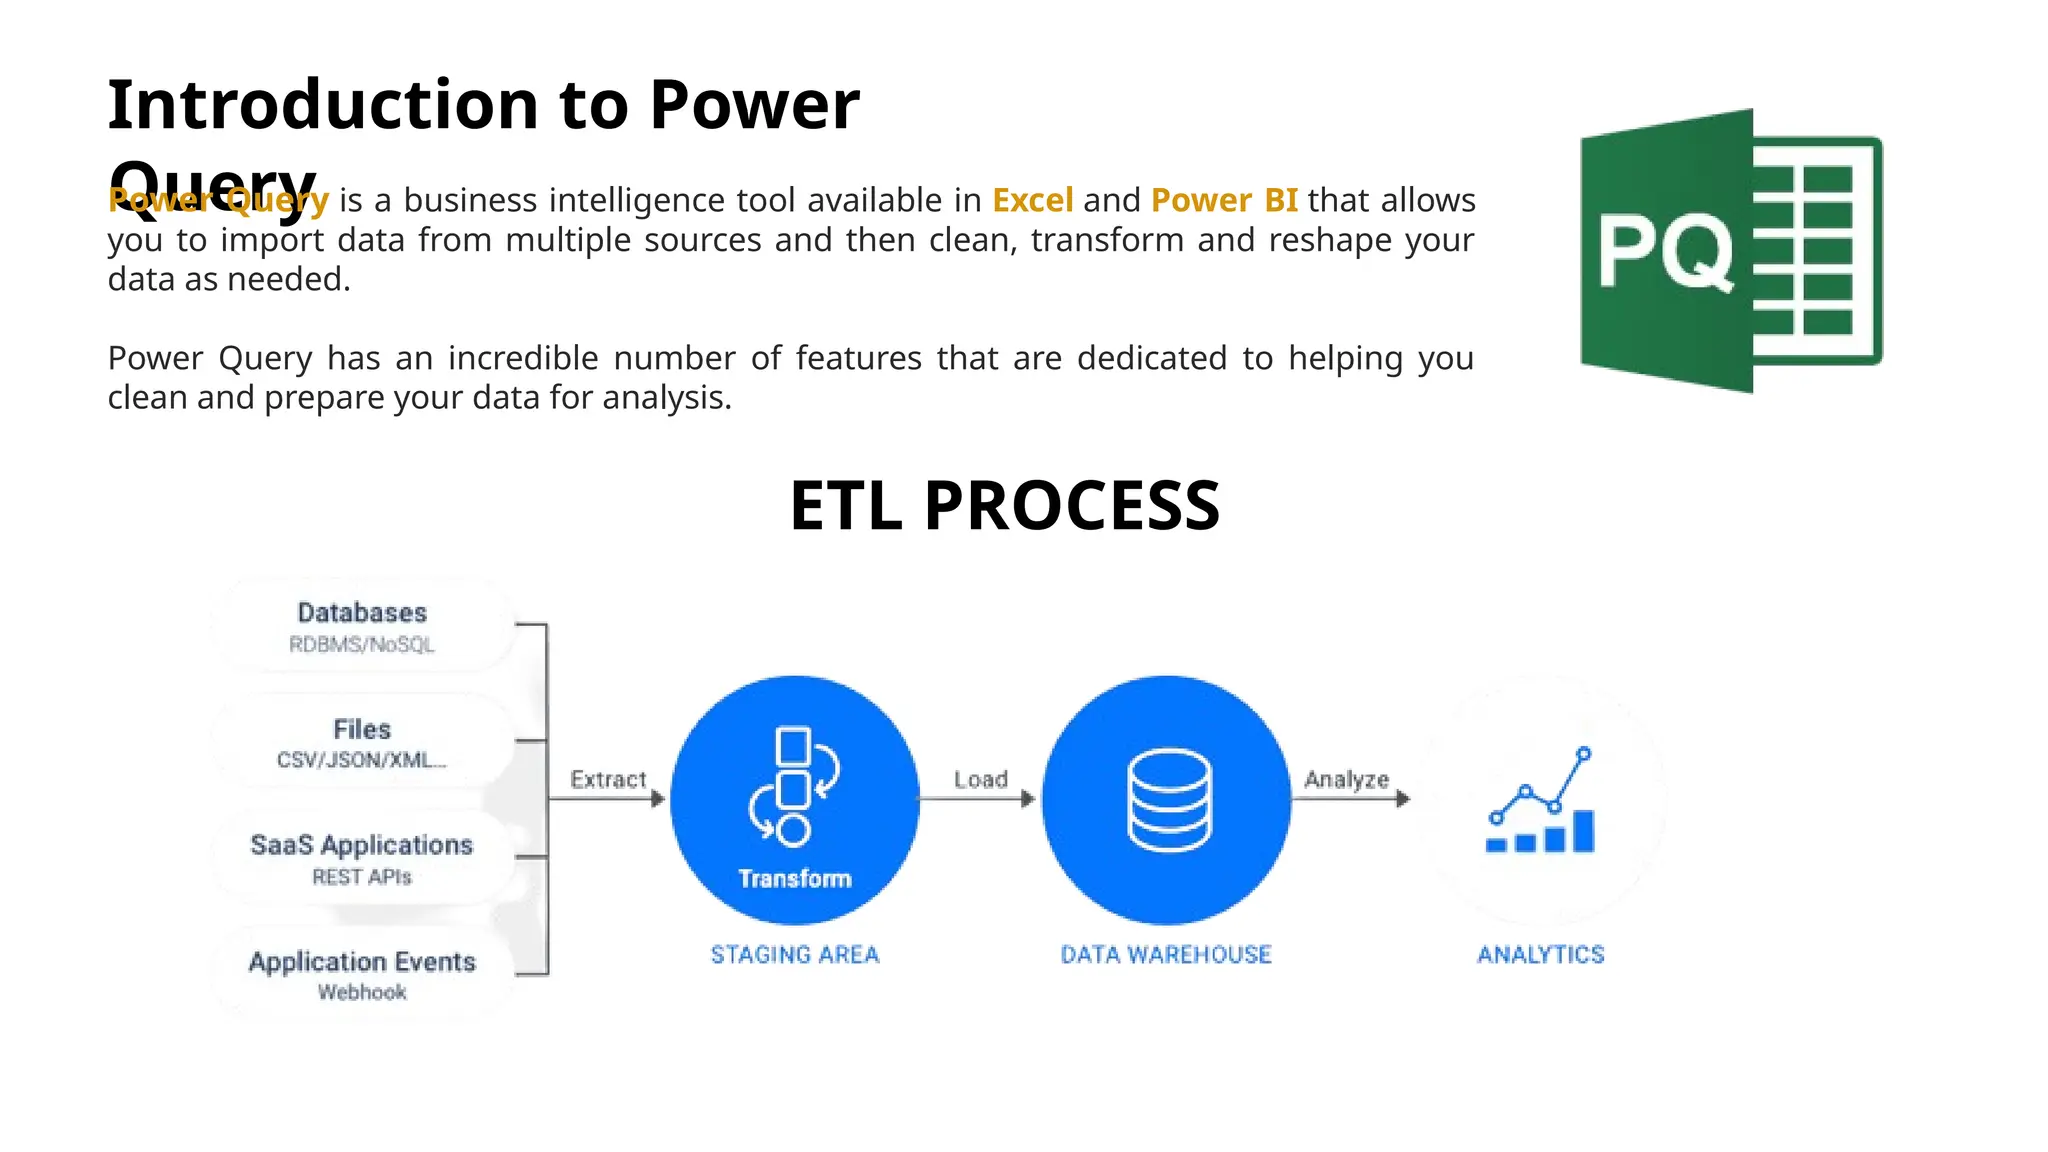
Introduction to Power Query PowerQuery is a business intelligence tool available in Excel and Power BI that allows you to import data from multiple sources and then clean, transform and reshape your data as needed. Power Query has an incredible number of features that are dedicated to helping you clean and prepare your data for analysis. ETL PROCESS
9.
Data Cleaning Data cleaningrefers to the process of preparing and refining your data to ensure its quality, consistency, and accuracy before further analysis or visualization. Power query provides a range of tools and functionalities to help streamline and automate the data cleaning process. • Data Profiling: Power Query provides data profiling capabilities to analyze and understand the characteristics of your data. This includes identifying data types, detecting data distribution, identifying missing values or outliers, and assessing data quality. Here are some common tasks to consider when cleaning data: • Assigning Data Category: Power Query enables you to specify the data category for each column, such as text, numeric, date, or currency. This helps Power BI understand the data type correctly and apply appropriate formatting and calculations. • Renaming Columns: You can easily rename columns in Power Query to make them more descriptive or align them with your preferred naming conventions. • Replacing Values: Power Query allows you to search for specific values within your data and replace them with other values or null/blank values. This is useful for correcting misspellings, standardizing formatting, or handling inconsistent data entries. • Removing Duplicates: Power Query allows you to identify and remove duplicate rows from your data, ensuring only unique records are included in your analysis. • Filtering Rows: You can apply filters to exclude specific rows based on certain conditions, such as removing irrelevant or incomplete data.
10.
Data Transformation &Augmentation Data transformation and augmentation refer to the process of manipulating and reshaping data to make it more suitable for analysis or visualization purposes. 1. Adding Columns Adding columns in Power BI refers to creating new fields in a dataset to enhance data analysis. This can be done using Power Query Editor for transformations or DAX formulas for calculations. It allows users to generate custom calculations, apply conditions, or include indexing. 2. Merging Queries Merging queries is the process of combining two or more tables based on a common column. This technique is useful for integrating related datasets, similar to SQL joins, enabling users to analyze data from multiple sources in a unified view. 3. Appending Queries Appending queries involves stacking datasets on top of each other to form a single table. This method is used when working with datasets that have the same structure but contain different records, effectively increasing the dataset size while maintaining consistency. These transformations help in structuring data efficiently for visualization and reporting in Power BI.
11.
DAX and CreatingMeasures DAX (Data Analysis Expressions) is a formula language in Power BI used to perform calculations and aggregations on data. It enables users to create calculated columns, measures, and tables to derive insights from datasets. •Creating Measures: Measures are dynamic calculations performed on data at the time of visualization. Unlike calculated columns, measures are optimized for performance and do not take up storage space. They are created using DAX formulas in the "Modeling" tab. Example of a measure calculating total sales: TotalSales = SUM(Sales[Amount]) Measures update dynamically based on the applied filters and visual context in reports.

![DAX and Creating Measures DAX (Data Analysis Expressions) is a formula language in Power BI used to perform calculations and aggregations on data. It enables users to create calculated columns, measures, and tables to derive insights from datasets. •Creating Measures: Measures are dynamic calculations performed on data at the time of visualization. Unlike calculated columns, measures are optimized for performance and do not take up storage space. They are created using DAX formulas in the "Modeling" tab. Example of a measure calculating total sales: TotalSales = SUM(Sales[Amount]) Measures update dynamically based on the applied filters and visual context in reports.](https://image.slidesharecdn.com/presentationslides-250603135755-ea92bc9d/75/Power-BI-2-data-analysis-power-point-file-11-2048.jpg)